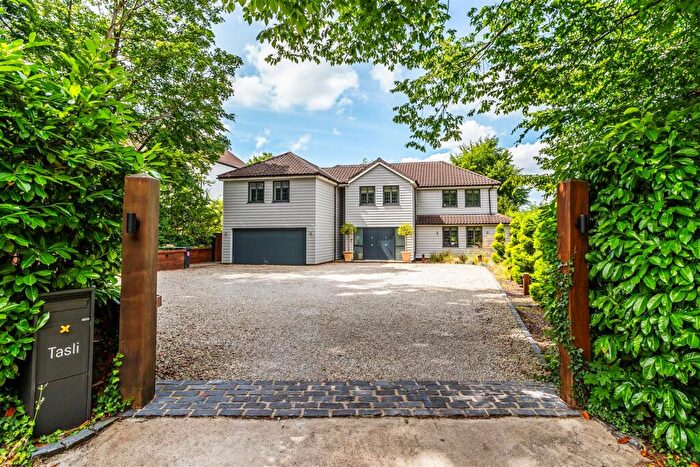
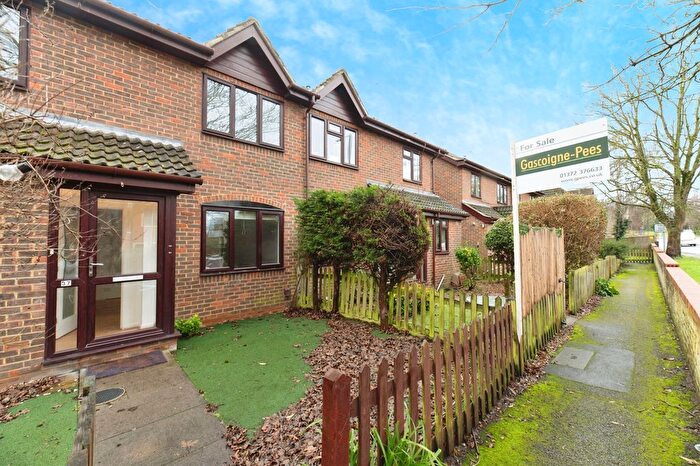
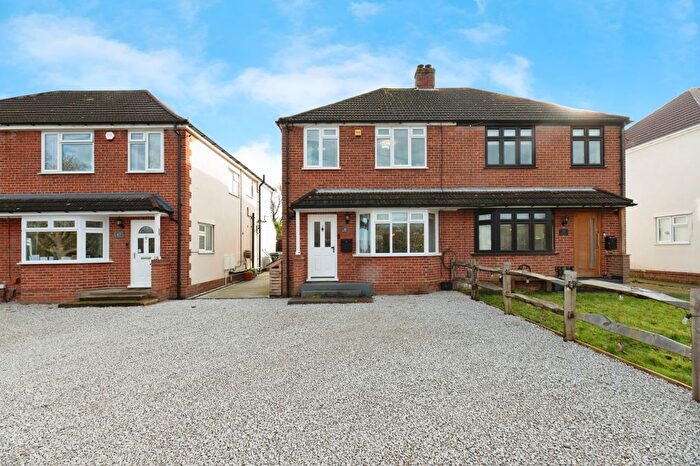
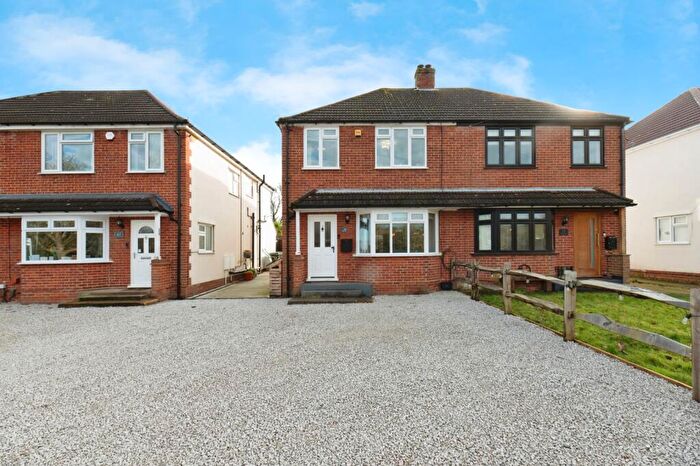
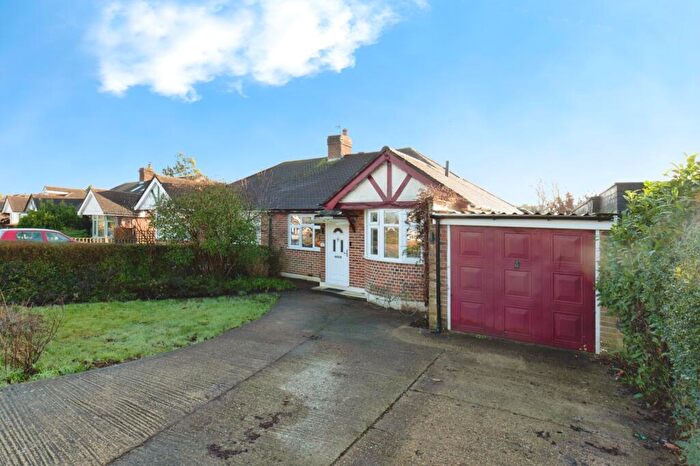
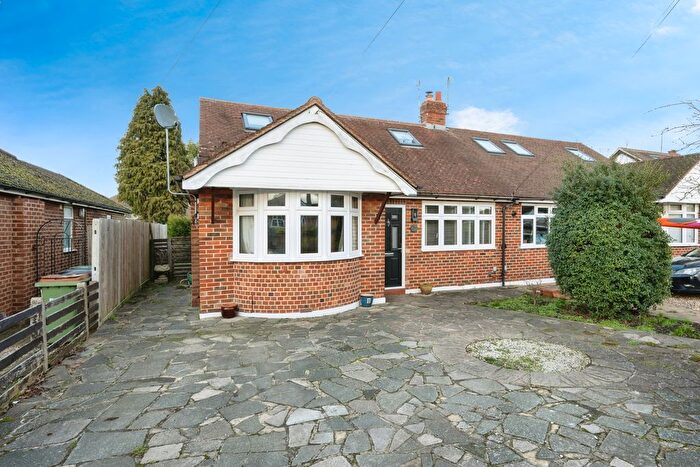
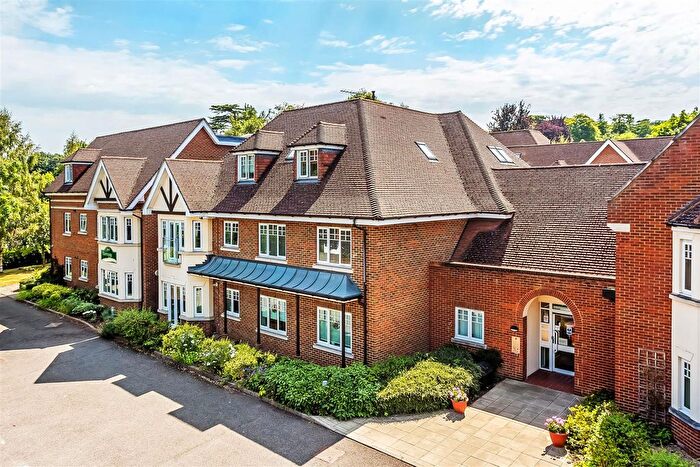
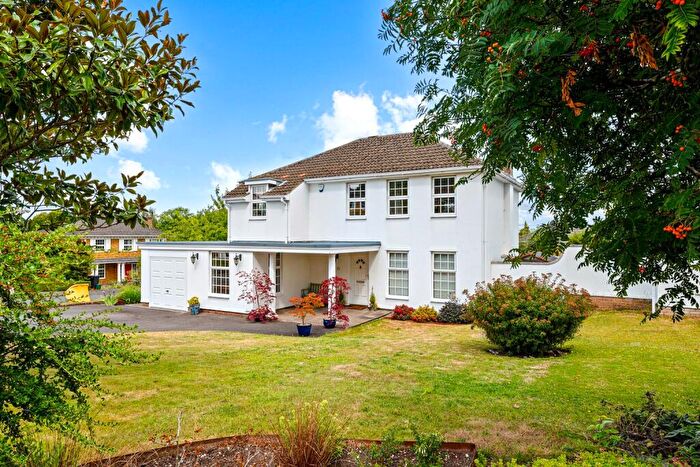
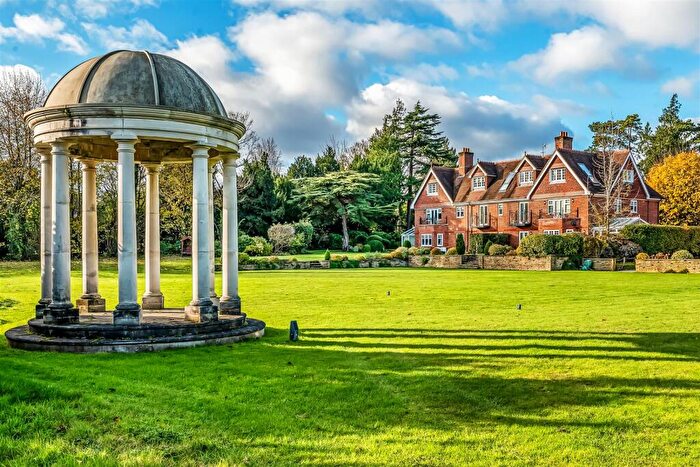
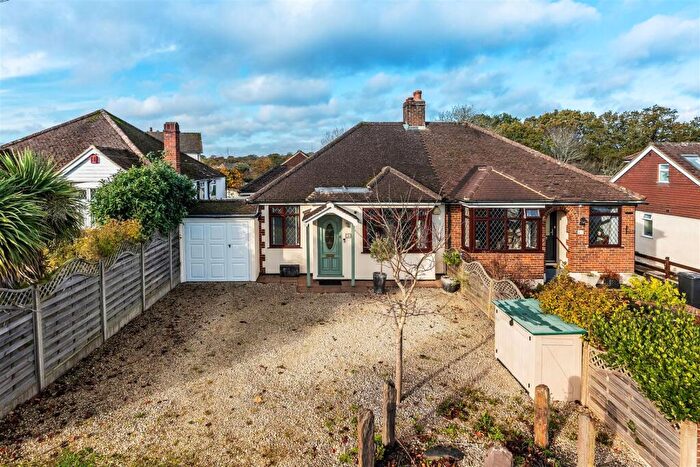
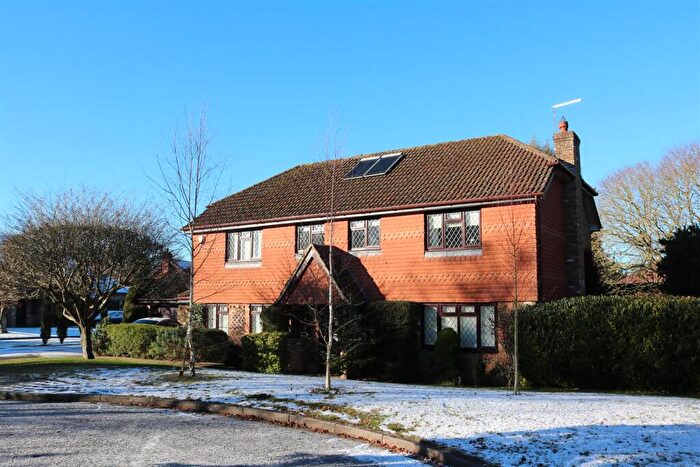
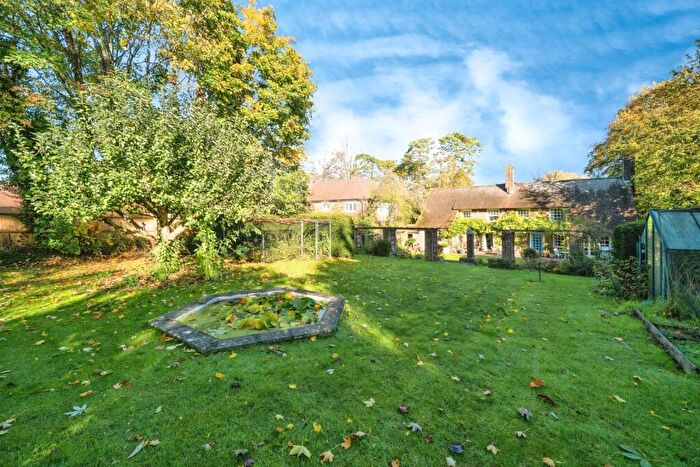
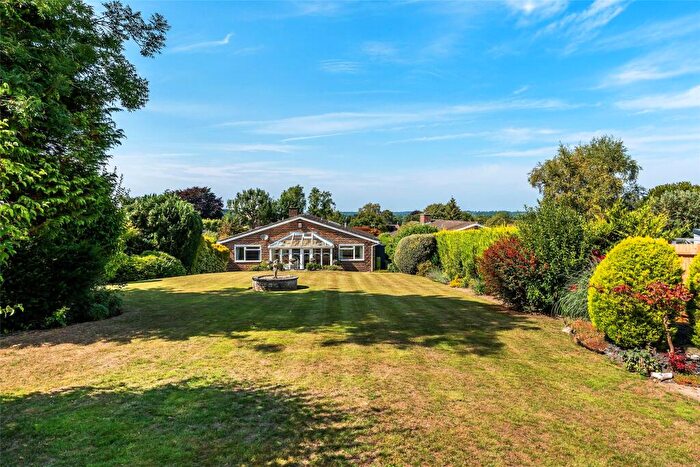
Houses for sale & to rent in Fetcham East, Leatherhead
House Prices in Fetcham East
Properties in Fetcham East have an average house price of £863,464.00 and had 155 Property Transactions within the last 3 years¹.
Fetcham East is an area in Leatherhead, Surrey with 1,506 households², where the most expensive property was sold for £2,155,000.00.
Properties for sale in Fetcham East
Roads and Postcodes in Fetcham East
Navigate through our locations to find the location of your next house in Fetcham East, Leatherhead for sale or to rent.
| Streets | Postcodes |
|---|---|
| Arbour Close | KT22 9DZ |
| Badingham Drive | KT22 9ES KT22 9EU KT22 9HA |
| Beech Close | KT22 9FJ |
| Cannon Grove | KT22 9JY KT22 9JZ KT22 9LG KT22 9LH KT22 9LP KT22 9LS |
| Cannon Way | KT22 9FE KT22 9LJ KT22 9LN |
| Cannonside | KT22 9LE |
| Cedar Drive | KT22 9ET |
| Church Close | KT22 9BQ |
| Churchill Close | KT22 9EY |
| Cobham Road | KT22 9AR KT22 9AU KT22 9AW KT22 9AY KT22 9HT KT22 9JF KT22 9JQ KT22 9JR KT22 9JS KT22 9LL |
| Crescent Cottages | KT22 9JA |
| Dell Close | KT22 9HB |
| Drayton Close | KT22 9EZ |
| Elmer Cottages | KT22 9BU KT22 9BX KT22 9DH |
| Elmer Mews | KT22 9DN |
| Elmer Works | KT22 9DA |
| Farm Close | KT22 9BJ |
| Ferngrove Close | KT22 9EQ |
| Fetcham Downs | KT22 9BP |
| Fetcham Park Drive | KT22 9ED |
| Fox Covert | KT22 9XD |
| Guildford Road | KT22 9BW KT22 9DJ KT22 9DP KT22 9DS KT22 9DY KT22 9GS KT22 9DX KT22 9UT |
| Hawks Hill Close | KT22 9DL |
| High Acre Close | KT22 9FH |
| Highfields | KT22 9XA |
| Home Close | KT22 9JN |
| Huntsmans Close | KT22 9XG |
| Keswick Road | KT22 9HQ |
| Links Brow | KT22 9DU |
| Lower Road | KT22 9EJ KT22 9EL KT22 9ER KT22 9EW KT22 9HD KT22 9HG |
| Medefield | KT22 9XB |
| Mill Lane | KT22 9AA |
| Mount Close | KT22 9EF |
| Norbury Place | KT22 9FA |
| Nutcroft Grove | KT22 9LA KT22 9LD |
| Oaklands | KT22 9BY |
| Overlord Court | KT22 9JP |
| Park Close | KT22 9BD |
| Pound Crescent | KT22 9JL KT22 9JW |
| Raymead Close | KT22 9LU |
| Raymead Way | KT22 9LY |
| Redleaf Close | KT22 9AB |
| Ridgelands | KT22 9DB |
| Ridgeway Close | KT22 9BF |
| Rookery Close | KT22 9BG |
| School Lane | KT22 9JX |
| Shamrock Close | KT22 9JG |
| St Marys Close | KT22 9HE |
| Sumner Close | KT22 9XF |
| Sunmead Close | KT22 9AP |
| Sunmead Parade | KT22 9AL |
| Sycamore Close | KT22 9EX |
| Ten Acres | KT22 9XQ |
| Ten Acres Close | KT22 9XS |
| The Ballands North | KT22 9HU |
| The Ballands South | KT22 9EP |
| The Beeches | KT22 9DT |
| The Berkeleys | KT22 9DW |
| The Croft | KT22 9FL |
| The Drive | KT22 9EN |
| The Green | KT22 9XE |
| The Laurells | KT22 9GZ |
| The Mount | KT22 9EA KT22 9EB KT22 9EE KT22 9EG |
| The Old Street | KT22 9QJ |
| The Ridge | KT22 9DD |
| The Ridgeway | KT22 9AZ KT22 9BA KT22 9BB KT22 9BE KT22 9BH KT22 9BN |
| Tyrrells Close | KT22 9FG |
| KT22 9FN |
Transport near Fetcham East
-
Leatherhead Station
-
Bookham Station
-
Boxhill and Westhumble Station
-
Cobham and Stoke D'abernon Station
-
Ashtead Station
- FAQ
- Price Paid By Year
- Property Type Price
Frequently asked questions about Fetcham East
What is the average price for a property for sale in Fetcham East?
The average price for a property for sale in Fetcham East is £863,464. This amount is 4% higher than the average price in Leatherhead. There are 344 property listings for sale in Fetcham East.
What streets have the most expensive properties for sale in Fetcham East?
The streets with the most expensive properties for sale in Fetcham East are The Mount at an average of £1,596,666, Keswick Road at an average of £1,405,000 and Farm Close at an average of £1,384,166.
What streets have the most affordable properties for sale in Fetcham East?
The streets with the most affordable properties for sale in Fetcham East are Elmer Mews at an average of £275,857, Shamrock Close at an average of £361,666 and Elmer Cottages at an average of £362,192.
Which train stations are available in or near Fetcham East?
Some of the train stations available in or near Fetcham East are Leatherhead, Bookham and Boxhill and Westhumble.
Property Price Paid in Fetcham East by Year
The average sold property price by year was:
| Year | Average Sold Price | Price Change |
Sold Properties
|
|---|---|---|---|
| 2025 | £733,576 | -26% |
39 Properties |
| 2024 | £926,904 | 7% |
78 Properties |
| 2023 | £866,551 | -2% |
38 Properties |
| 2022 | £884,570 | 4% |
62 Properties |
| 2021 | £847,296 | 8% |
72 Properties |
| 2020 | £780,846 | 10% |
68 Properties |
| 2019 | £702,738 | -14% |
52 Properties |
| 2018 | £802,310 | 5% |
52 Properties |
| 2017 | £760,219 | -12% |
63 Properties |
| 2016 | £848,590 | 29% |
50 Properties |
| 2015 | £598,516 | 1% |
51 Properties |
| 2014 | £591,539 | -5% |
68 Properties |
| 2013 | £618,159 | 4% |
45 Properties |
| 2012 | £592,155 | 5% |
54 Properties |
| 2011 | £560,311 | -0,3% |
47 Properties |
| 2010 | £562,092 | 12% |
48 Properties |
| 2009 | £492,309 | 4% |
41 Properties |
| 2008 | £474,675 | 7% |
23 Properties |
| 2007 | £439,931 | -6% |
72 Properties |
| 2006 | £465,777 | 4% |
109 Properties |
| 2005 | £447,078 | 25% |
47 Properties |
| 2004 | £333,597 | -6% |
62 Properties |
| 2003 | £353,723 | -3% |
66 Properties |
| 2002 | £365,714 | 12% |
80 Properties |
| 2001 | £320,875 | 13% |
84 Properties |
| 2000 | £277,657 | 22% |
58 Properties |
| 1999 | £216,808 | 7% |
87 Properties |
| 1998 | £201,550 | 12% |
85 Properties |
| 1997 | £177,891 | 18% |
63 Properties |
| 1996 | £146,695 | -8% |
98 Properties |
| 1995 | £158,280 | - |
45 Properties |
Property Price per Property Type in Fetcham East
Here you can find historic sold price data in order to help with your property search.
The average Property Paid Price for specific property types in the last three years are:
| Property Type | Average Sold Price | Sold Properties |
|---|---|---|
| Semi Detached House | £597,642.00 | 38 Semi Detached Houses |
| Detached House | £1,153,495.00 | 86 Detached Houses |
| Terraced House | £425,954.00 | 11 Terraced Houses |
| Flat | £362,023.00 | 20 Flats |

