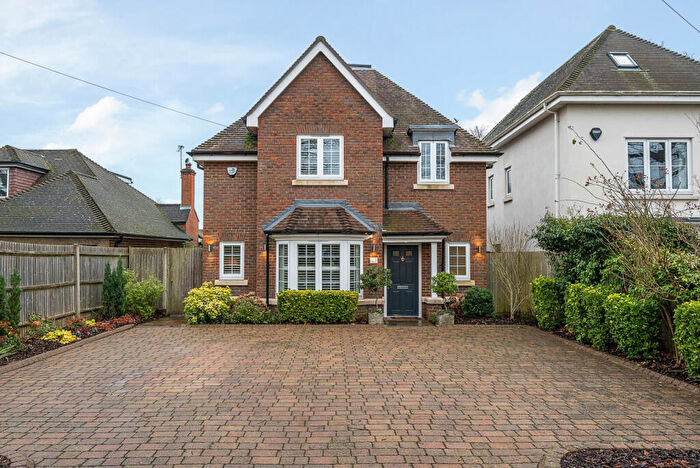
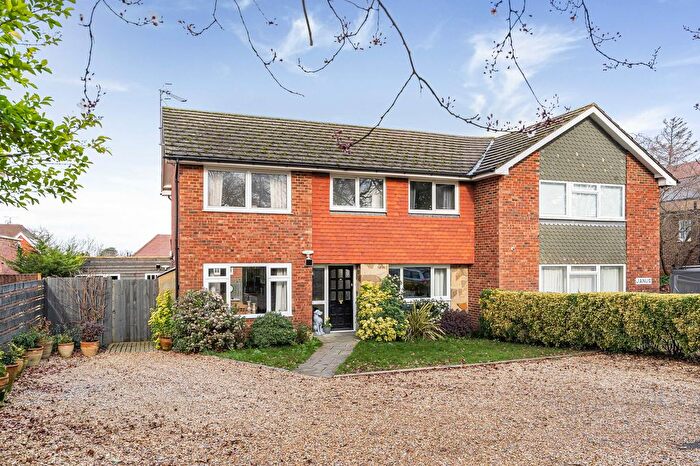
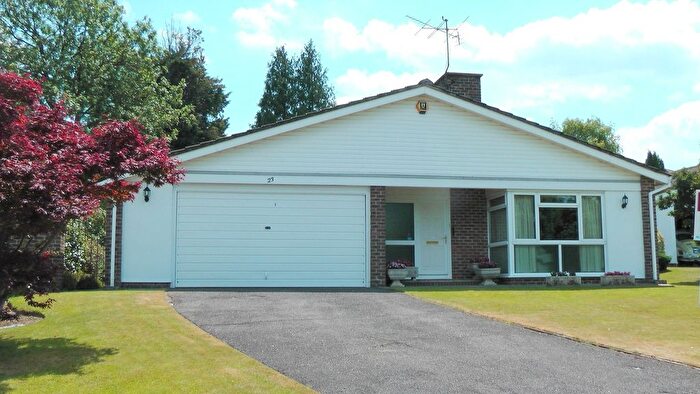
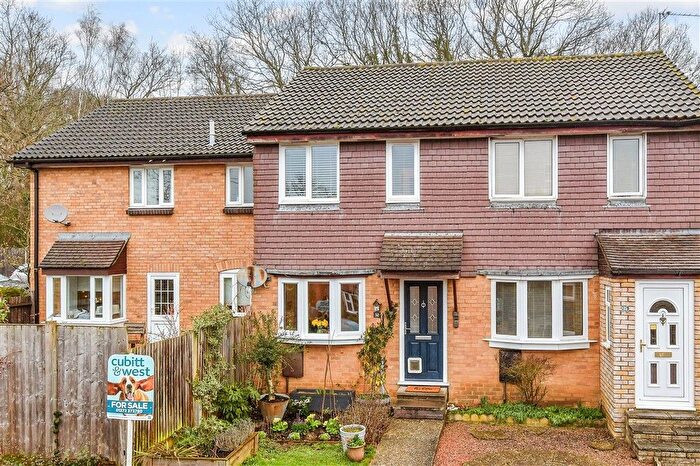
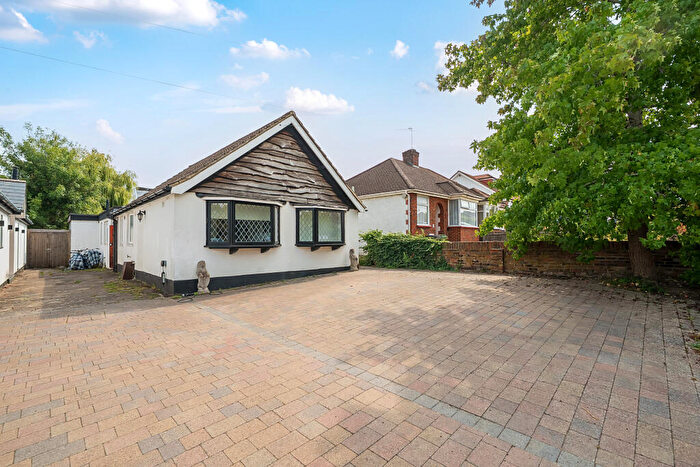
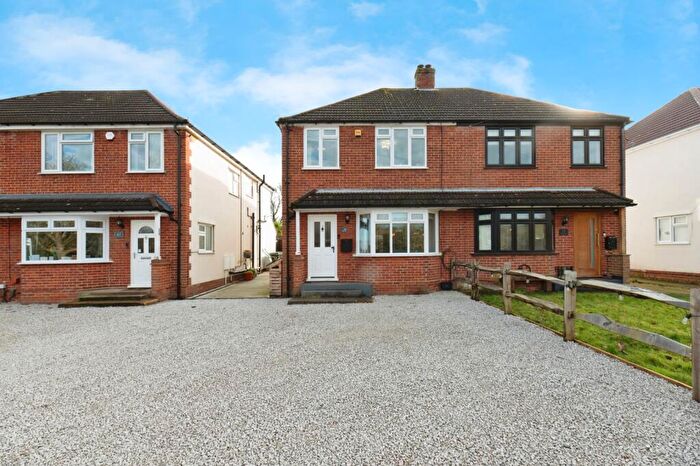
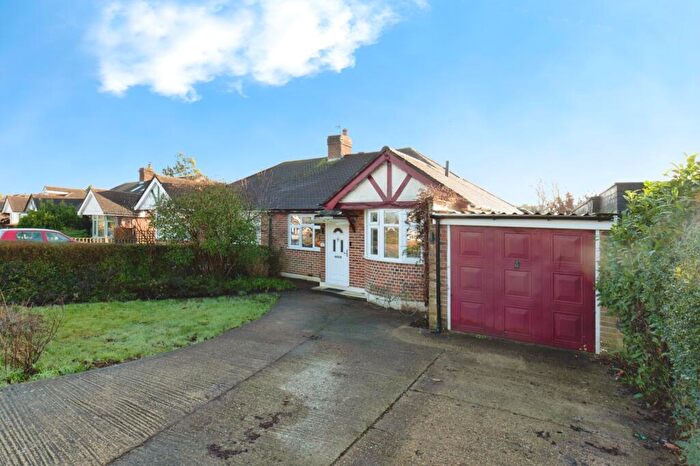
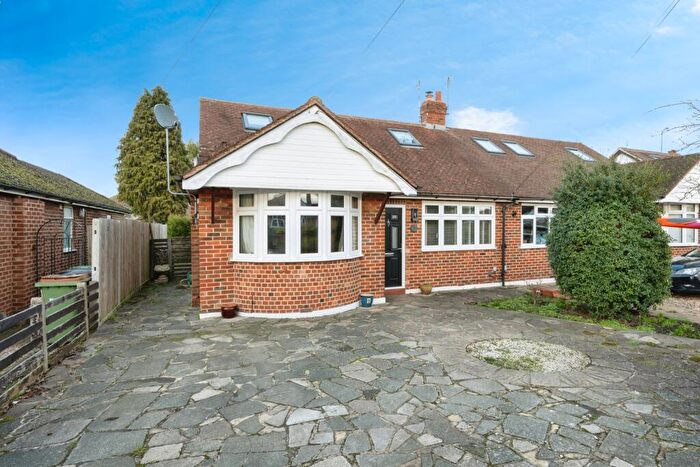
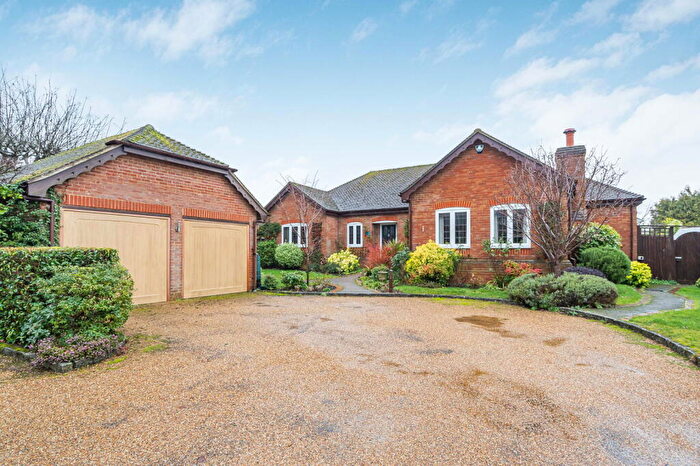
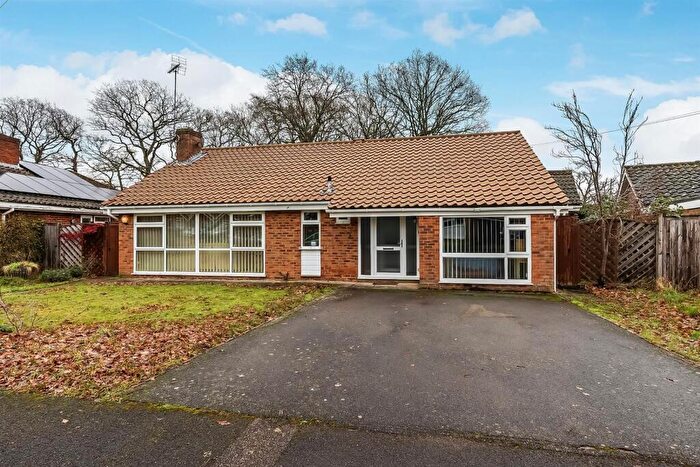
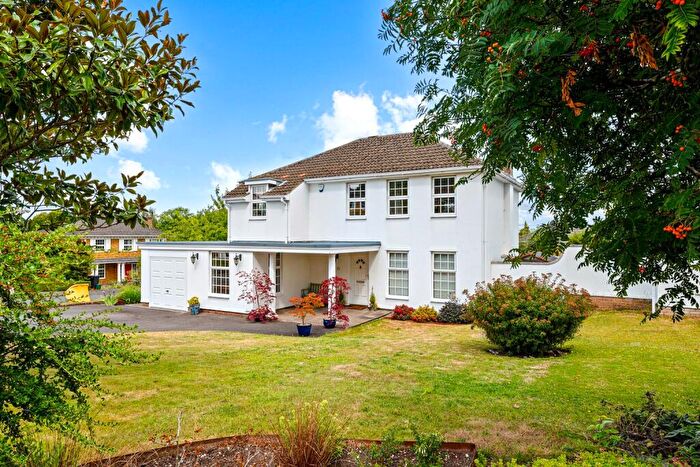
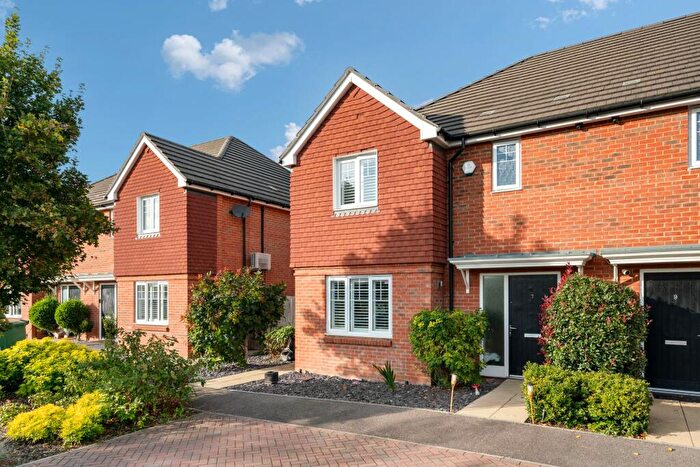
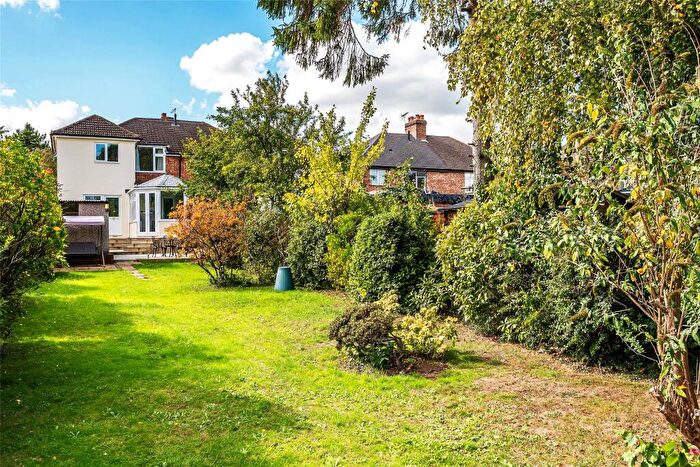
Houses for sale & to rent in Fetcham West, Leatherhead
House Prices in Fetcham West
Properties in Fetcham West have an average house price of £715,576.00 and had 162 Property Transactions within the last 3 years¹.
Fetcham West is an area in Leatherhead, Surrey with 1,591 households², where the most expensive property was sold for £1,510,000.00.
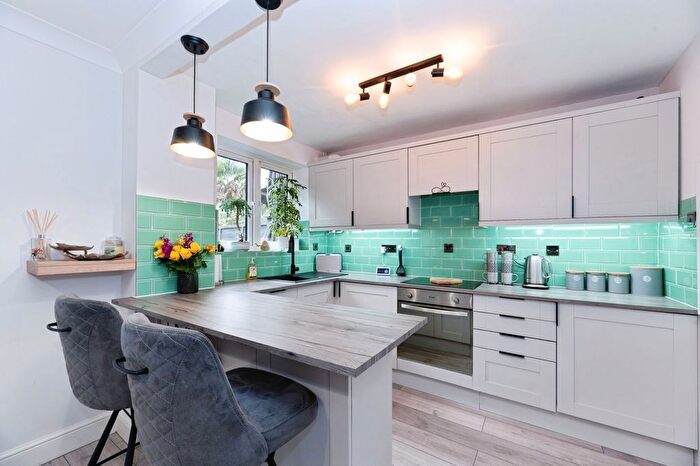
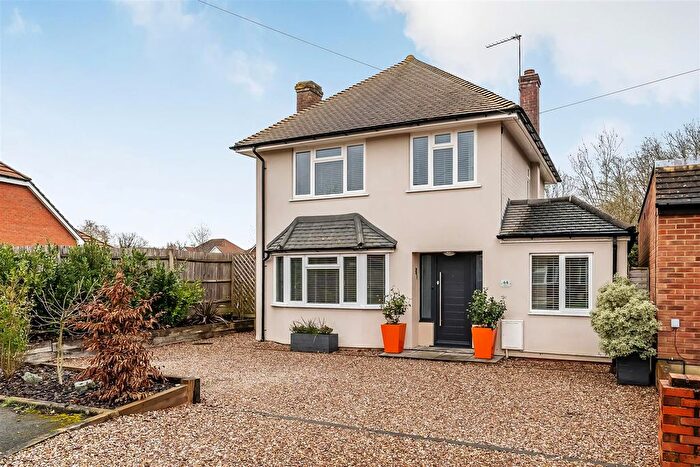
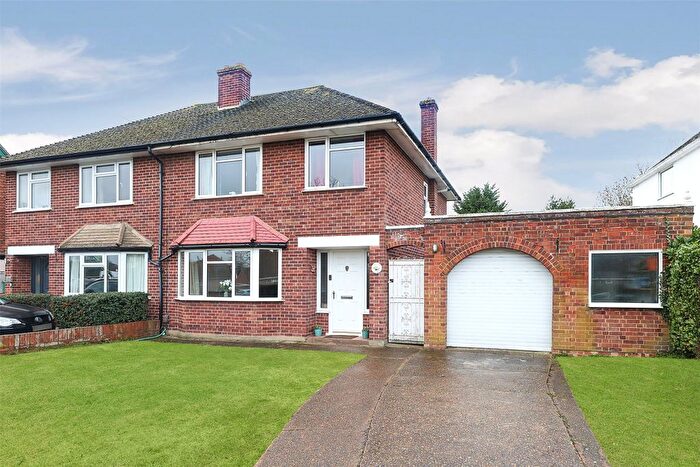
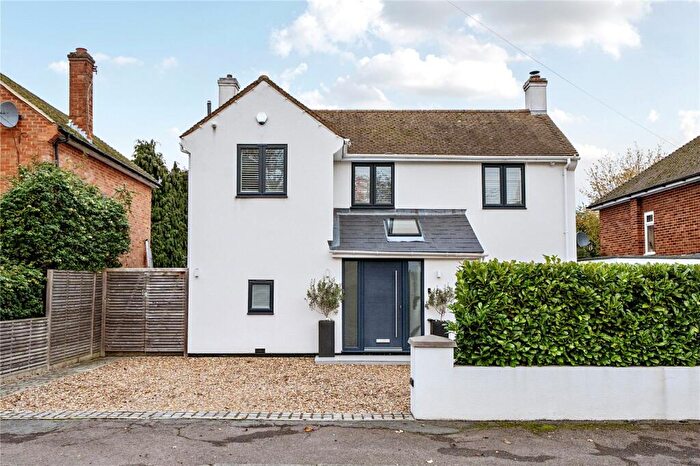
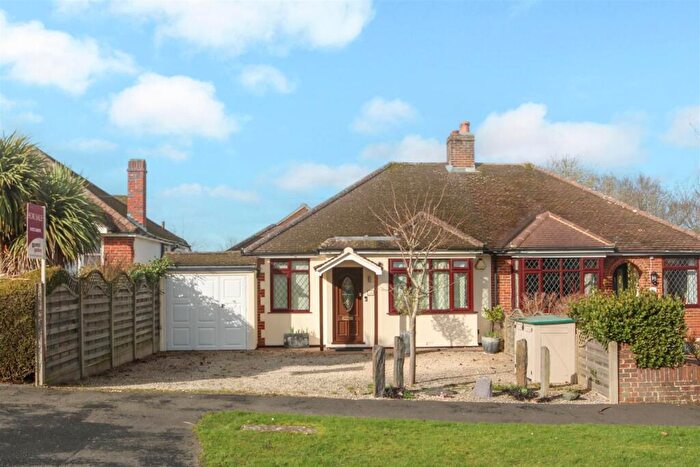
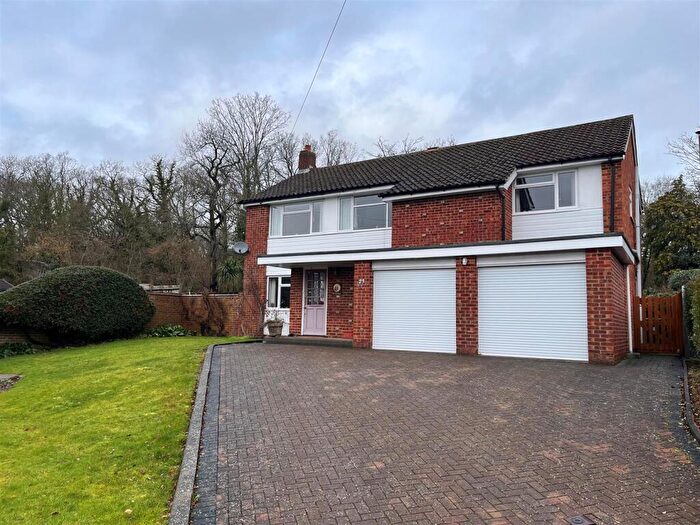
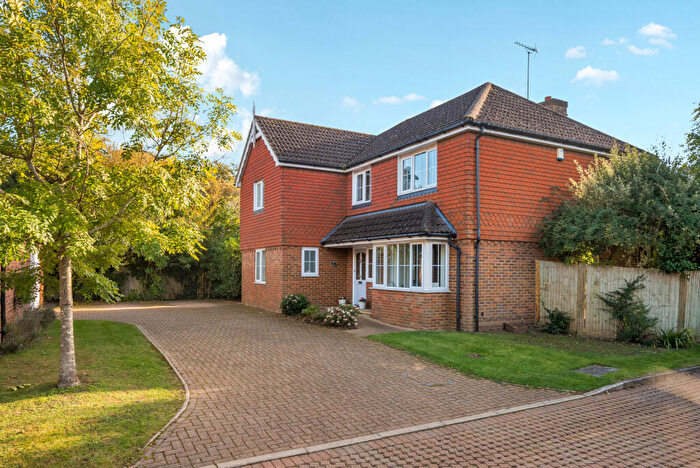
Properties for sale in Fetcham West
Roads and Postcodes in Fetcham West
Navigate through our locations to find the location of your next house in Fetcham West, Leatherhead for sale or to rent.
| Streets | Postcodes |
|---|---|
| Appletree Close | KT22 9PL |
| Ashwood Park | KT22 9NT |
| Barclay Close | KT22 9SY |
| Bell Lane | KT22 9ND KT22 9NF |
| Bell Lane Close | KT22 9NE |
| Bickney Way | KT22 9QQ |
| Bushy Road | KT22 9SX |
| Cobham Road | KT22 9HX KT22 9JD KT22 9JE KT22 9RH KT22 9RT KT22 9SA KT22 9SF KT22 9SH KT22 9SJ KT22 9RU KT22 9SL KT22 9TP |
| Cock Lane | KT22 9TT KT22 9UH |
| Copperfields | KT22 9PA KT22 9PD |
| Fetcham Common Lane | KT22 9SQ KT22 9SG |
| Friars Orchard | KT22 9RL |
| Gatesden Close | KT22 9QX |
| Gatesden Road | KT22 9QP KT22 9QR KT22 9QW |
| Hazel Parade | KT22 9PY |
| Hazel Way | KT22 9QD KT22 9QF |
| Hazelway Close | KT22 9QE |
| Hill Road | KT22 9SZ |
| Hilley Field Lane | KT22 9UP KT22 9UU KT22 9UX |
| Humphrey Close | KT22 9PZ |
| Kennel Close | KT22 9PF |
| Kennel Lane | KT22 9PG KT22 9PH KT22 9PJ KT22 9PN KT22 9PQ KT22 9PR KT22 9PW |
| Langaller Lane | KT22 9SN |
| Lodge Close | KT22 9QZ |
| Lodge Road | KT22 9QY |
| Lower Road | KT22 9HF KT22 9NG |
| Maplehurst | KT22 9NB |
| Meadow Lane | KT22 9UW |
| Mole Road | KT22 9RN |
| Monks Green | KT22 9TL KT22 9TW |
| Oakbank | KT22 9LZ |
| Orchard Close | KT22 9HZ KT22 9JB |
| Osprey Close | KT22 9XL |
| Oswald Close | KT22 9UA KT22 9UG |
| Oswald Road | KT22 9TZ |
| Parkwood Close | KT22 9FD |
| Penrose Road | KT22 9PU KT22 9QA |
| Revell Close | KT22 9PT |
| Revell Drive | KT22 9PS |
| River Island Close | KT22 9XH |
| River Lane | KT22 9RJ KT22 9RP KT22 9RW KT22 9RZ |
| River Walk | KT22 9FF |
| Salix Close | KT22 9NW |
| Sayers Close | KT22 9PE |
| School Lane | KT22 9JU |
| Sherwood Close | KT22 9QT |
| Stoke Cottages | KT22 9RS |
| The Copse | KT22 9TD |
| The Glade | KT22 9TB KT22 9TF KT22 9TH KT22 9TJ KT22 9TQ |
| The Oaks | KT22 9PP |
| The Old Street | KT22 9QL |
| The Street | KT22 9QN KT22 9QS KT22 9RA KT22 9RB KT22 9RD KT22 9RE KT22 9RF |
| Warenne Road | KT22 9TX KT22 9TY KT22 9UQ |
| Woodside | KT22 9SS |
Transport near Fetcham West
-
Bookham Station
-
Leatherhead Station
-
Cobham and Stoke D'abernon Station
-
Effingham Junction Station
-
Ashtead Station
-
Oxshott Station
- FAQ
- Price Paid By Year
- Property Type Price
Frequently asked questions about Fetcham West
What is the average price for a property for sale in Fetcham West?
The average price for a property for sale in Fetcham West is £715,576. This amount is 13% lower than the average price in Leatherhead. There are 382 property listings for sale in Fetcham West.
What streets have the most expensive properties for sale in Fetcham West?
The streets with the most expensive properties for sale in Fetcham West are Lower Road at an average of £1,429,333, School Lane at an average of £1,360,000 and Kennel Close at an average of £1,350,000.
What streets have the most affordable properties for sale in Fetcham West?
The streets with the most affordable properties for sale in Fetcham West are Oswald Close at an average of £393,250, Oswald Road at an average of £415,000 and Copperfields at an average of £431,750.
Which train stations are available in or near Fetcham West?
Some of the train stations available in or near Fetcham West are Bookham, Leatherhead and Cobham and Stoke D'abernon.
Property Price Paid in Fetcham West by Year
The average sold property price by year was:
| Year | Average Sold Price | Price Change |
Sold Properties
|
|---|---|---|---|
| 2025 | £706,505 | 2% |
45 Properties |
| 2024 | £695,579 | -10% |
78 Properties |
| 2023 | £766,036 | 3% |
39 Properties |
| 2022 | £744,077 | 10% |
73 Properties |
| 2021 | £673,147 | 7% |
90 Properties |
| 2020 | £627,963 | 12% |
64 Properties |
| 2019 | £555,020 | -7% |
72 Properties |
| 2018 | £593,894 | -4% |
58 Properties |
| 2017 | £619,988 | 2% |
69 Properties |
| 2016 | £607,131 | 17% |
65 Properties |
| 2015 | £502,439 | -8% |
67 Properties |
| 2014 | £542,752 | 15% |
58 Properties |
| 2013 | £459,738 | 11% |
73 Properties |
| 2012 | £409,875 | 1% |
63 Properties |
| 2011 | £404,070 | -6% |
69 Properties |
| 2010 | £427,921 | 23% |
69 Properties |
| 2009 | £329,645 | -18% |
46 Properties |
| 2008 | £389,467 | -6% |
49 Properties |
| 2007 | £410,922 | 9% |
99 Properties |
| 2006 | £373,857 | -0,2% |
76 Properties |
| 2005 | £374,741 | 12% |
84 Properties |
| 2004 | £329,450 | 14% |
100 Properties |
| 2003 | £284,332 | 2% |
65 Properties |
| 2002 | £277,897 | 15% |
118 Properties |
| 2001 | £237,022 | 8% |
104 Properties |
| 2000 | £217,111 | 17% |
68 Properties |
| 1999 | £180,594 | 17% |
116 Properties |
| 1998 | £149,385 | 13% |
106 Properties |
| 1997 | £129,656 | 12% |
67 Properties |
| 1996 | £113,986 | -2% |
88 Properties |
| 1995 | £116,024 | - |
72 Properties |
Property Price per Property Type in Fetcham West
Here you can find historic sold price data in order to help with your property search.
The average Property Paid Price for specific property types in the last three years are:
| Property Type | Average Sold Price | Sold Properties |
|---|---|---|
| Semi Detached House | £591,371.00 | 67 Semi Detached Houses |
| Detached House | £933,625.00 | 72 Detached Houses |
| Terraced House | £386,025.00 | 20 Terraced Houses |
| Flat | £453,333.00 | 3 Flats |

