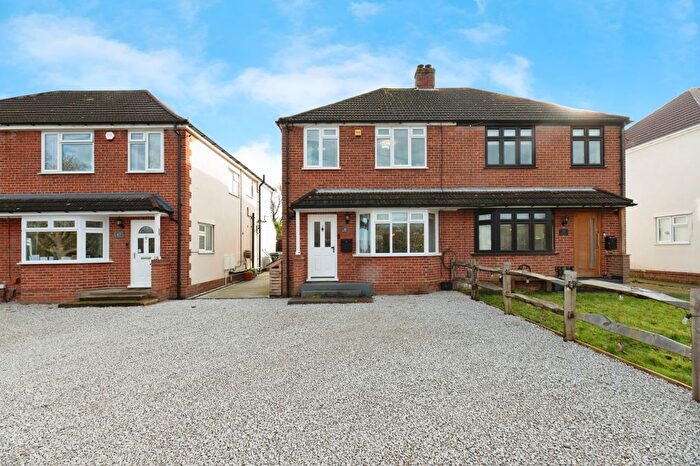
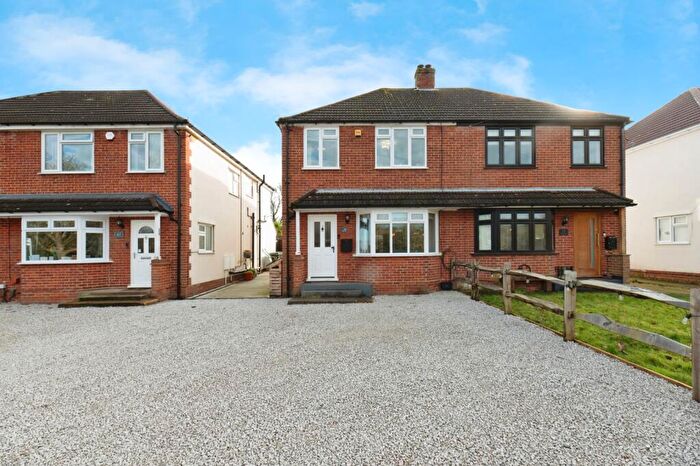
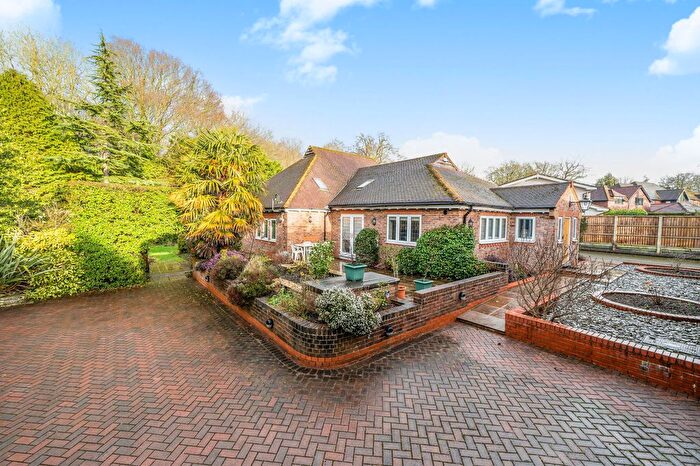
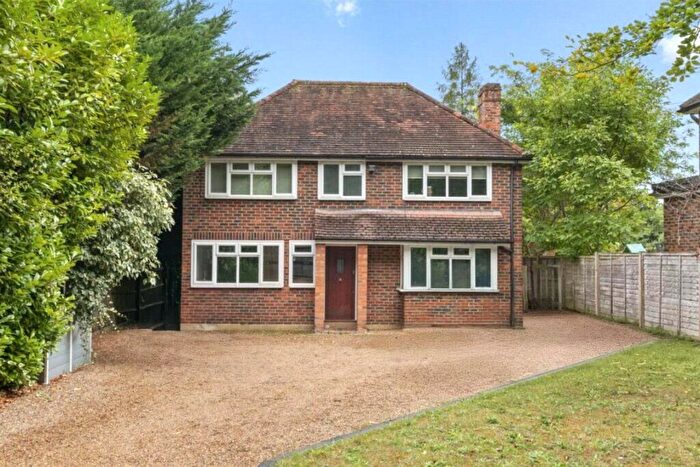
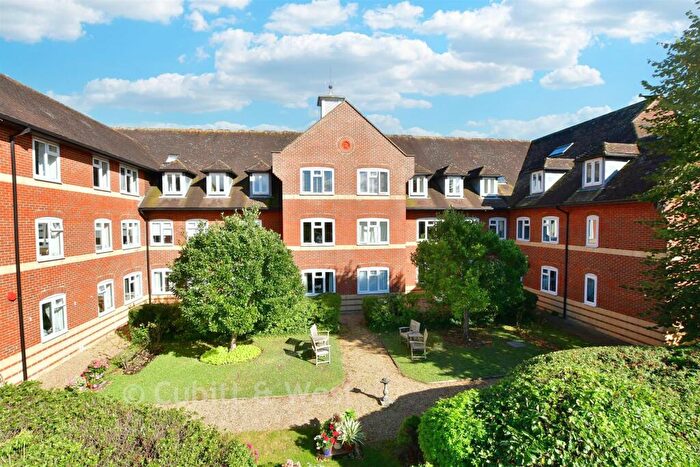
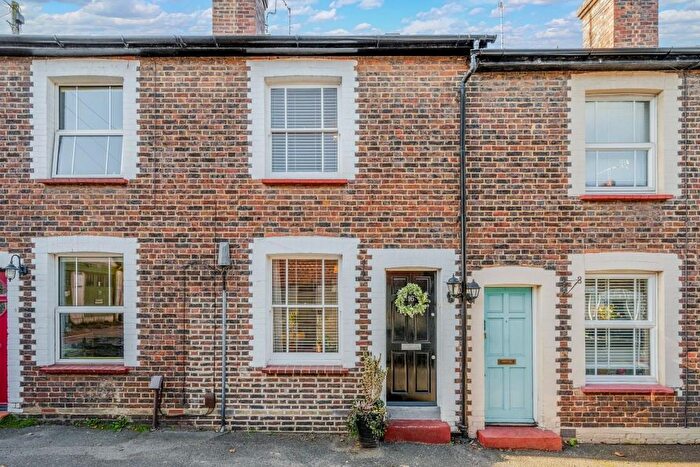
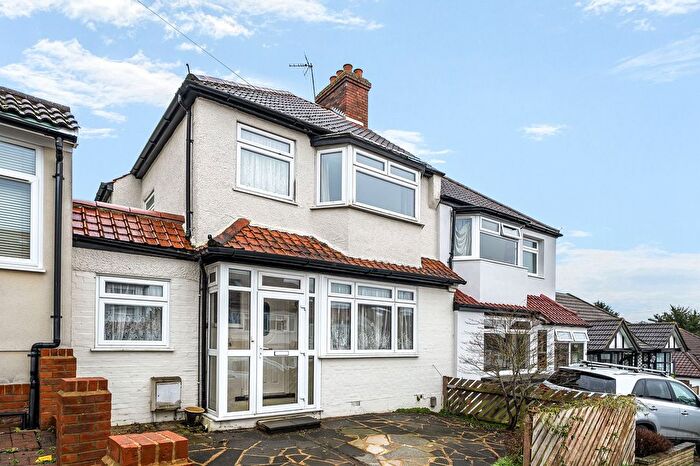
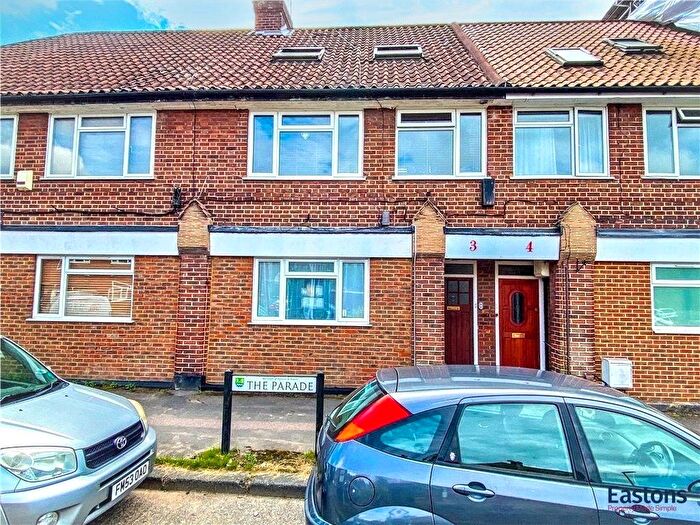
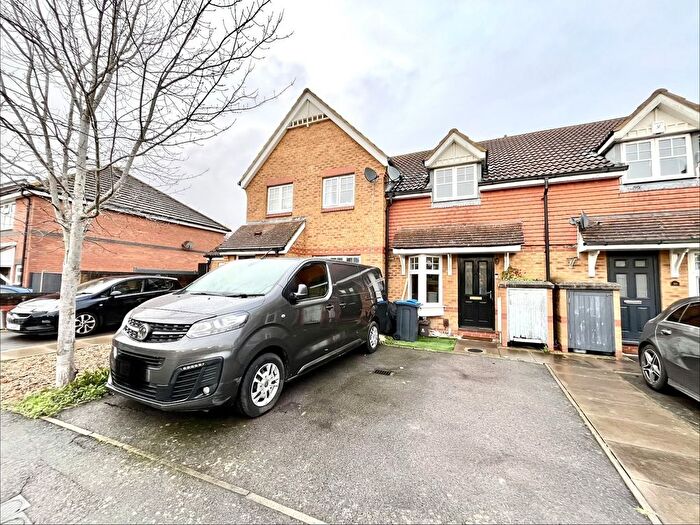
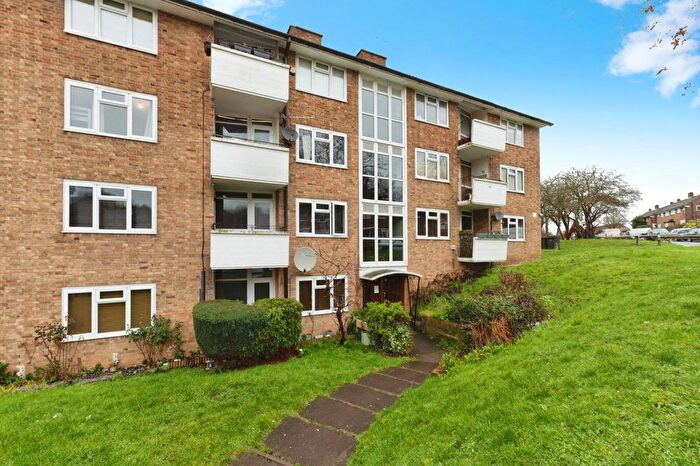
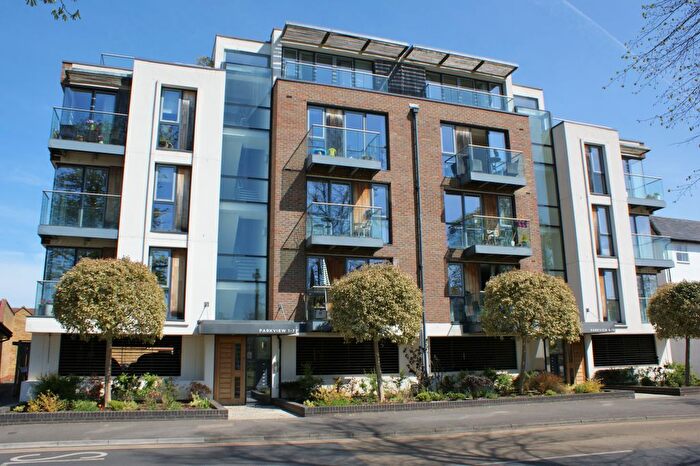
Houses for sale & to rent in Leatherhead, Surrey
House Prices in Leatherhead
Properties in Leatherhead have an average house price of £826,454.00 and had 1,757 Property Transactions within the last 3 years.¹
Leatherhead is an area in Surrey with 18,161 households², where the most expensive property was sold for £8,080,000.00.
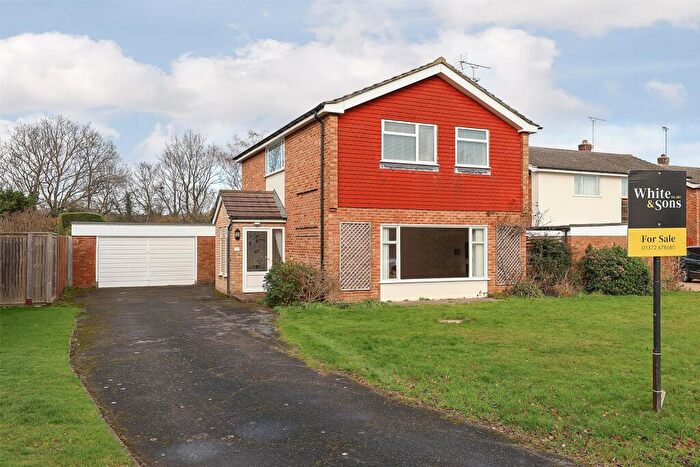
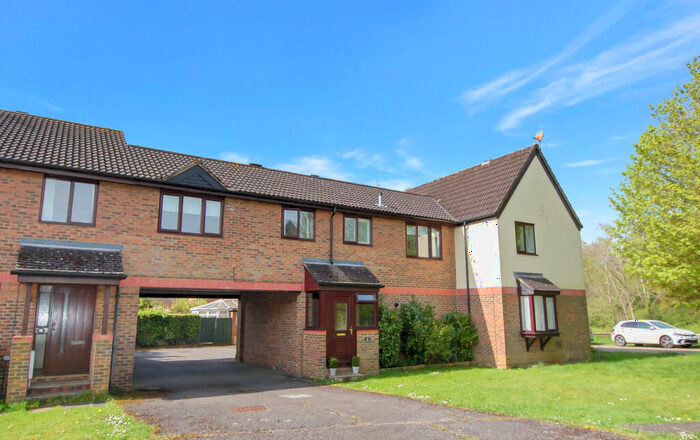
Properties for sale in Leatherhead
Neighbourhoods in Leatherhead
Navigate through our locations to find the location of your next house in Leatherhead, Surrey for sale or to rent.
Transport in Leatherhead
Please see below transportation links in this area:
-
Bookham Station
-
Leatherhead Station
-
Cobham and Stoke D'abernon Station
-
Effingham Junction Station
-
Boxhill and Westhumble Station
- FAQ
- Price Paid By Year
- Property Type Price
Frequently asked questions about Leatherhead
What is the average price for a property for sale in Leatherhead?
The average price for a property for sale in Leatherhead is £826,454. This amount is 36% higher than the average price in Surrey. There are more than 10,000 property listings for sale in Leatherhead.
What locations have the most expensive properties for sale in Leatherhead?
The locations with the most expensive properties for sale in Leatherhead are Oxshott And Stoke Dabernon at an average of £2,014,753, Clandon And Horsley at an average of £1,146,890 and Fetcham East at an average of £863,464.
What locations have the most affordable properties for sale in Leatherhead?
The locations with the most affordable properties for sale in Leatherhead are Leatherhead North at an average of £406,488, Ashtead Village at an average of £506,666 and Leatherhead South at an average of £583,049.
Which train stations are available in or near Leatherhead?
Some of the train stations available in or near Leatherhead are Bookham, Leatherhead and Cobham and Stoke D'abernon.
Property Price Paid in Leatherhead by Year
The average sold property price by year was:
| Year | Average Sold Price | Price Change |
Sold Properties
|
|---|---|---|---|
| 2025 | £772,828 | -1% |
496 Properties |
| 2024 | £779,970 | -20% |
714 Properties |
| 2023 | £935,754 | 8% |
547 Properties |
| 2022 | £859,328 | 7% |
799 Properties |
| 2021 | £800,037 | 1% |
1,072 Properties |
| 2020 | £795,996 | 18% |
741 Properties |
| 2019 | £652,098 | -10% |
747 Properties |
| 2018 | £719,997 | 1% |
768 Properties |
| 2017 | £710,044 | -1% |
754 Properties |
| 2016 | £714,214 | 11% |
756 Properties |
| 2015 | £633,168 | 3% |
781 Properties |
| 2014 | £612,768 | 2% |
787 Properties |
| 2013 | £602,111 | 5% |
820 Properties |
| 2012 | £571,950 | -2% |
688 Properties |
| 2011 | £584,698 | 11% |
695 Properties |
| 2010 | £520,174 | 7% |
639 Properties |
| 2009 | £485,731 | -14% |
636 Properties |
| 2008 | £553,605 | 8% |
490 Properties |
| 2007 | £507,595 | 16% |
1,155 Properties |
| 2006 | £427,149 | -4% |
1,205 Properties |
| 2005 | £445,143 | 10% |
757 Properties |
| 2004 | £399,711 | 10% |
886 Properties |
| 2003 | £358,046 | 2% |
816 Properties |
| 2002 | £350,111 | 8% |
1,038 Properties |
| 2001 | £322,410 | 8% |
1,002 Properties |
| 2000 | £296,172 | 24% |
833 Properties |
| 1999 | £224,085 | 6% |
1,025 Properties |
| 1998 | £210,548 | 11% |
902 Properties |
| 1997 | £186,923 | 14% |
927 Properties |
| 1996 | £161,645 | -1% |
905 Properties |
| 1995 | £163,877 | - |
720 Properties |
Property Price per Property Type in Leatherhead
Here you can find historic sold price data in order to help with your property search.
The average Property Paid Price for specific property types in the last three years are:
| Property Type | Average Sold Price | Sold Properties |
|---|---|---|
| Semi Detached House | £611,420.00 | 357 Semi Detached Houses |
| Terraced House | £467,268.00 | 174 Terraced Houses |
| Detached House | £1,248,114.00 | 824 Detached Houses |
| Flat | £308,585.00 | 402 Flats |

