
Houses for sale & to rent in Molesey South, West Molesey
House Prices in Molesey South
Properties in Molesey South have an average house price of £491k and had 253 Property Transactions within the last 3 years¹.
Molesey South is an area in West Molesey, Surrey with 2,691 households², where the most expensive property was sold for £1.02M.
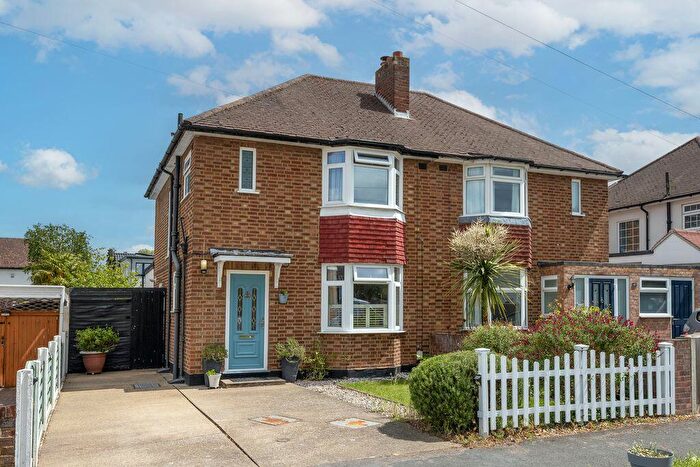
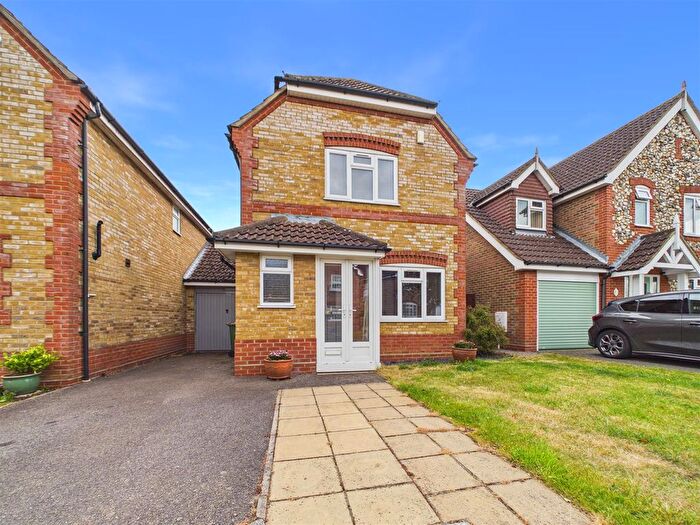
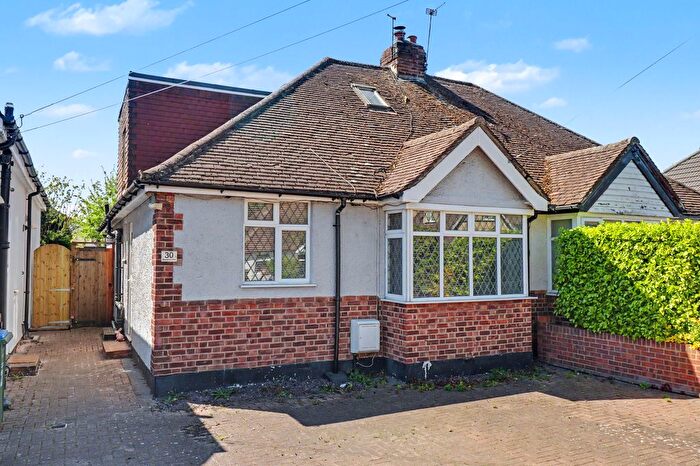
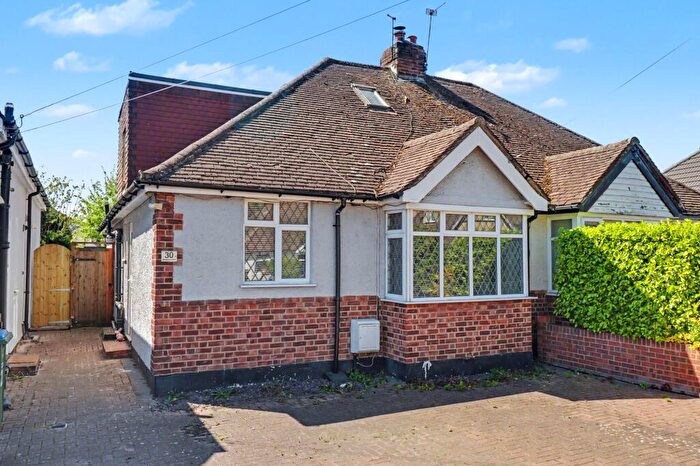
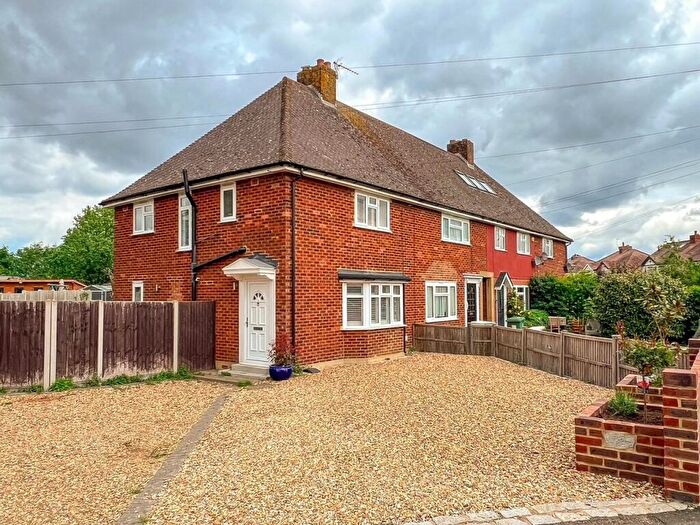
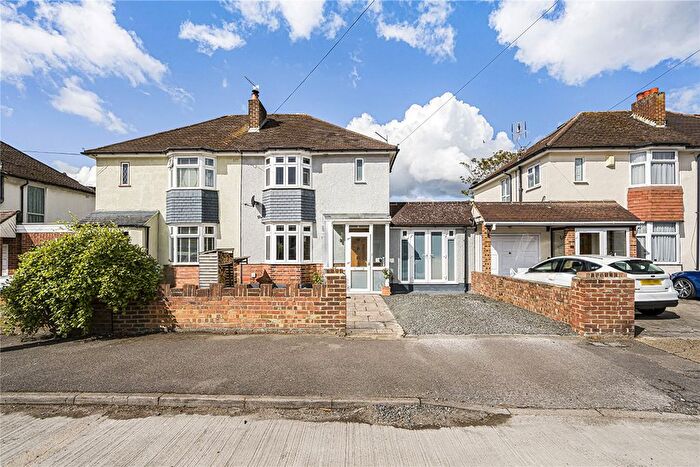
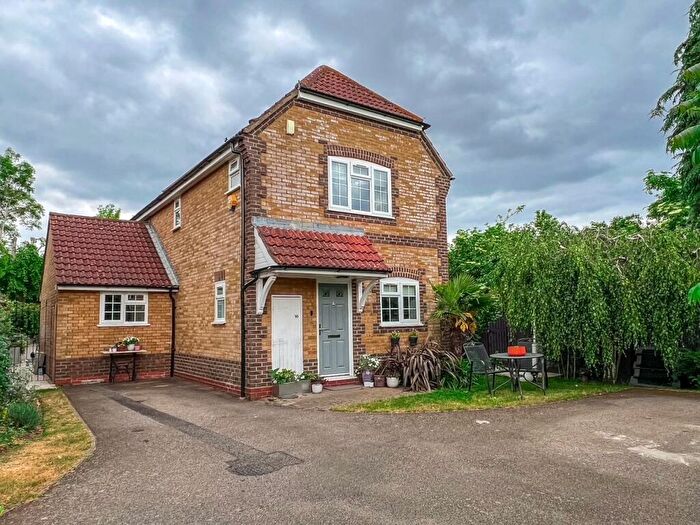
Properties for sale in Molesey South
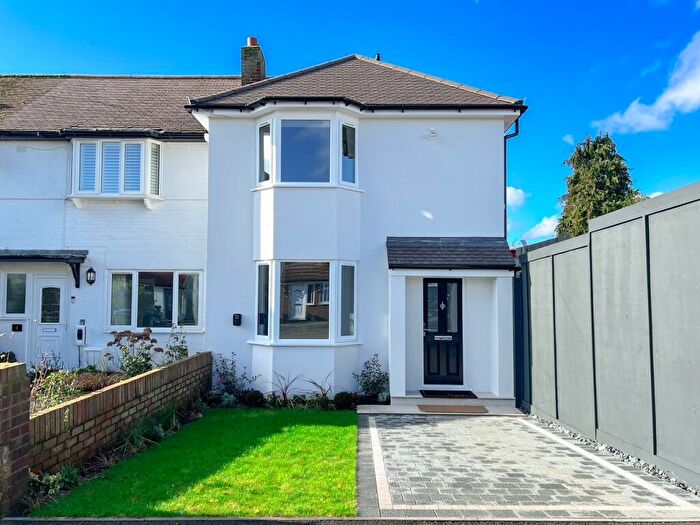


![]()
If you are looking to sell your house, let it out, or receive a property valuation, an expert can help you.
Click the button below to get started.

Roads and Postcodes in Molesey South
Navigate through our locations to find the location of your next house in Molesey South, West Molesey for sale or to rent.
| Streets | Postcodes |
|---|---|
| Anne Way | KT8 2PT |
| Approach Road | KT8 2LL KT8 2LP KT8 2LR KT8 2LW |
| Armfield Close | KT8 2RT |
| Avern Road | KT8 2JB KT8 2JP |
| Beauchamp Road | KT8 2PG KT8 2PH KT8 2PJ |
| Belvedere Gardens | KT8 2TB KT8 2TD |
| Brende Gardens | KT8 2PW |
| Brockenhurst | KT8 2HJ |
| Cannon Way | KT8 2NB |
| Central Avenue | KT8 2QX KT8 2QZ |
| Central Parade | KT8 2QY |
| Chalford Close | KT8 2QL |
| Chandlers Close | KT8 2PA |
| Down Street | KT8 2LS KT8 2LT KT8 2SY KT8 2SZ KT8 2TA KT8 2TE |
| Dunstable Road | KT8 2EN KT8 2EW |
| Dunvegan Close | KT8 2ND |
| Eastcote Avenue | KT8 2EX KT8 2EY KT8 2EZ KT8 2HA KT8 2HB |
| Faraday Place | KT8 2TT KT8 2TX |
| Faraday Road | KT8 2TH KT8 2TQ |
| Field Close | KT8 2LA |
| First Avenue | KT8 2QJ KT8 2QN KT8 2QP KT8 2QW |
| Fleet Close | KT8 2NS |
| Fleetside | KT8 2NF KT8 2NG KT8 2NH KT8 2NJ KT8 2NL KT8 2NQ |
| Glebelands | KT8 2PY |
| Grange Close | KT8 2PX |
| Grange Road | KT8 2PP KT8 2PR |
| Green Lane | KT8 2PL KT8 2PN |
| Grovelands | KT8 2EB KT8 2ED |
| Helen Close | KT8 2PU |
| High Street | KT8 2LX KT8 2LY KT8 2NA KT8 2NE |
| Island Farm Road | KT8 2LH KT8 2LJ KT8 2LN KT8 2LQ |
| Ivydene | KT8 2HG |
| Knights Close | KT8 2HP |
| Langton Road | KT8 2HX |
| Minster Gardens | KT8 2ER |
| Molesey Avenue | KT8 2ES KT8 2ET KT8 2EU |
| Molesey Park Avenue | KT8 2LD |
| Molesey Park Road | KT8 2JZ KT8 2LB KT8 2LE |
| Molesey Road | KT8 2HF |
| Monks Avenue | KT8 2HD |
| Nightingale Road | KT8 2PQ |
| Odard Road | KT8 2TF |
| Palmers Grove | KT8 2EE |
| Pool Close | KT8 2HR |
| Pool Road | KT8 2HE |
| Priory Lane | KT8 2PB KT8 2PS |
| Ray Road | KT8 2LF KT8 2LG |
| Redland Gardens | KT8 2EP |
| Spreighton Road | KT8 2JF |
| Spring Gardens | KT8 2JA |
| St Barnabas Gardens | KT8 2TS |
| The Dene | KT8 2HL |
| Tonbridge Road | KT8 2EL |
| Upper Farm Road | KT8 2QU |
| Walton Road | KT8 2EG KT8 2EH KT8 2EQ KT8 2HQ KT8 2HY KT8 2JD KT8 2JE KT8 2JG KT8 2JQ KT8 2QF |
| Yeend Close | KT8 2NY |
Transport near Molesey South
-
 Hampton Station
 -
Hampton Court Station
-
Esher Station
-
Thames Ditton Station
-
Hersham Station
-
Hinchley Wood Station
-
Kempton Park Station
-
Sunbury Station
-
Teddington Station
-
Walton-On-Thames Station
- FAQ
- Price Paid By Year
- Property Type Price
Frequently asked questions about Molesey South
What is the average price for a property for sale in Molesey South?
The average price for a property for sale in Molesey South is £490,937. This amount is 4% lower than the average price in West Molesey. There are 1,540 property listings for sale in Molesey South.
What streets have the most expensive properties for sale in Molesey South?
The streets with the most expensive properties for sale in Molesey South are Field Close at an average of £903,500, Nightingale Road at an average of £785,758 and Langton Road at an average of £712,000.
What streets have the most affordable properties for sale in Molesey South?
The streets with the most affordable properties for sale in Molesey South are Pool Close at an average of £245,890, Yeend Close at an average of £250,000 and Spreighton Road at an average of £270,000.
Which train stations are available in or near Molesey South?
Some of the train stations available in or near Molesey South are Hampton, Hampton Court and Esher.
Property Price Paid in Molesey South by Year
The average sold property price by year was:
| Year | Average Sold Price | Price Change |
Sold Properties
|
|---|---|---|---|
| 2026 | £430,000 | -15% |
1 Property |
| 2025 | £495,814 | -3% |
107 Properties |
| 2024 | £509,616 | 10% |
83 Properties |
| 2023 | £458,499 | -9% |
62 Properties |
| 2022 | £497,606 | 12% |
105 Properties |
| 2021 | £438,867 | -1% |
147 Properties |
| 2020 | £443,167 | 10% |
78 Properties |
| 2019 | £398,886 | -5% |
102 Properties |
| 2018 | £419,610 | 0,5% |
89 Properties |
| 2017 | £417,605 | 11% |
93 Properties |
| 2016 | £371,923 | 2% |
104 Properties |
| 2015 | £364,419 | 8% |
136 Properties |
| 2014 | £335,270 | 12% |
125 Properties |
| 2013 | £293,475 | -1% |
125 Properties |
| 2012 | £295,143 | 11% |
106 Properties |
| 2011 | £264,004 | -3% |
99 Properties |
| 2010 | £272,396 | 7% |
89 Properties |
| 2009 | £252,174 | -3% |
77 Properties |
| 2008 | £260,190 | 4% |
107 Properties |
| 2007 | £249,135 | 5% |
171 Properties |
| 2006 | £235,471 | 5% |
194 Properties |
| 2005 | £222,867 | 1% |
137 Properties |
| 2004 | £220,996 | 10% |
161 Properties |
| 2003 | £199,100 | 16% |
150 Properties |
| 2002 | £167,193 | 10% |
196 Properties |
| 2001 | £151,258 | 10% |
177 Properties |
| 2000 | £135,952 | 19% |
151 Properties |
| 1999 | £109,929 | 9% |
172 Properties |
| 1998 | £100,456 | 4% |
133 Properties |
| 1997 | £96,082 | 20% |
137 Properties |
| 1996 | £76,887 | -1% |
147 Properties |
| 1995 | £77,661 | - |
122 Properties |
Property Price per Property Type in Molesey South
Here you can find historic sold price data in order to help with your property search.
The average Property Paid Price for specific property types in the last three years are:
| Property Type | Average Sold Price | Sold Properties |
|---|---|---|
| Semi Detached House | £579,003.00 | 100 Semi Detached Houses |
| Detached House | £700,925.00 | 20 Detached Houses |
| Terraced House | £435,245.00 | 100 Terraced Houses |
| Flat | £265,571.00 | 33 Flats |