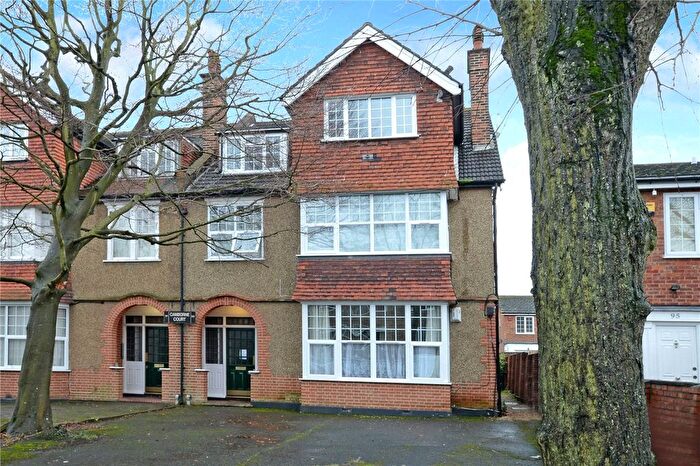
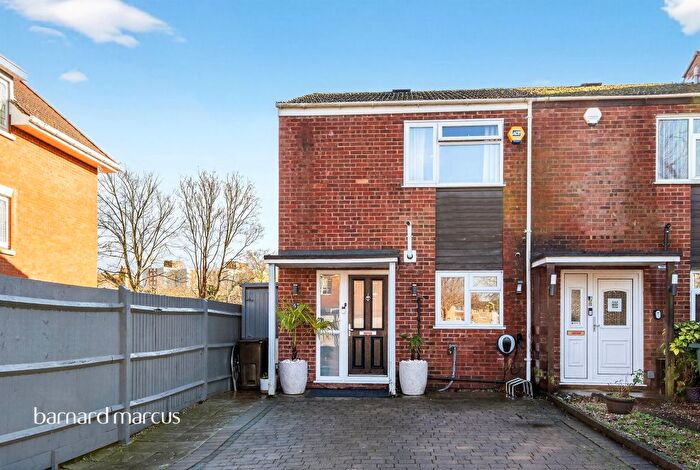
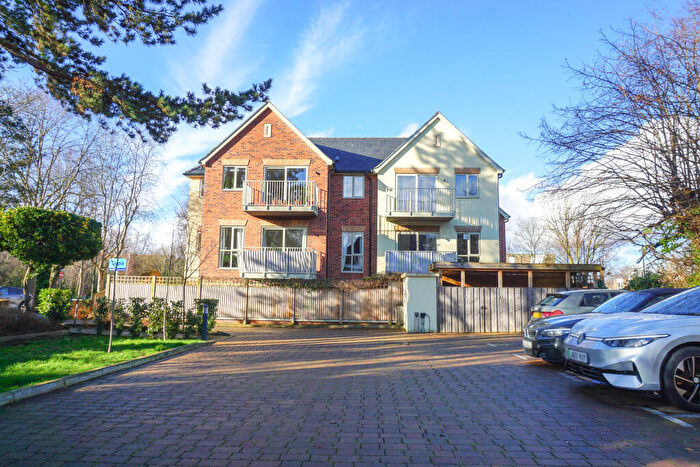
Houses for sale & to rent in Belmont, Sutton
House Prices in Belmont
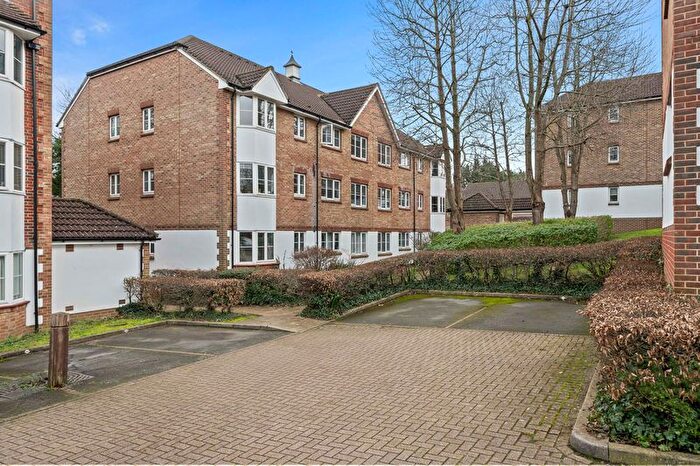
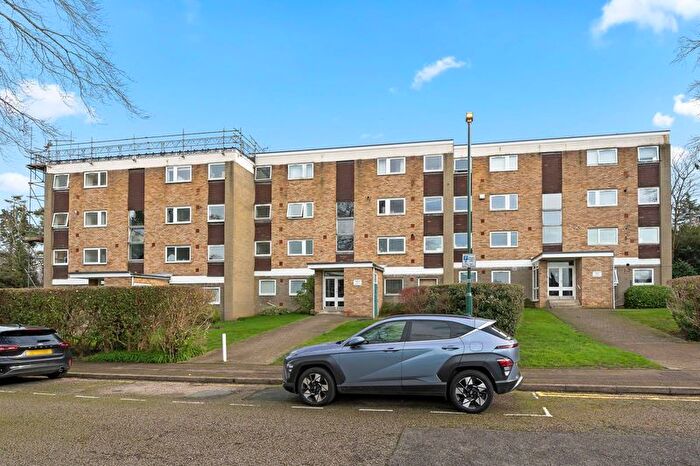
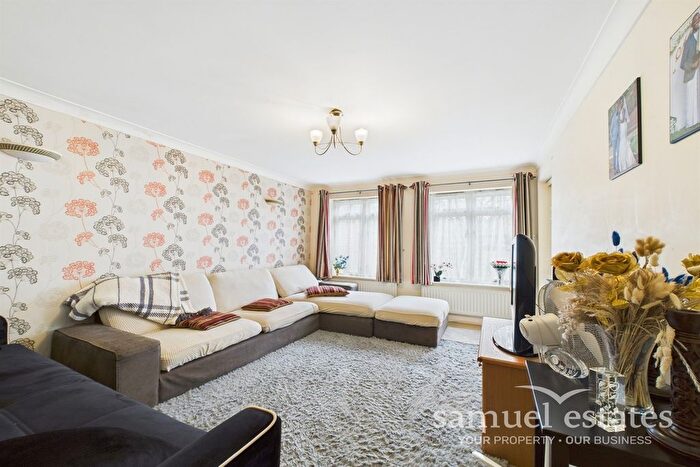
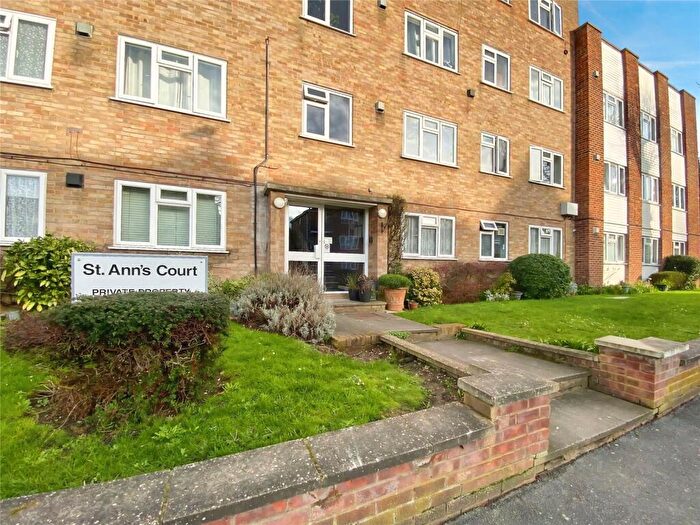
Properties in this part of Belmont within Sutton have an average house price of £567,009.00 and had 398 Property Transactions within the last 3 years¹. This area has 4,204 households² , where the most expensive property was sold for £1,930,000.00.
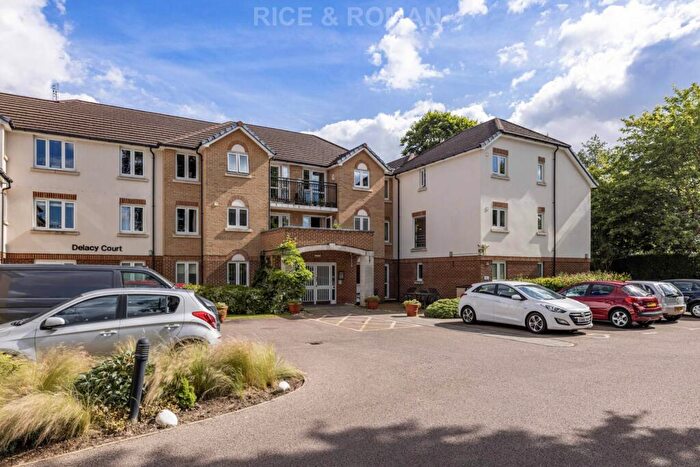
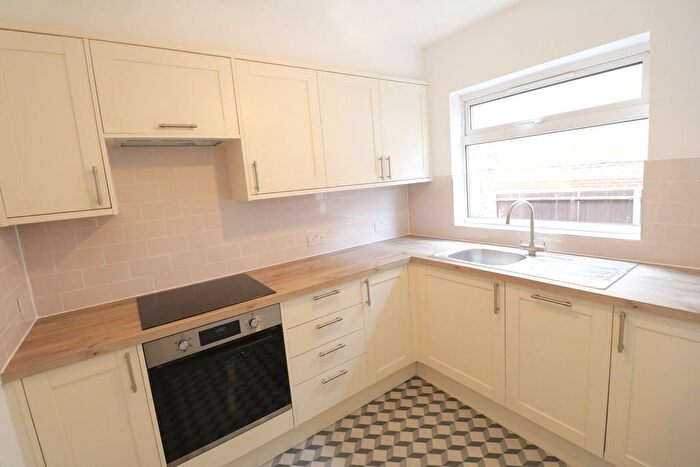
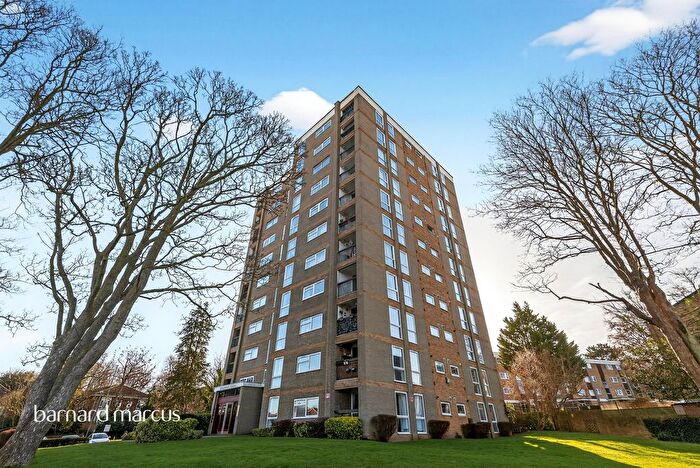
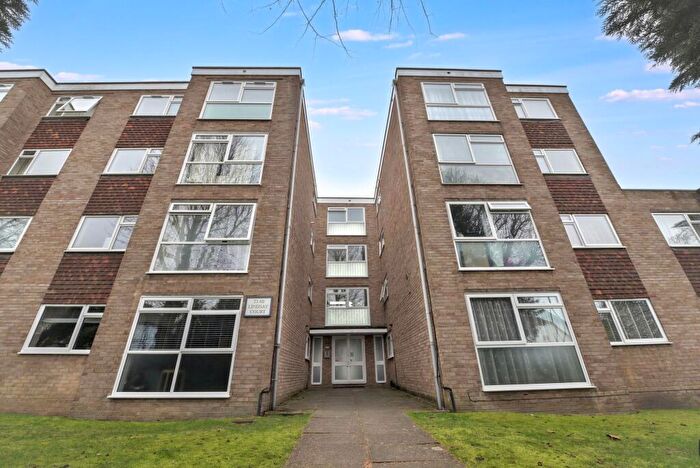
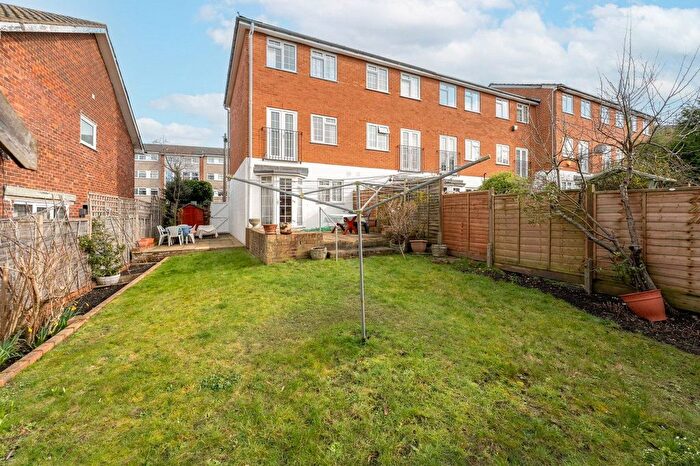
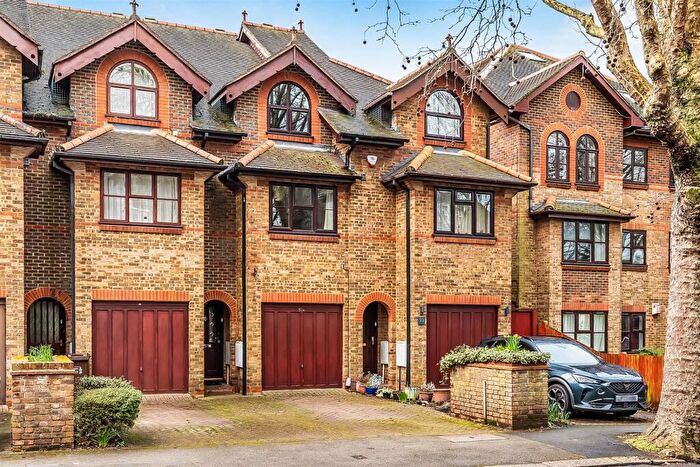
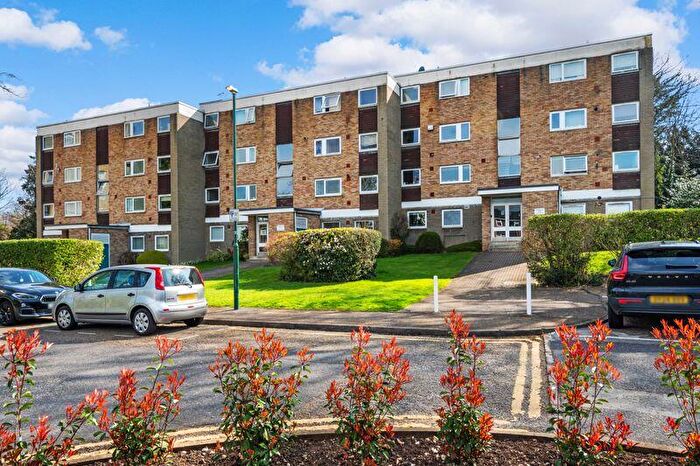
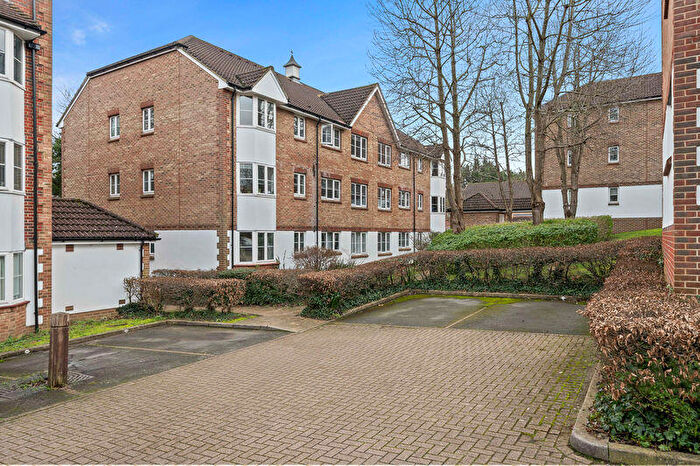
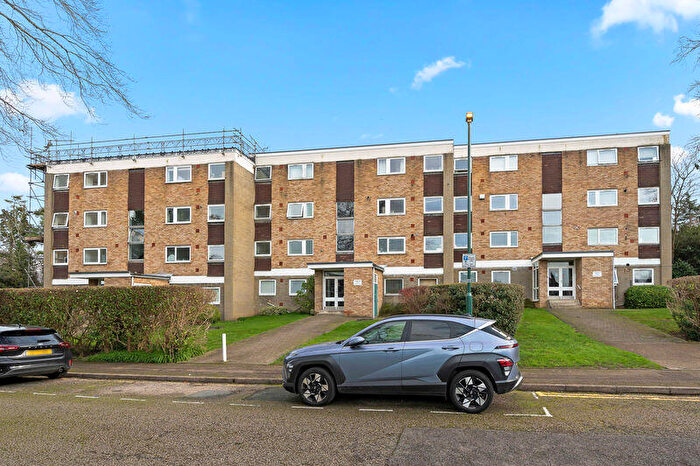
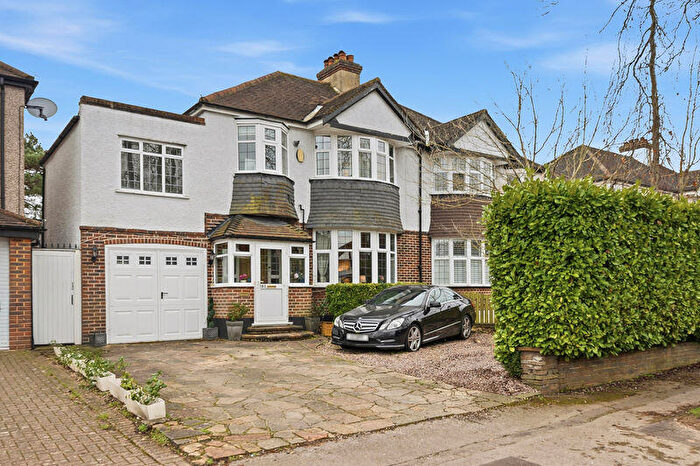
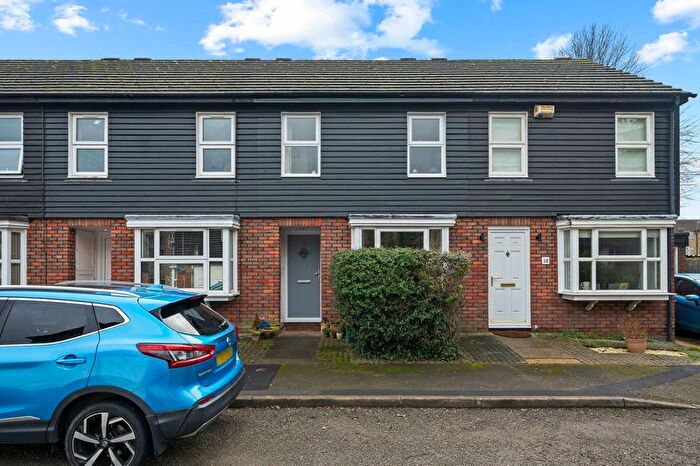
Properties for sale in Belmont
Roads and Postcodes in Belmont
Navigate through our locations to find the location of your next house in Belmont, Sutton for sale or to rent.
| Streets | Postcodes |
|---|---|
| Arundel Road | SM2 6EU |
| Autumn Drive | SM2 5BA SM2 5BB SM2 5BD SM2 5FA |
| Avenue Road | SM2 6JB SM2 6JD SM2 6JE |
| Balmoral Way | SM2 6PD |
| Banstead Road South | SM2 5LF SM2 5LG SM2 5LH SM2 5LJ SM2 5LL SM2 5LW |
| Baron Close | SM2 5NJ |
| Basildon Close | SM2 5QJ |
| Basinghall Gardens | SM2 6AP SM2 6AR SM2 6AS SM2 6AT SM2 6AU SM2 6AW |
| Bassett Close | SM2 5QR |
| Bawtree Close | SM2 5LQ |
| Belmont Rise | SM2 6EJ SM2 6EL SM2 6EA |
| Belmont Road | SM2 6DW |
| Beresford Road | SM2 6EP SM2 6ER SM2 6ES SM2 6EW |
| Bicknoller Close | SM2 5NQ |
| Bowling Way | SM2 6FF |
| Brachlin Mews | SM2 6FB |
| Bradley Close | SM2 6BU |
| Brandy Way | SM2 6SE |
| Brasted Close | SM2 5BE SM2 6EB |
| Brighton Road | SM2 5RH SM2 5RJ SM2 5RQ SM2 5SF SM2 5SJ SM2 5SL SM2 5SN SM2 5ST SM2 5SU SM2 5FU SM2 5SW |
| California Close | SM2 6DQ |
| Chalcot Close | SM2 6SL |
| Chale Walk | SM2 6TS |
| Chelmsford Close | SM2 5BG |
| Cheviot Close | SM2 5SB |
| Chiddingstone Close | SM2 6NS |
| Chiltern Road | SM2 5QP SM2 5QU SM2 5QY SM2 5QZ SM2 5RD |
| Chipstead Close | SM2 6BE SM2 6BF |
| Clifton Avenue | SM2 5PS |
| Commonside Close | SM2 5SX |
| Cornwall Road | SM2 6DR SM2 6DS SM2 6DT SM2 6DU |
| Cotswold Road | SM2 5NG SM2 5NL SM2 5NW SM2 5NF |
| Courtenay Avenue | SM2 5ND |
| Cross Road | SM2 6DJ |
| Crossways | SM2 5LB SM2 5LD |
| Cudham Close | SM2 6EG |
| Devonshire Road | SM2 5HH |
| Dorset Road | SM2 6HX SM2 6JA SM2 6JJ SM2 6NG SM2 6JH |
| Downs Road | SM2 5NR SM2 5PR SM2 5QD SM2 5PT |
| Dunsbury Close | SM2 6TP |
| Egmont Road | SM2 5JN SM2 5JR SM2 5JS SM2 5JW |
| Felbridge Close | SM2 5QH |
| Filey Close | SM2 5JZ |
| Fowey Place | SM2 6FA |
| Frampton Close | SM2 6SU |
| Furzedown Road | SM2 5QE SM2 5QF |
| Gatton Close | SM2 5QL |
| Grange Road | SM2 6SN SM2 6SP SM2 6SR SM2 6SW |
| Hadleigh Drive | SM2 5BF |
| Hardegray Close | SM2 5FQ |
| Hatfield Close | SM2 5BH |
| Heath Drive | SM2 5RP |
| Hillside Road | SM2 6ET |
| Holland Avenue | SM2 6HT SM2 6HU SM2 6HW |
| Homeland Drive | SM2 5AT SM2 5AU SM2 5BJ SM2 5LT SM2 5LY |
| Hulverston Close | SM2 6TY SM2 6TZ SM2 6UA |
| Kings Road | SM2 6DG |
| Kingswood Drive | SM2 5NB SM2 5NT |
| Knockholt Close | SM2 6ED |
| Langley Park Road | SM2 5HG |
| Lymbourne Close | SM2 6DX |
| Maple Walk | SM2 5NA |
| Moore Way | SM2 5BZ |
| Mottistone Grove | SM2 6FE |
| Nettlecombe Close | SM2 6TR |
| Northdown Road | SM2 6DY |
| Overton Park | SM2 6QT |
| Overton Road | SM2 6DN SM2 6QS SM2 6RB SM2 6SS |
| Patricia Gardens | SM2 6DH |
| Pelton Avenue | SM2 5NN |
| Penshurst Way | SM2 6HR |
| Porchfield Close | SM2 6TU |
| Queens Road | SM2 6BQ SM2 6BZ |
| Radnor Terrace | SM2 6HY |
| Riverhead Drive | SM2 6EF |
| Rookley Close | SM2 6TT |
| Rosewood | SM2 5DF |
| Sackville Road | SM2 6HS |
| Sevenoaks Close | SM2 6NL |
| Sinclair Drive | SM2 5NE |
| Station Approach | SM2 6BW SM2 6DD |
| Station Road | SM2 6BG SM2 6BH SM2 6BS SM2 6BX SM2 6DF |
| Tegan Close | SM2 6GS |
| The Byway | SM2 5LE |
| The Causeway | SM2 5RS |
| The Chilterns | SM2 5QN |
| The Crescent | SM2 6BJ SM2 6BL SM2 6BN SM2 6BP |
| The Downsway | SM2 5RL SM2 5RN SM2 5RE |
| The Gallop | SM2 5RU SM2 5RY SM2 5SA |
| The Highway | SM2 5QS SM2 5QT |
| The Linkway | SM2 5SE |
| Westerham Close | SM2 6NQ |
| Westmoreland Drive | SM2 6AE |
| Westover Close | SM2 6UB |
| Woodbury Drive | SM2 5RA SM2 5RB |
| Wyndham Close | SM2 6JF |
| Yarbridge Close | SM2 6TX |
| York Road | SM2 6HF SM2 6HG SM2 6HH SM2 6HJ SM2 6HL SM2 6HN SM2 6HQ SM2 6QD |
Transport near Belmont
-
Belmont Station
-
Sutton Station
-
Cheam Station
-
West Sutton Station
-
Carshalton Beeches Station
-
Banstead Station
-
Sutton Common Station
-
Carshalton Station
-
Ewell East Station
-
Wallington Station
- FAQ
- Price Paid By Year
- Property Type Price
Frequently asked questions about Belmont
What is the average price for a property for sale in Belmont?
The average price for a property for sale in Belmont is £567,009. This amount is 16% higher than the average price in Sutton. There are 2,327 property listings for sale in Belmont.
What streets have the most expensive properties for sale in Belmont?
The streets with the most expensive properties for sale in Belmont are The Highway at an average of £1,535,833, Fowey Place at an average of £1,250,000 and Cornwall Road at an average of £1,245,366.
What streets have the most affordable properties for sale in Belmont?
The streets with the most affordable properties for sale in Belmont are Patricia Gardens at an average of £159,000, Queens Road at an average of £182,142 and Chipstead Close at an average of £231,800.
Which train stations are available in or near Belmont?
Some of the train stations available in or near Belmont are Belmont, Sutton and Cheam.
Property Price Paid in Belmont by Year
The average sold property price by year was:
| Year | Average Sold Price | Price Change |
Sold Properties
|
|---|---|---|---|
| 2025 | £539,420 | -11% |
110 Properties |
| 2024 | £600,193 | 8% |
159 Properties |
| 2023 | £549,633 | 1% |
129 Properties |
| 2022 | £542,468 | 5% |
171 Properties |
| 2021 | £517,606 | -1% |
223 Properties |
| 2020 | £524,562 | 13% |
126 Properties |
| 2019 | £455,938 | 6% |
154 Properties |
| 2018 | £429,546 | -5% |
144 Properties |
| 2017 | £449,455 | -1% |
161 Properties |
| 2016 | £452,481 | 9% |
194 Properties |
| 2015 | £411,544 | 9% |
205 Properties |
| 2014 | £374,935 | 14% |
207 Properties |
| 2013 | £321,201 | 9% |
186 Properties |
| 2012 | £293,297 | -14% |
147 Properties |
| 2011 | £333,735 | 7% |
155 Properties |
| 2010 | £310,921 | 8% |
145 Properties |
| 2009 | £286,420 | -10% |
142 Properties |
| 2008 | £314,236 | 9% |
138 Properties |
| 2007 | £284,880 | 6% |
299 Properties |
| 2006 | £268,904 | 9% |
286 Properties |
| 2005 | £244,467 | 4% |
244 Properties |
| 2004 | £234,435 | 8% |
274 Properties |
| 2003 | £215,649 | 8% |
260 Properties |
| 2002 | £199,306 | 15% |
323 Properties |
| 2001 | £168,516 | 9% |
320 Properties |
| 2000 | £152,553 | 15% |
316 Properties |
| 1999 | £129,024 | 12% |
337 Properties |
| 1998 | £113,358 | 9% |
322 Properties |
| 1997 | £102,929 | 4% |
343 Properties |
| 1996 | £98,509 | -1% |
303 Properties |
| 1995 | £99,071 | - |
343 Properties |
Property Price per Property Type in Belmont
Here you can find historic sold price data in order to help with your property search.
The average Property Paid Price for specific property types in the last three years are:
| Property Type | Average Sold Price | Sold Properties |
|---|---|---|
| Flat | £278,080.00 | 171 Flats |
| Semi Detached House | £738,181.00 | 66 Semi Detached Houses |
| Detached House | £1,051,667.00 | 85 Detached Houses |
| Terraced House | £526,397.00 | 76 Terraced Houses |

