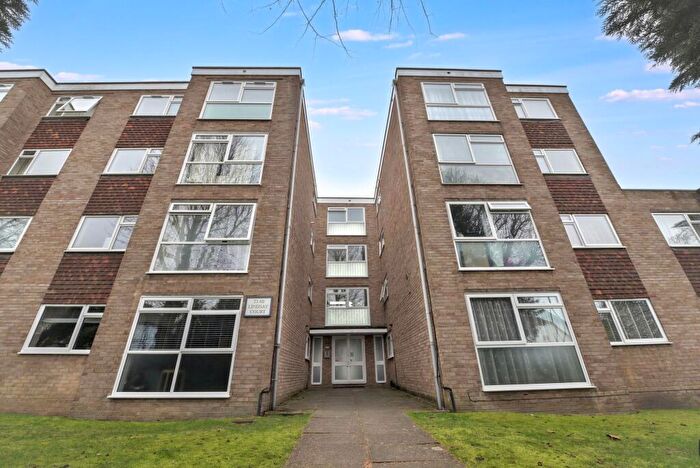
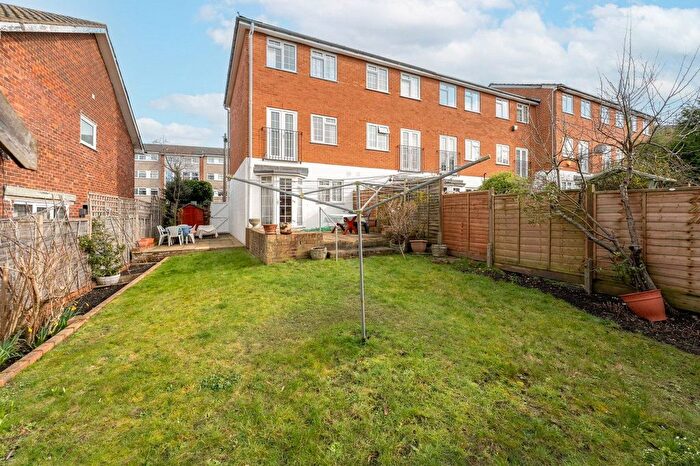
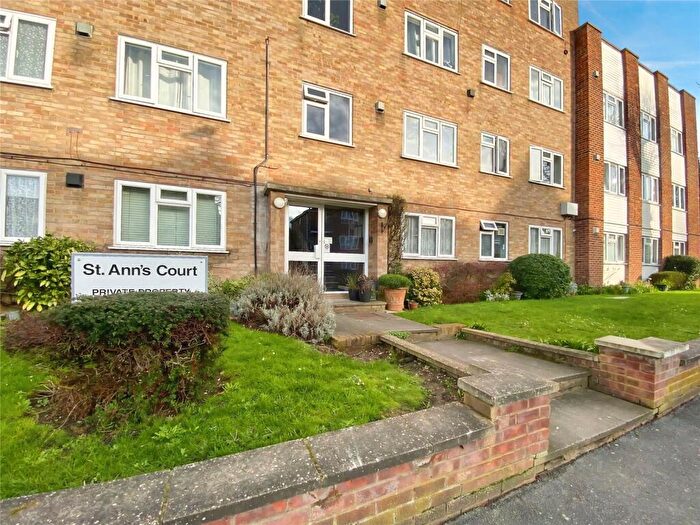
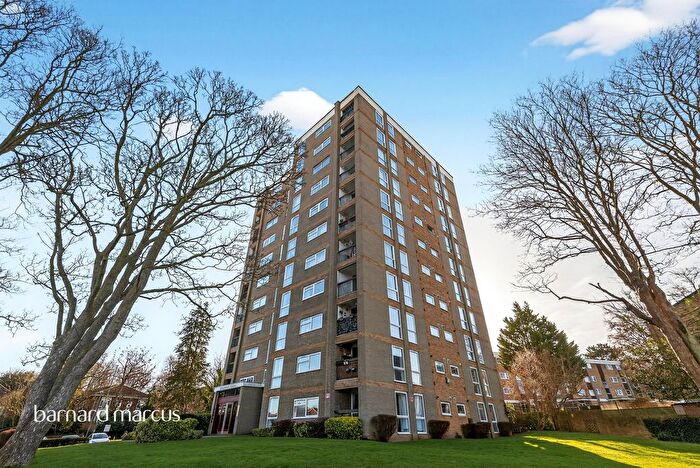
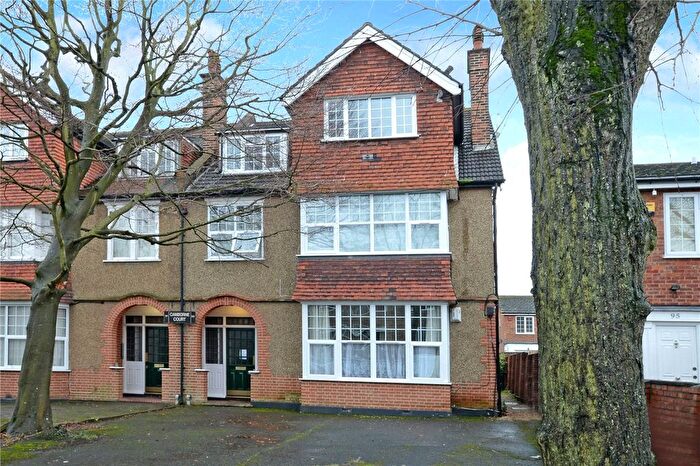
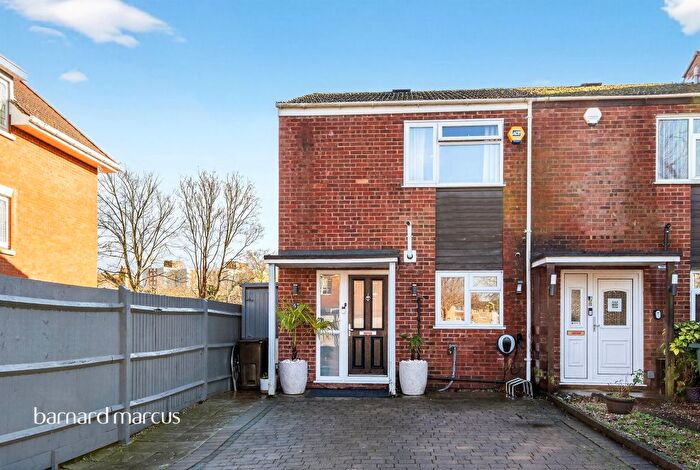
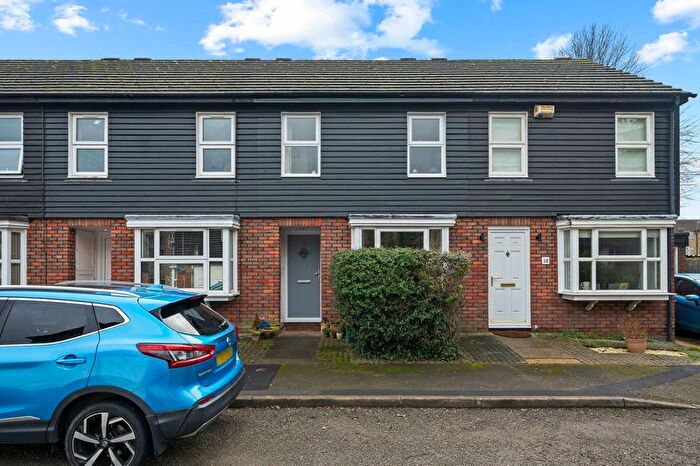
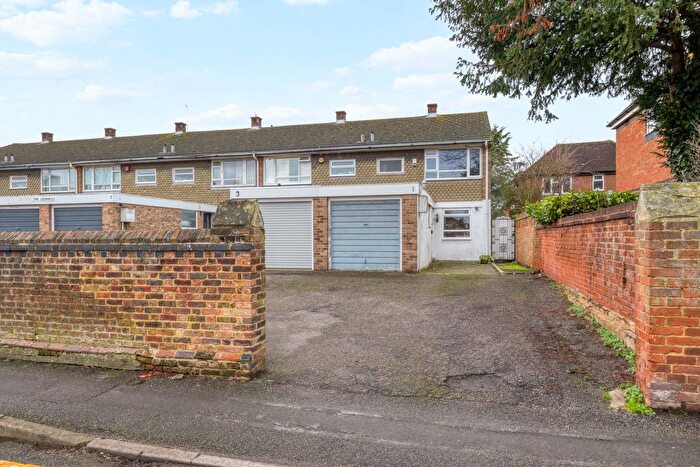
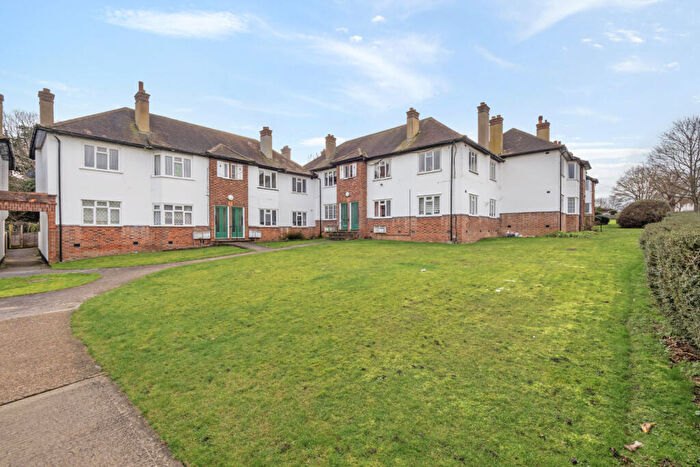
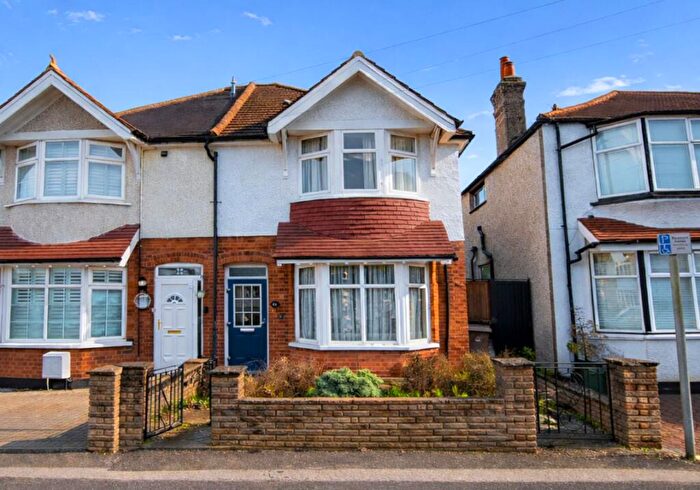
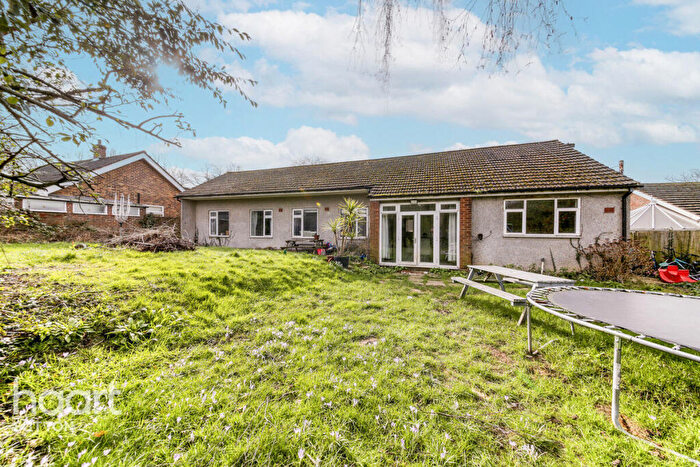
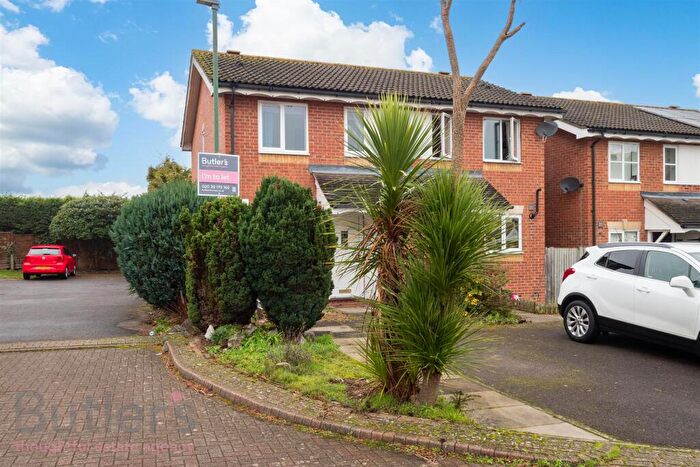
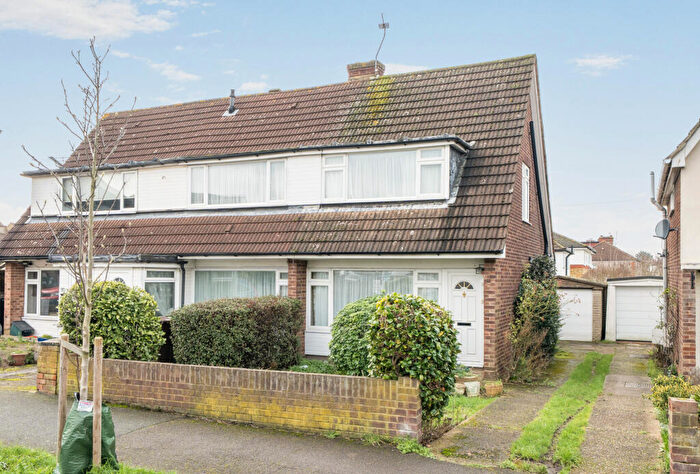
Houses for sale & to rent in Sutton West, Sutton
House Prices in Sutton West
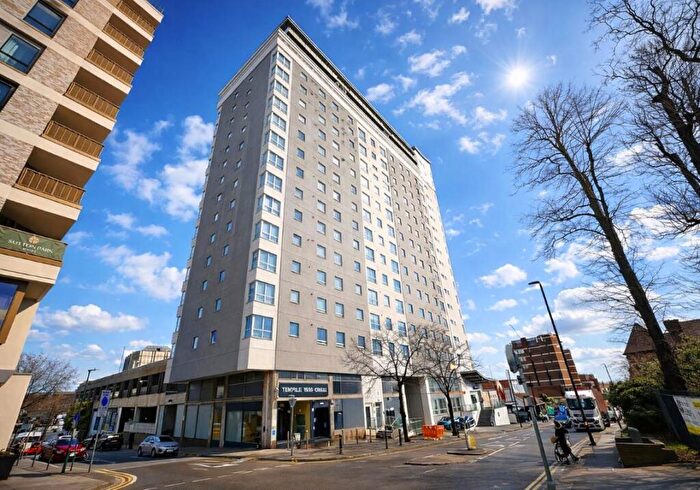
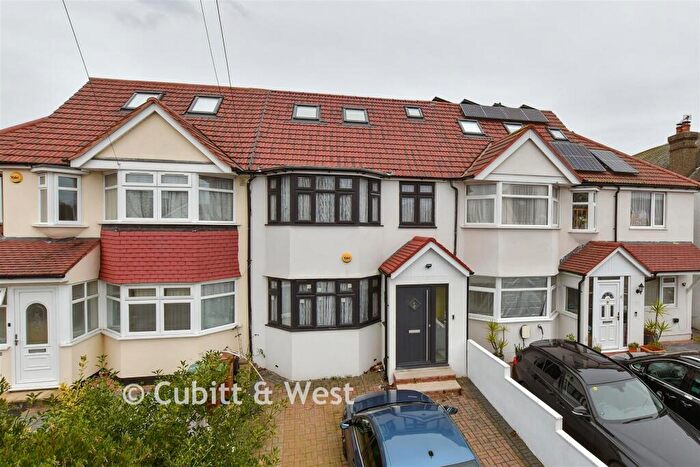
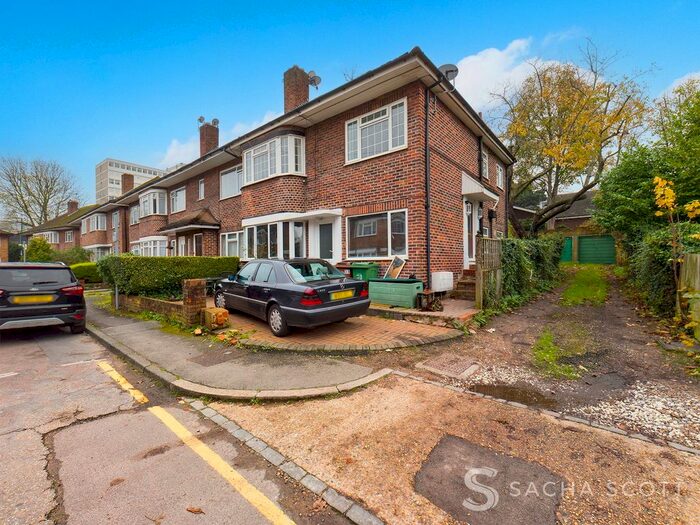
Properties in this part of Sutton West within Sutton have an average house price of £453,010.00 and had 494 Property Transactions within the last 3 years¹. This area has 4,684 households² , where the most expensive property was sold for £1,499,000.00.
Properties for sale in Sutton West
Roads and Postcodes in Sutton West
Navigate through our locations to find the location of your next house in Sutton West, Sutton for sale or to rent.
Transport near Sutton West
-
West Sutton Station
-
Sutton Station
-
Cheam Station
-
Sutton Common Station
-
Belmont Station
-
Carshalton Beeches Station
-
Carshalton Station
-
Stoneleigh Station
-
St Helier Station
-
Ewell East Station
- FAQ
- Price Paid By Year
- Property Type Price
Frequently asked questions about Sutton West
What is the average price for a property for sale in Sutton West?
The average price for a property for sale in Sutton West is £453,010. This amount is 7% lower than the average price in Sutton. There are 3,296 property listings for sale in Sutton West.
What streets have the most expensive properties for sale in Sutton West?
The streets with the most expensive properties for sale in Sutton West are Cecil Road at an average of £1,141,666, Derby Road at an average of £1,072,000 and Fairholme Road at an average of £856,500.
What streets have the most affordable properties for sale in Sutton West?
The streets with the most affordable properties for sale in Sutton West are Sherwood Park Road at an average of £238,520, Camden Road at an average of £245,250 and Ennerdale Close at an average of £285,000.
Which train stations are available in or near Sutton West?
Some of the train stations available in or near Sutton West are West Sutton, Sutton and Cheam.
Property Price Paid in Sutton West by Year
The average sold property price by year was:
| Year | Average Sold Price | Price Change |
Sold Properties
|
|---|---|---|---|
| 2025 | £447,415 | -3% |
133 Properties |
| 2024 | £462,907 | 4% |
196 Properties |
| 2023 | £445,763 | -0,4% |
165 Properties |
| 2022 | £447,737 | 6% |
202 Properties |
| 2021 | £422,947 | -2% |
261 Properties |
| 2020 | £433,439 | 14% |
160 Properties |
| 2019 | £374,619 | -1% |
185 Properties |
| 2018 | £379,421 | -0,3% |
175 Properties |
| 2017 | £380,665 | 3% |
184 Properties |
| 2016 | £369,269 | 6% |
209 Properties |
| 2015 | £346,832 | 15% |
247 Properties |
| 2014 | £296,381 | 10% |
229 Properties |
| 2013 | £268,151 | -0,3% |
225 Properties |
| 2012 | £269,053 | 8% |
173 Properties |
| 2011 | £246,311 | -1% |
152 Properties |
| 2010 | £249,481 | 3% |
167 Properties |
| 2009 | £242,287 | -3% |
187 Properties |
| 2008 | £248,982 | 1% |
185 Properties |
| 2007 | £245,529 | 5% |
332 Properties |
| 2006 | £232,343 | 12% |
344 Properties |
| 2005 | £205,597 | 3% |
252 Properties |
| 2004 | £200,284 | 7% |
327 Properties |
| 2003 | £186,832 | 7% |
276 Properties |
| 2002 | £173,174 | 19% |
371 Properties |
| 2001 | £139,688 | 8% |
345 Properties |
| 2000 | £128,990 | 18% |
403 Properties |
| 1999 | £106,352 | 11% |
435 Properties |
| 1998 | £94,795 | 21% |
364 Properties |
| 1997 | £75,114 | 6% |
349 Properties |
| 1996 | £70,941 | 1% |
290 Properties |
| 1995 | £70,233 | - |
231 Properties |
Property Price per Property Type in Sutton West
Here you can find historic sold price data in order to help with your property search.
The average Property Paid Price for specific property types in the last three years are:
| Property Type | Average Sold Price | Sold Properties |
|---|---|---|
| Flat | £304,669.00 | 260 Flats |
| Semi Detached House | £686,573.00 | 111 Semi Detached Houses |
| Detached House | £774,360.00 | 25 Detached Houses |
| Terraced House | £500,046.00 | 98 Terraced Houses |

