
Houses for sale in Sutton South, Sutton
House Prices in Sutton South
Properties in this part of Sutton South within Sutton have an average house price of £399k and had 486 Property Transactions within the last 3 years¹. This area has 5,021 households² , where the most expensive property was sold for £1.7M.
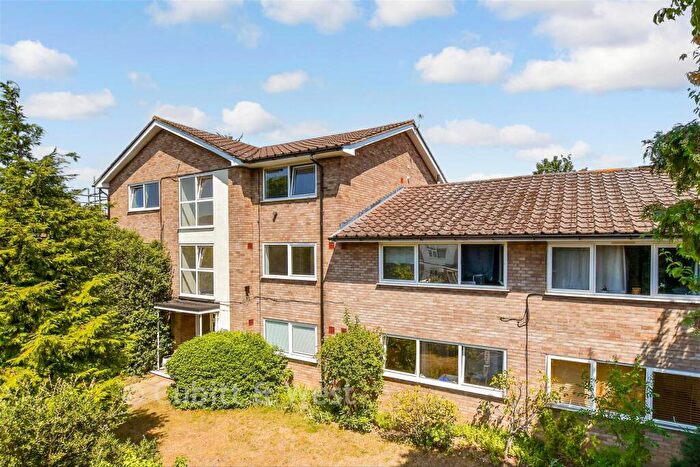
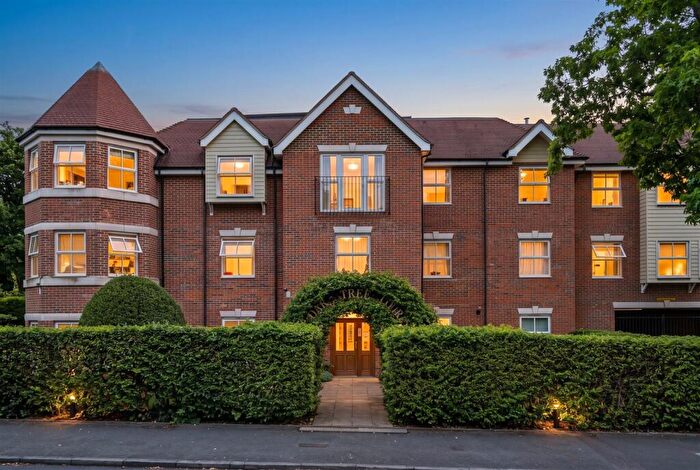
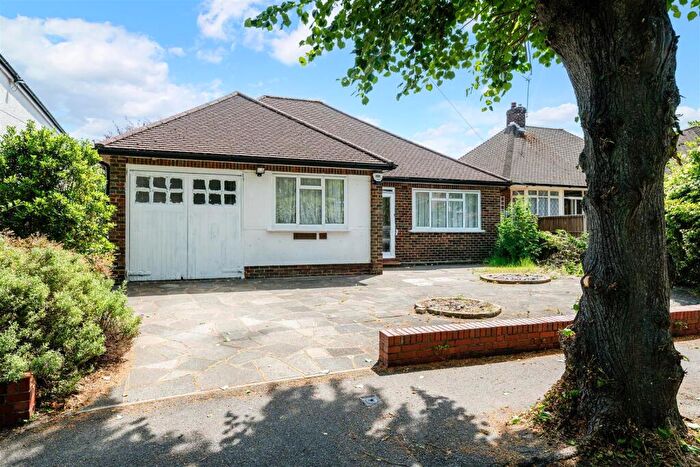
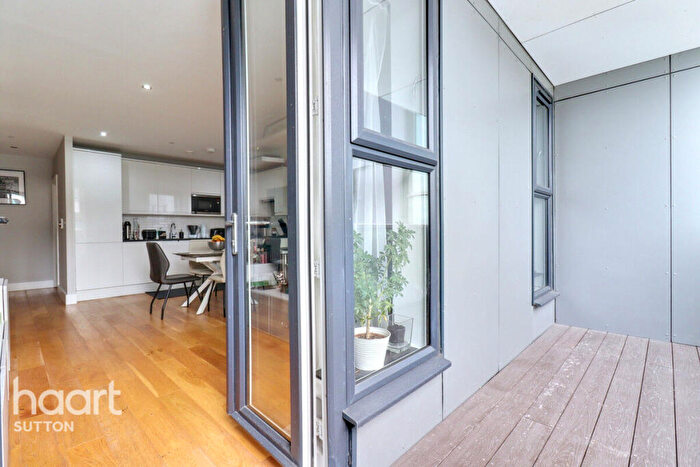
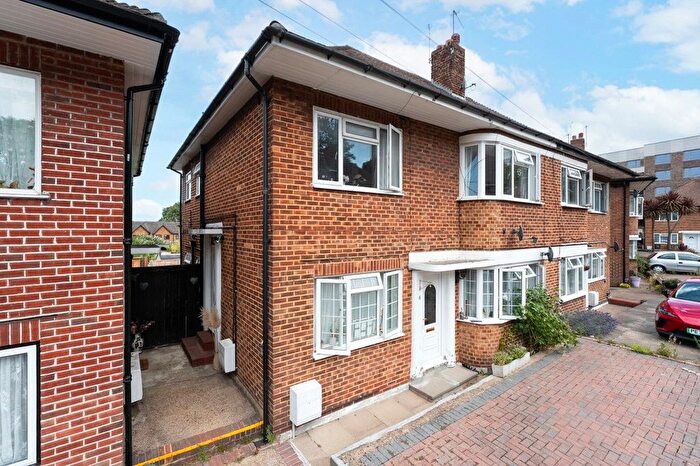
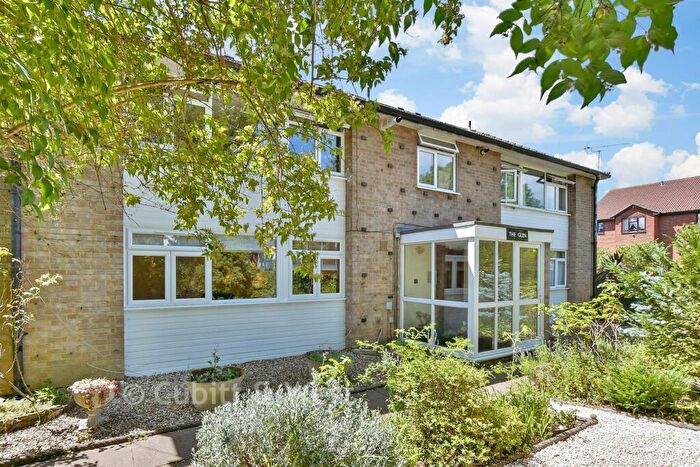
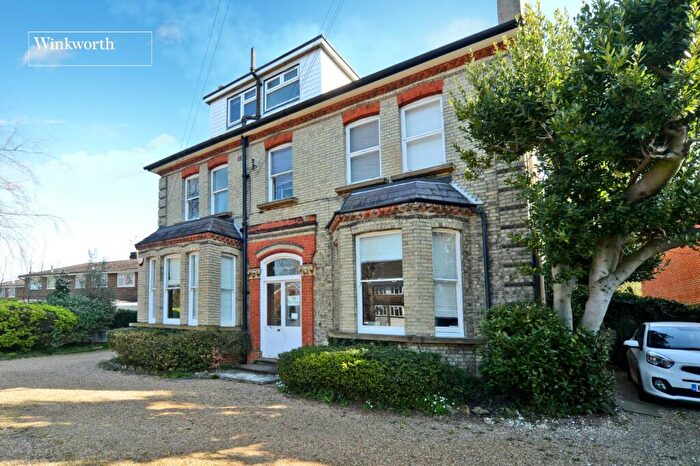
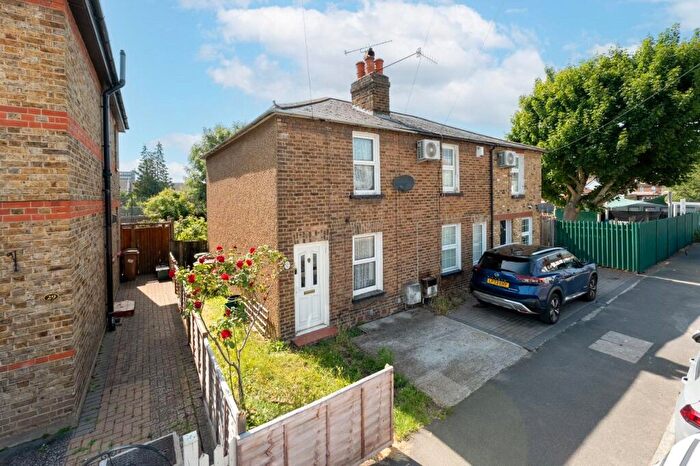
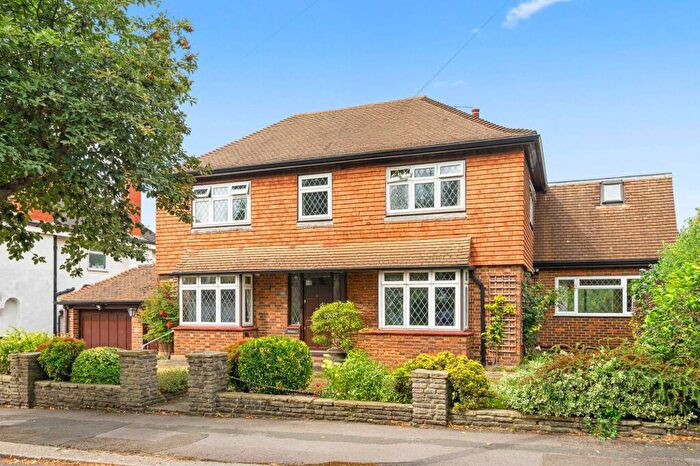
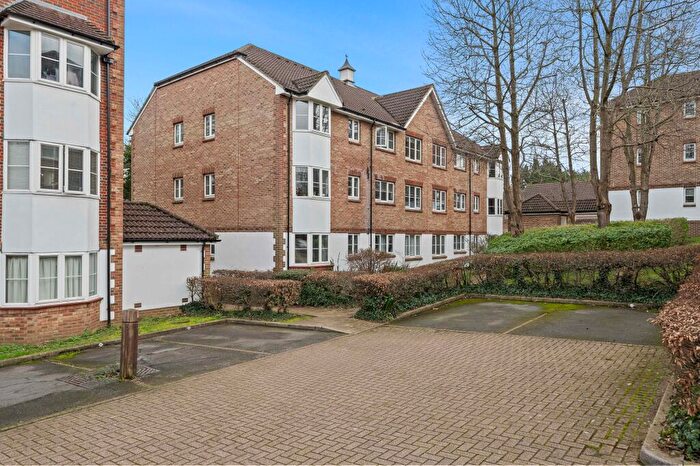
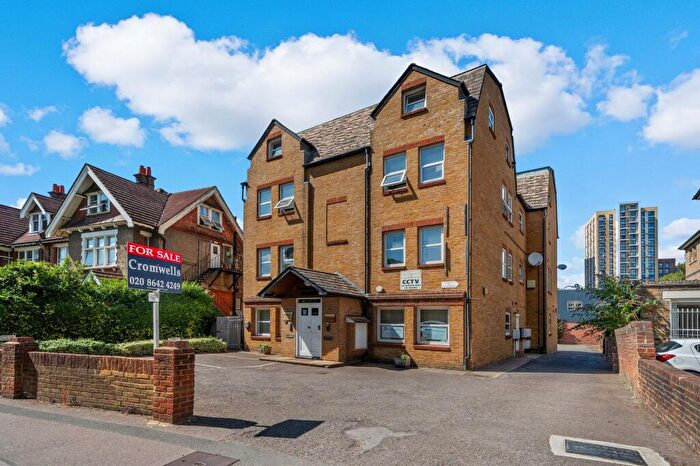
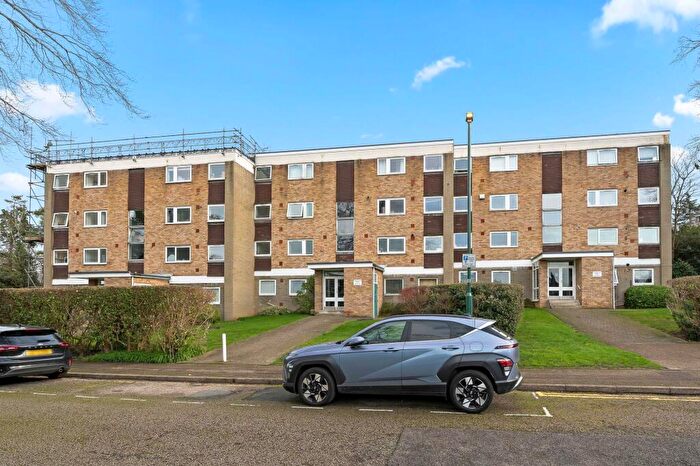
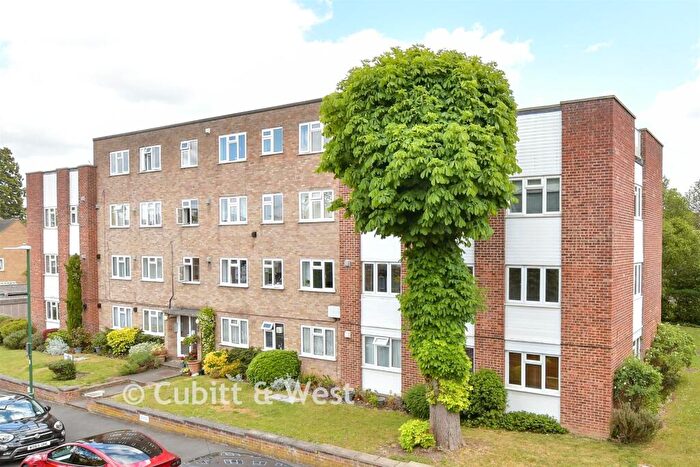
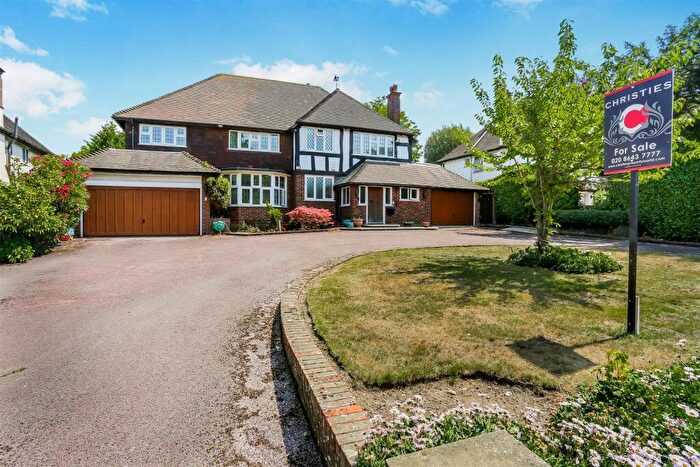
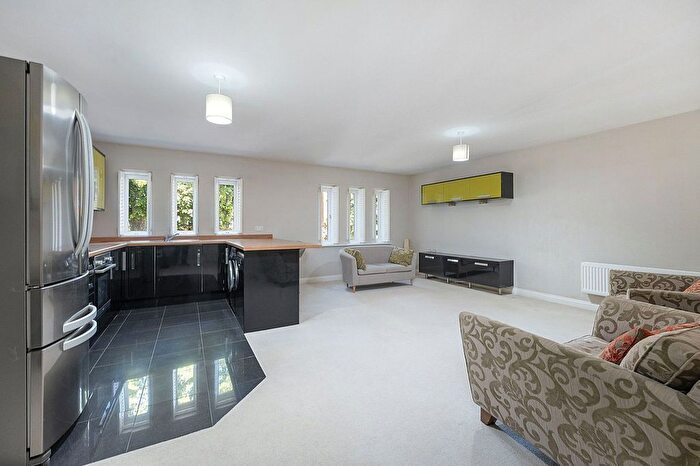
Properties for sale in Sutton South
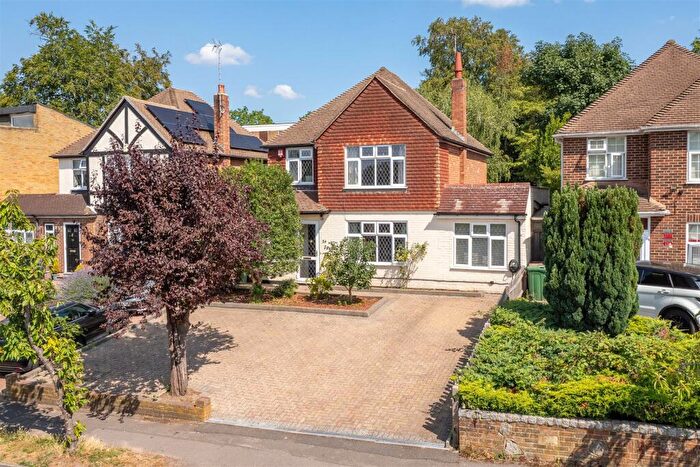
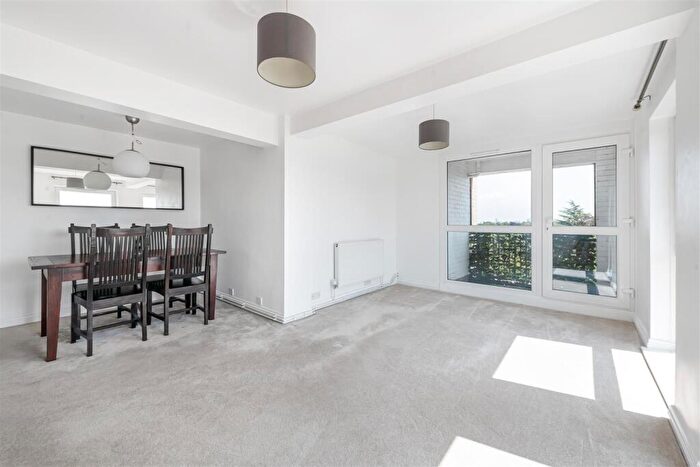
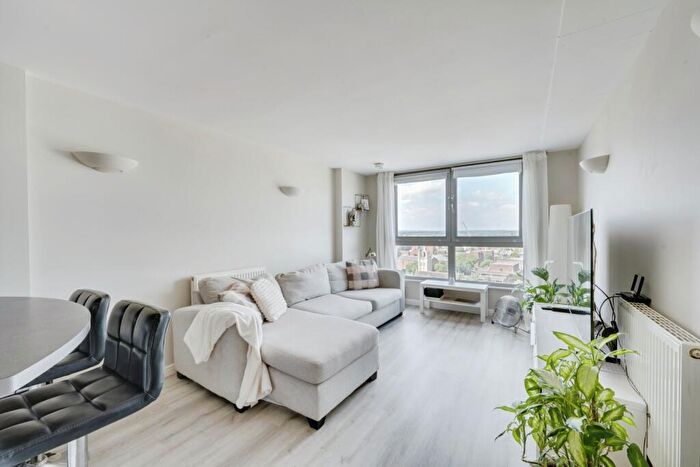
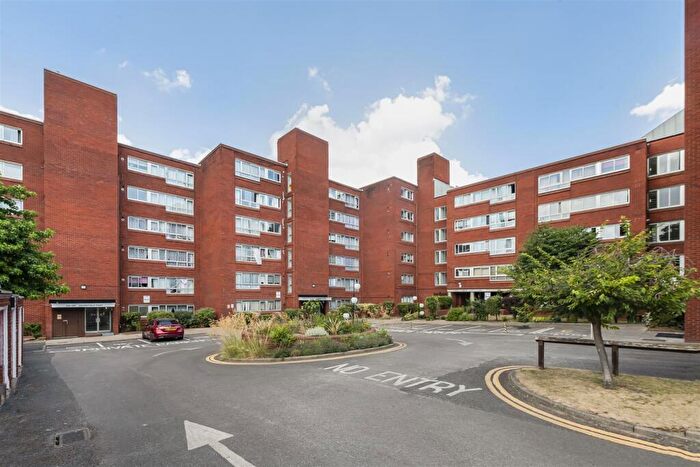
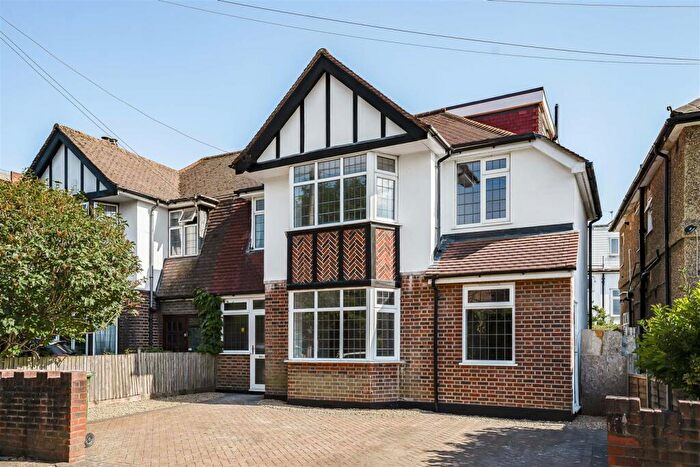
![]()
If you are looking to sell your house, let it out, or receive a property valuation, an expert can help you.
Click the button below to get started.

Roads and Postcodes in Sutton South
Navigate through our locations to find the location of your next house in Sutton South, Sutton for sale or to rent.
Property price trends in Sutton South
According to the latest Land Registry data, the average home in Sutton South sold for £366,444 in 2026. That figure comes from a substantial record of 7,674 sales logged over the past 31 years.
Prices have fallen back over the last three years. Compared with 2023, when the typical sale came in around £396,100, that's a fall of roughly 7.5%.
Looking back five years, average prices are down about 3.4% since 2021, a drop of around £12,715 in cash terms.
Zoom out to the past decade for the fuller picture. Back in 2016, homes here averaged £343,403, so the typical sold price has climbed about 6.7% since then, roughly 0.7% a year. Stretch the view to fifteen years and that annual pace edges up closer to 3.4%.
Frequently asked questions about Sutton South
What is the average price for a property for sale in Sutton South?
The average price for a property for sale in Sutton South is £398,647. This amount is 18% lower than the average price in Sutton. There are 3,468 property listings for sale in Sutton South.
What streets have the most expensive properties for sale in Sutton South?
The streets with the most expensive properties for sale in Sutton South are Coniston Gardens at an average of £1,155,000, Upland Road at an average of £1,040,300 and The Ridgway at an average of £1,014,500.
What streets have the most affordable properties for sale in Sutton South?
The streets with the most affordable properties for sale in Sutton South are Leith Towers at an average of £163,250, Westmoreland Drive at an average of £202,541 and Chanctonbury Gardens at an average of £229,000.
Which train stations are available in or near Sutton South?
Some of the train stations available in or near Sutton South are Sutton, Carshalton Beeches and Belmont.
Property Price Paid in Sutton South by Year
The average sold property price by year was:
| Year | Average Sold Price | Price Change |
Sold Properties
|
|---|---|---|---|
| 2026 | £366,444 | -9% |
9 Properties |
| 2025 | £400,240 | -0,3% |
141 Properties |
| 2024 | £401,549 | 1% |
169 Properties |
| 2023 | £396,100 | 4% |
167 Properties |
| 2022 | £380,878 | 0,5% |
226 Properties |
| 2021 | £379,159 | -1% |
210 Properties |
| 2020 | £382,774 | 10% |
162 Properties |
| 2019 | £343,778 | -7% |
148 Properties |
| 2018 | £367,609 | 7% |
149 Properties |
| 2017 | £343,617 | 0,1% |
179 Properties |
Property Price per Property Type in Sutton South
Here you can find historic sold price data in order to help with your property search.
The average Property Paid Price for specific property types in the last three years are:
| Property Type | Average Sold Price | Sold Properties |
|---|---|---|
| Flat | £299,160.00 | 377 Flats |
| Semi Detached House | £699,715.00 | 35 Semi Detached Houses |
| Detached House | £970,034.00 | 36 Detached Houses |
| Terraced House | £567,041.00 | 38 Terraced Houses |
