
Houses for sale & to rent in OL7 0BH, William Street, St Peters, Ashton-under-lyne
House Prices in OL7 0BH, William Street, St Peters
Properties in OL7 0BH have no sales history available within the last 3 years. OL7 0BH is a postcode in William Street located in St Peters, an area in Ashton-under-lyne, Tameside, with 3 households².
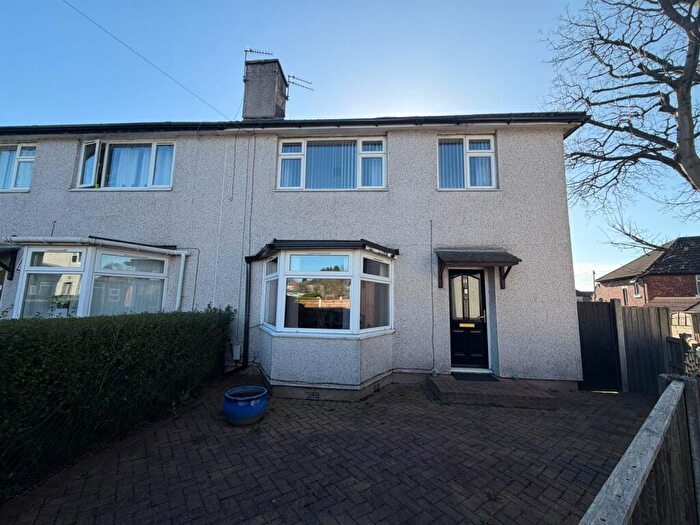
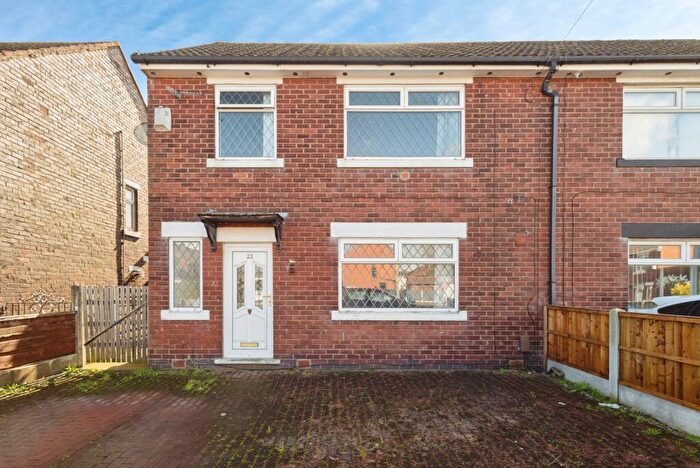
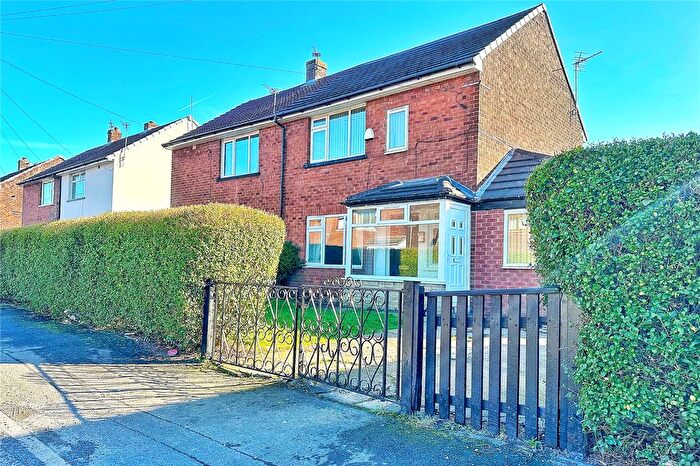
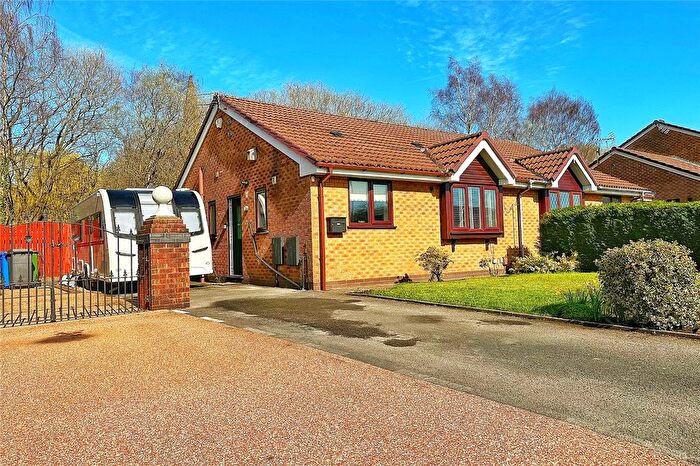
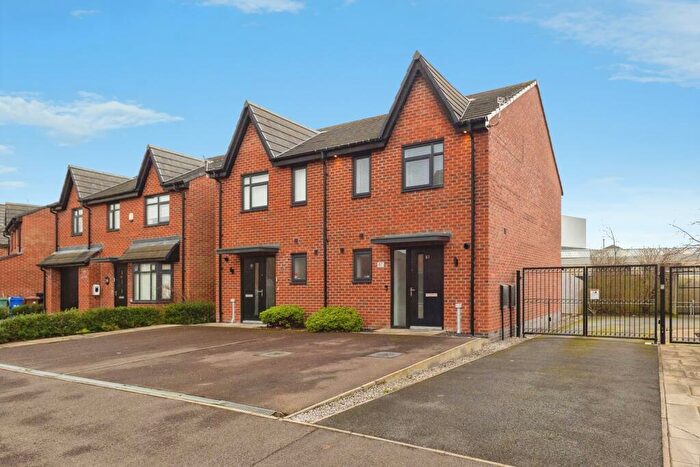
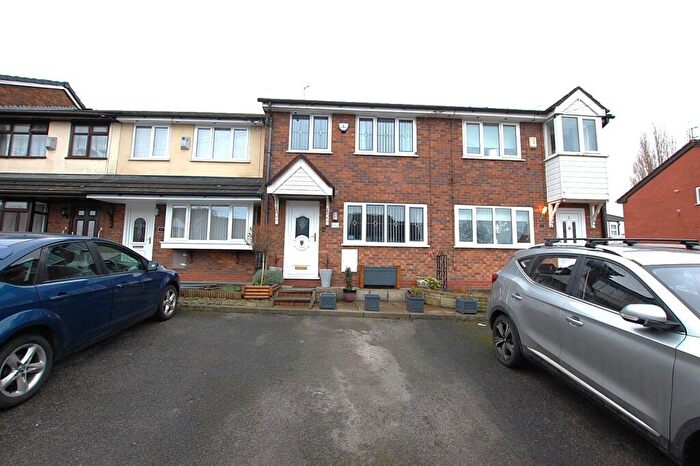
Properties for sale near OL7 0BH, William Street
![]()
If you are looking to sell your house, let it out, or receive a property valuation, an expert can help you.
Click the button below to get started.
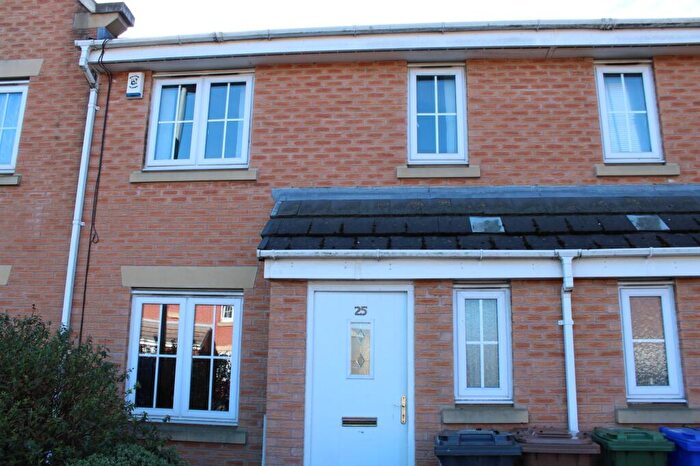
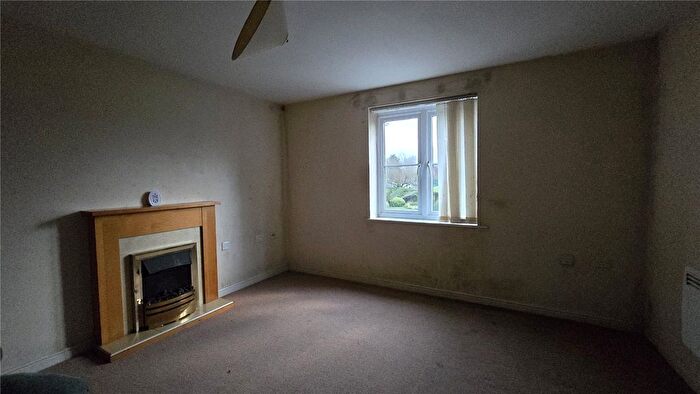
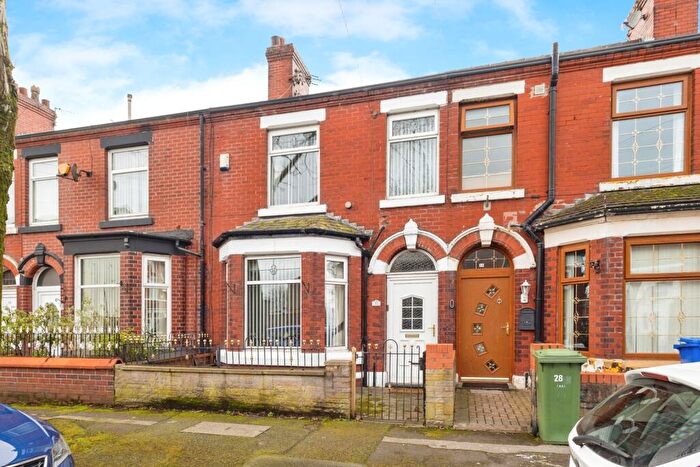
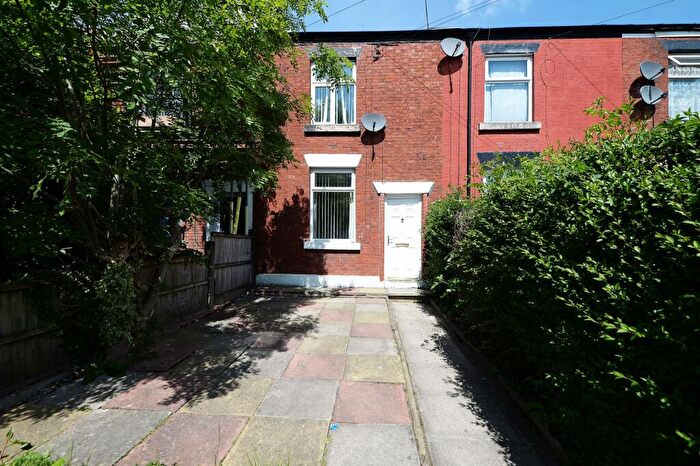
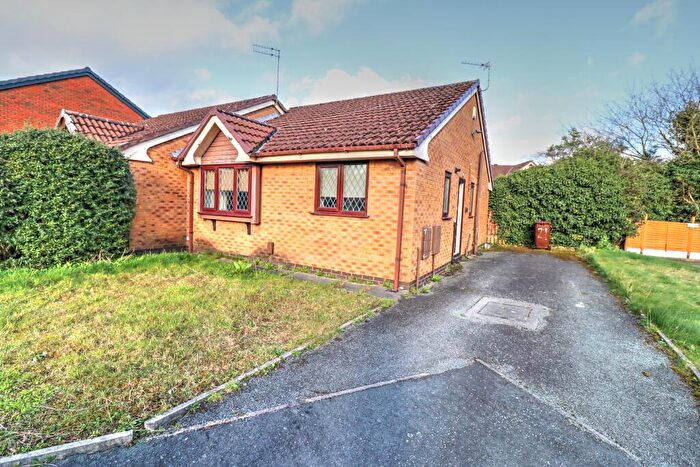
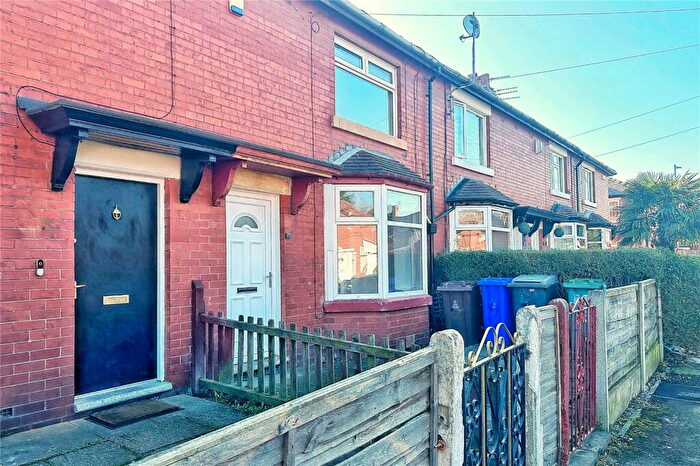
Previously listed properties near OL7 0BH, William Street
Price Paid in William Street, OL7 0BH, St Peters
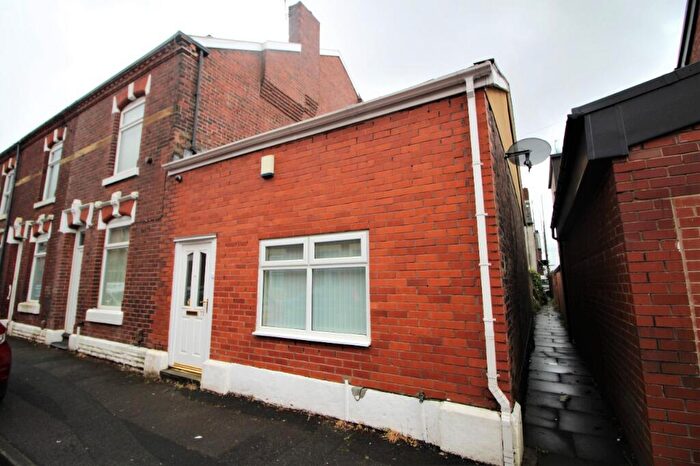
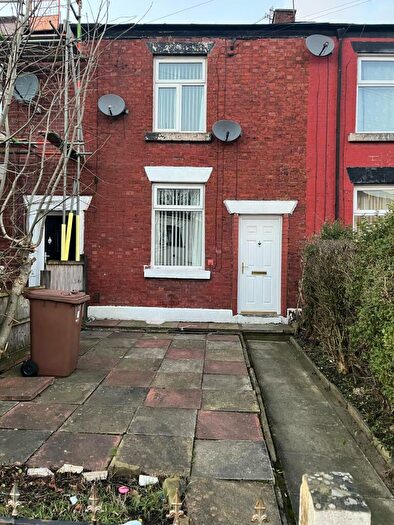
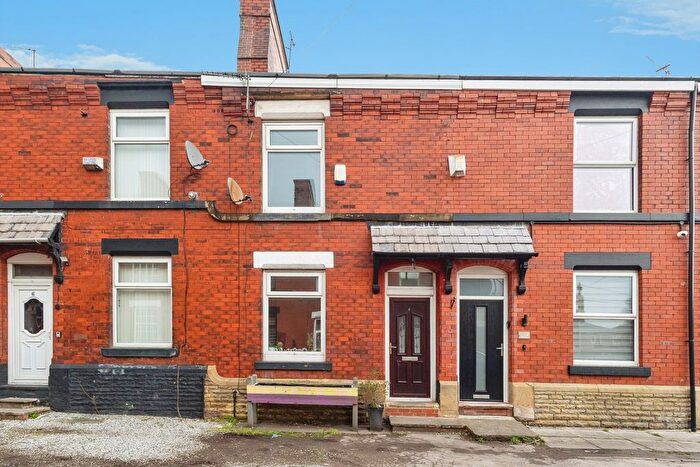
65 William Street, OL7 0BH, St Peters Ashton-under-lyne
Property 65 has been sold 2 times. The last time it was sold was in 22/10/2018 and the sold price was £78,088.00.
This terraced house, sold as a freehold on 22/10/2018, is a 163 sqm end-terrace house with an EPC rating of G.
| Date | Price | Property Type | Tenure | Classification |
|---|---|---|---|---|
| 22/10/2018 | £78,088.00 | Terraced House | freehold | Established Building |
| 03/11/1997 | £31,300.00 | Terraced House | freehold | Established Building |
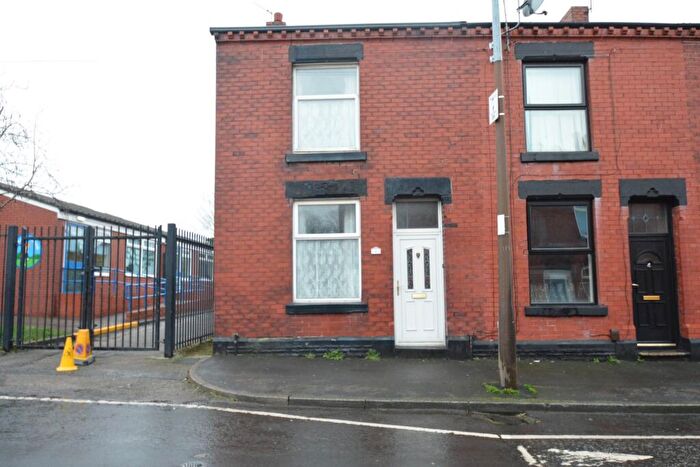
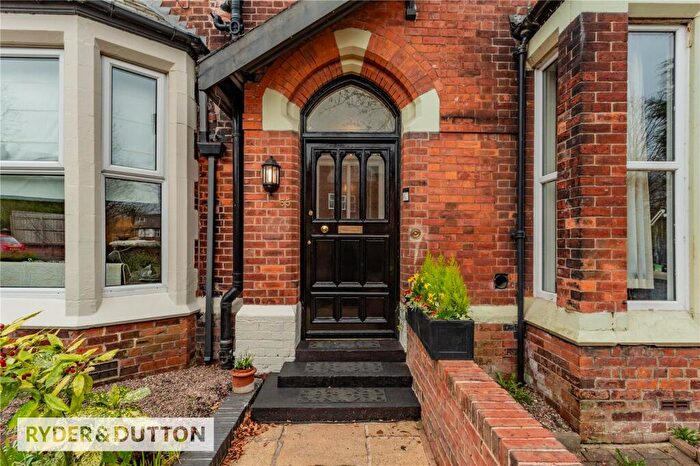
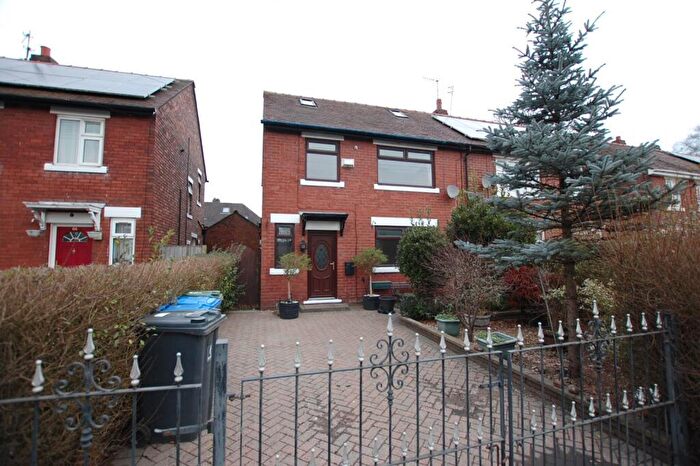
RYECROFT COTTAGE William Street, OL7 0BH, St Peters Ashton-under-lyne
Property RYECROFT COTTAGE has been sold 2 times. The last time it was sold was in 28/06/2013 and the sold price was £185,000.00.
This detached house, sold as a freehold on 28/06/2013, is a 230 sqm semi-detached house with an EPC rating of C.
| Date | Price | Property Type | Tenure | Classification |
|---|---|---|---|---|
| 28/06/2013 | £185,000.00 | Detached House | freehold | Established Building |
| 26/09/2005 | £200,000.00 | Detached House | freehold | Established Building |
Transport near OL7 0BH, William Street
-
 Guide Bridge Station
 -
Ashton-Under-Lyne Station
-
Hyde North Station
-
Fairfield Station
-
Flowery Field Station
-
Stalybridge Station
-
Denton Station
-
Hyde Central Station
-
Newton For Hyde Station
-
Gorton Station
House price paid reports for OL7 0BH, William Street
Click on the buttons below to see price paid reports by year or property price:
- Price Paid By Year
Property Price Paid in OL7 0BH, William Street by Year
The average sold property price by year was:
| Year | Average Sold Price | Price Change |
Sold Properties
|
|---|---|---|---|
| 2018 | £78,088 | -137% |
1 Property |
| 2013 | £185,000 | -8% |
1 Property |
| 2005 | £200,000 | 84% |
1 Property |
| 1997 | £31,300 | - |
1 Property |