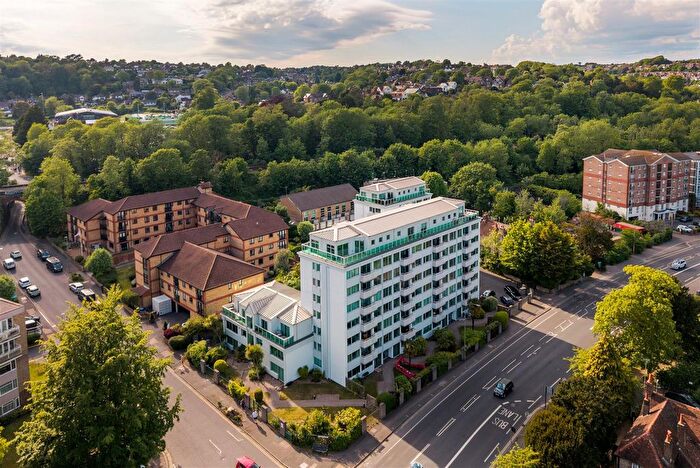
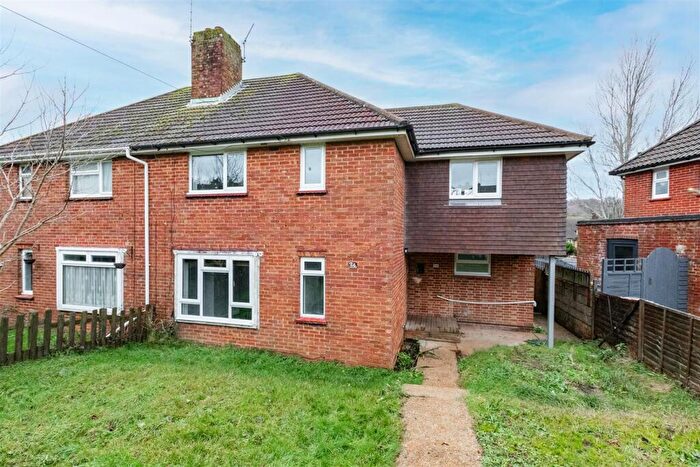
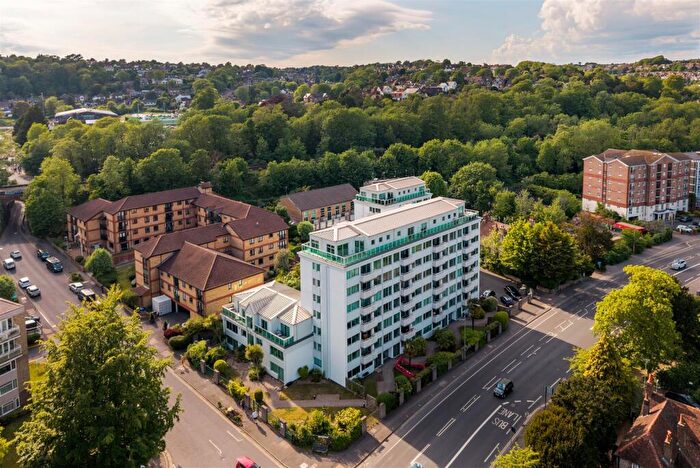
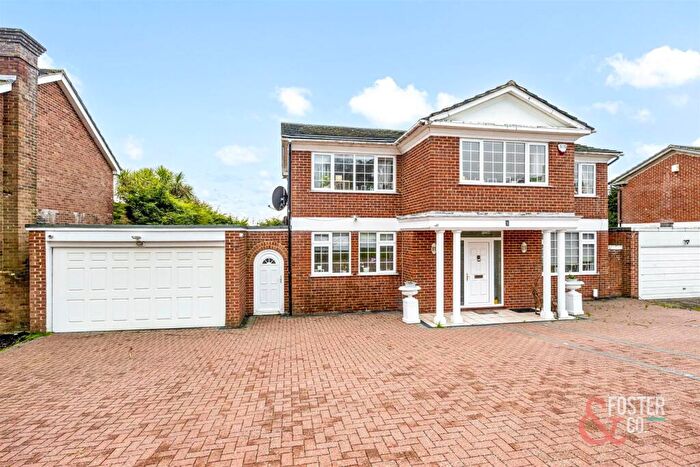
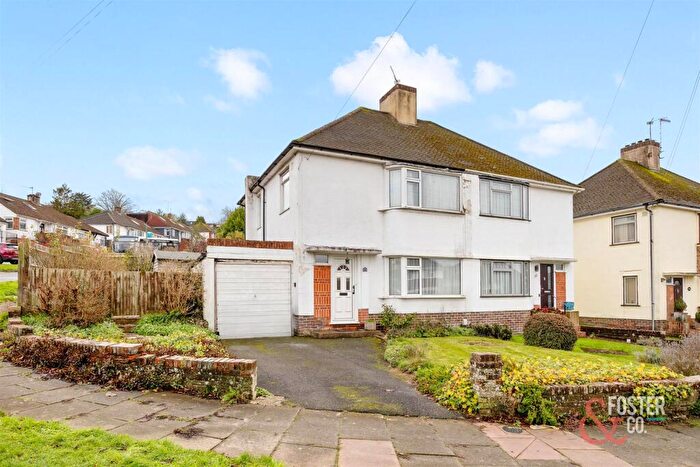
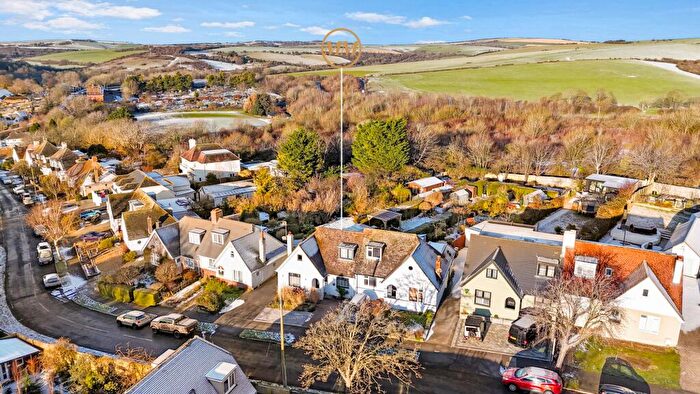
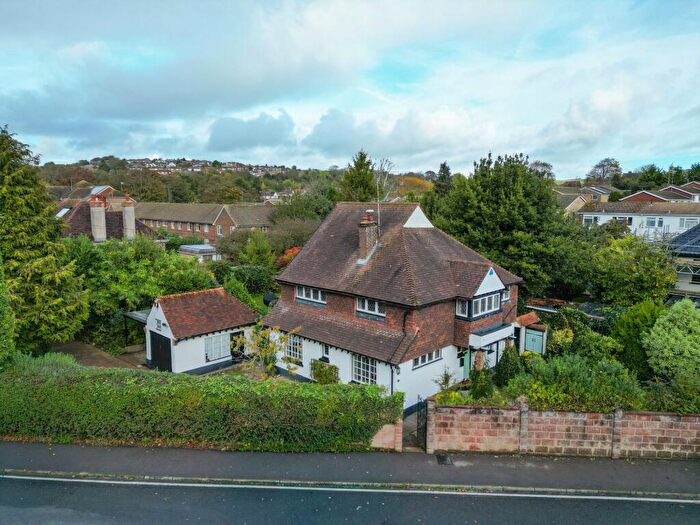
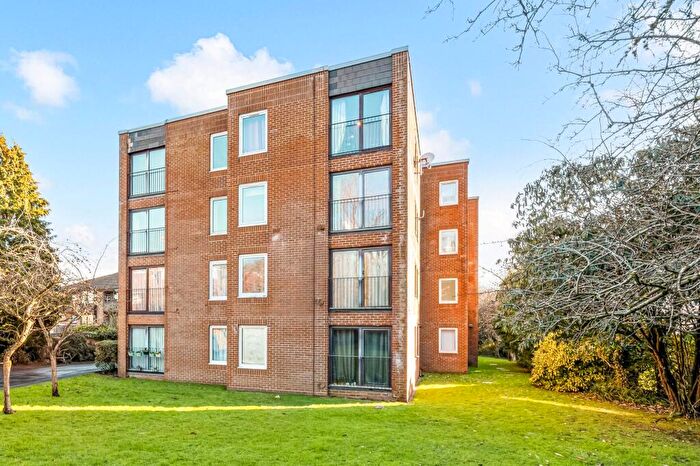
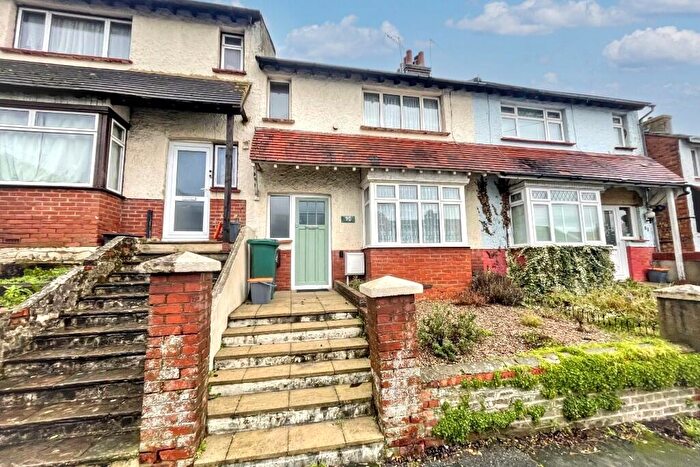
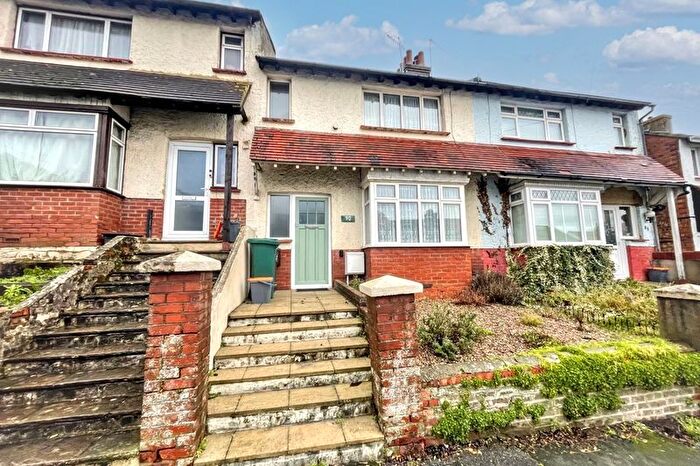
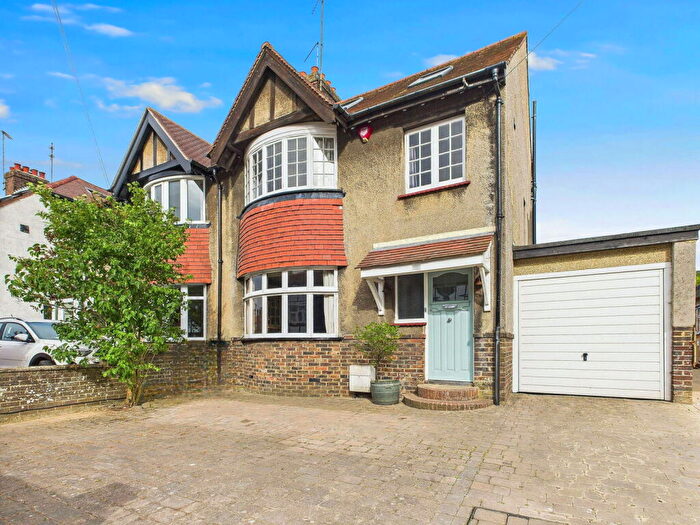
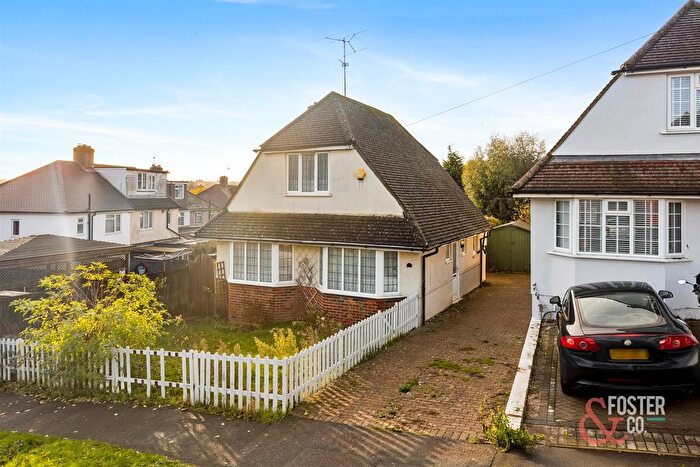
Houses for sale & to rent in Patcham, Brighton
House Prices in Patcham
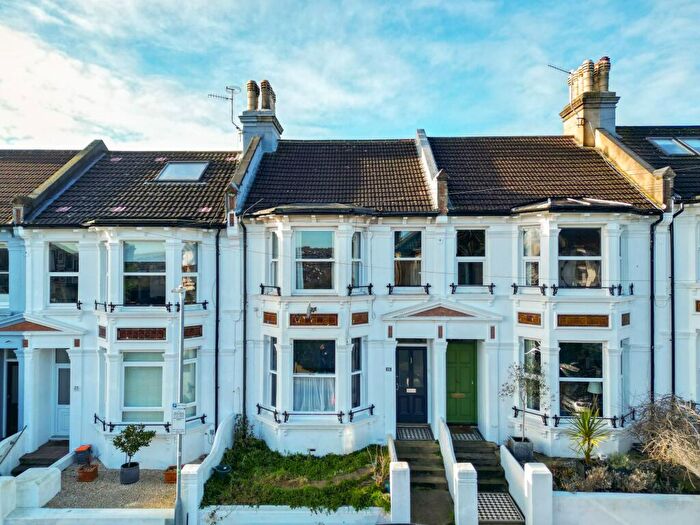
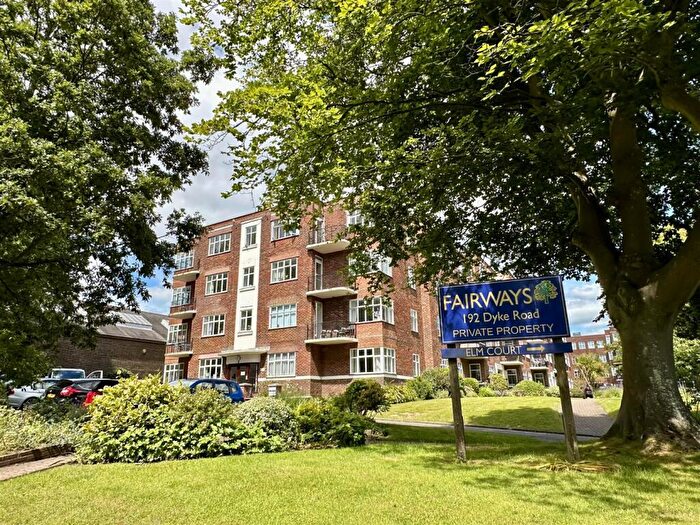
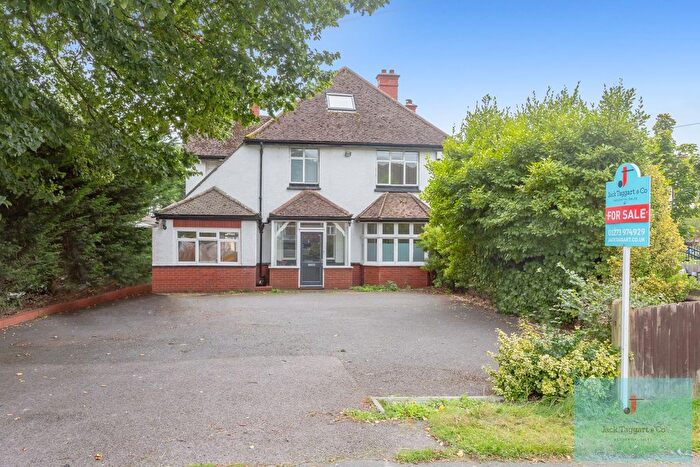
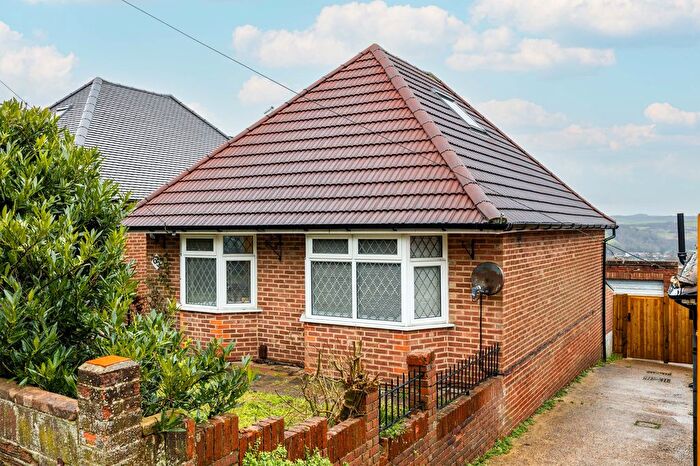
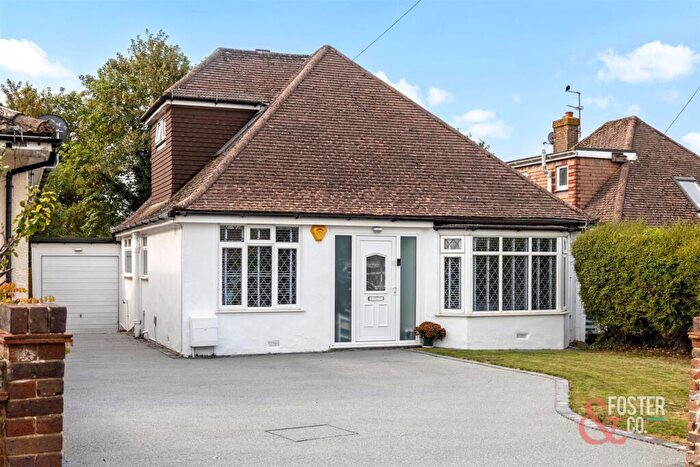
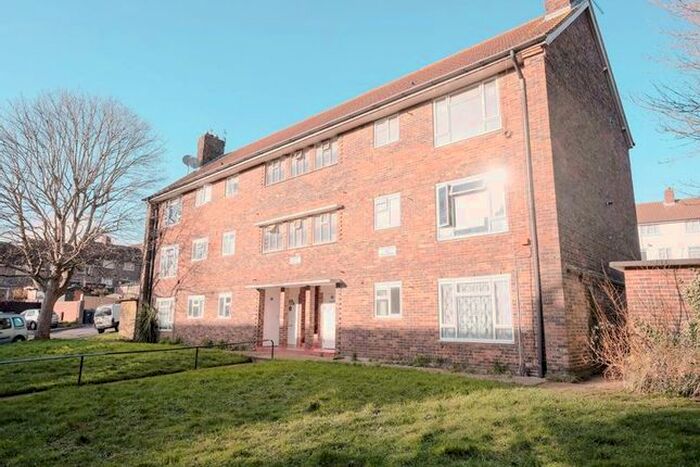
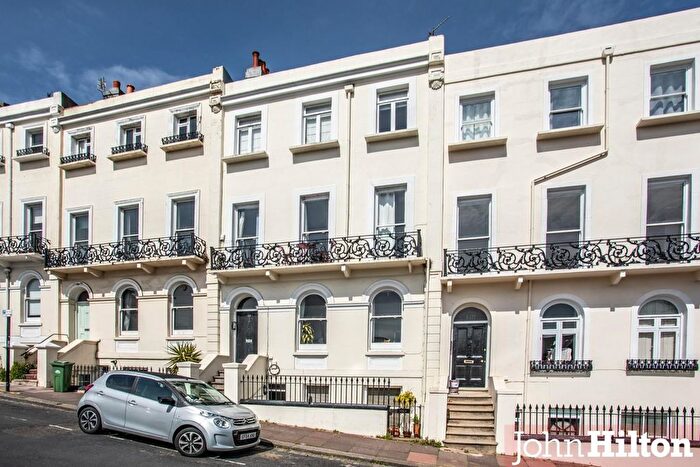
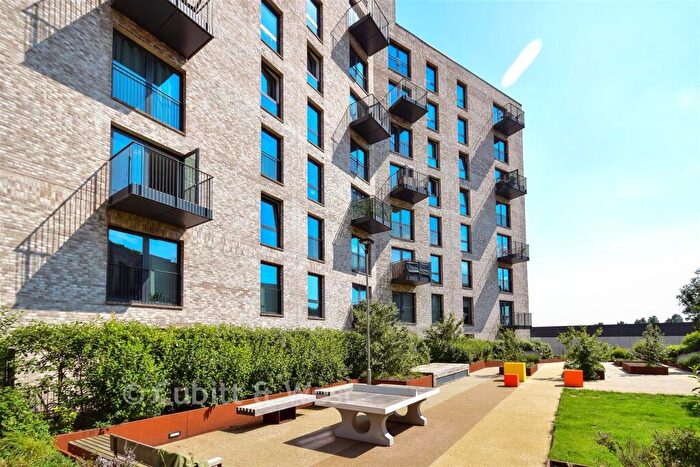
Properties in Patcham have an average house price of £515,903.00 and had 658 Property Transactions within the last 3 years¹.
Patcham is an area in Brighton, The City of Brighton and Hove with 5,818 households², where the most expensive property was sold for £1,585,000.00.
Properties for sale in Patcham
Roads and Postcodes in Patcham
Navigate through our locations to find the location of your next house in Patcham, Brighton for sale or to rent.
| Streets | Postcodes |
|---|---|
| Ashley Close | BN1 8YT |
| Audrey Close | BN1 8XP |
| Ballards Mill Close | BN1 8AL |
| Baranscraig Avenue | BN1 8RE BN1 8RF |
| Barrhill Avenue | BN1 8UE BN1 8UF |
| Beechwood Avenue | BN1 8ED BN1 8EE |
| Beechwood Close | BN1 8EP |
| Bengairn Avenue | BN1 8RH |
| Birch Grove Crescent | BN1 8DN BN1 8DP |
| Braeside Avenue | BN1 8RL BN1 8RN BN1 8SP BN1 8SQ |
| Bramble Way | BN1 8GJ BN1 8GL |
| Brangwyn Avenue | BN1 8XG BN1 8XH |
| Brangwyn Crescent | BN1 8XJ |
| Brangwyn Drive | BN1 8XB BN1 8XD |
| Brangwyn Way | BN1 8XA BN1 8XT |
| Braybon Avenue | BN1 8EA BN1 8HG BN1 8HH |
| Braypool Lane | BN1 8PP BN1 8ZH |
| Brompton Close | BN1 8QD |
| Buttercup Walk | BN1 8PN |
| Buxted Rise | BN1 8FG |
| Carden Avenue | BN1 8LE BN1 8LG BN1 8LH BN1 8LJ BN1 8LL BN1 8LN BN1 8NA BN1 8NE BN1 8NF BN1 8NH BN1 8LW |
| Carden Close | BN1 8TP |
| Carden Crescent | BN1 8TQ |
| Carden Hill | BN1 8AA BN1 8AB BN1 8AH BN1 8DA BN1 8DB BN1 8DD BN1 8GN |
| Carol Close | BN1 8QG |
| Charles Kingston Gardens | BN1 8NB |
| Chelwood Close | BN1 8FN |
| Church Close | BN1 8HS |
| Church Hill | BN1 8YE |
| Clovers End | BN1 8PJ |
| County Oak Avenue | BN1 8DJ BN1 8LT BN1 8LU |
| Court Close | BN1 8YG |
| Crabtree Avenue | BN1 8DE BN1 8DG BN1 8DH BN1 8DS |
| Craignair Avenue | BN1 8UG BN1 8UH |
| Crowhurst Road | BN1 8AF BN1 8AP BN1 8AS BN1 8AT |
| Cuckmere Way | BN1 8GA BN1 8GB BN1 8GF BN1 8GH BN1 8GQ |
| Dale Avenue | BN1 8NJ |
| Dale Crescent | BN1 8NT BN1 8NU |
| Dale Drive | BN1 8LD |
| Darcey Drive | BN1 8LF |
| Denton Drive | BN1 8DL BN1 8LR BN1 8LS |
| Ditchling Crescent | BN1 8GD |
| Ditchling Road | BN1 6XB |
| Eastfield Crescent | BN1 8EL |
| Eastwick Close | BN1 8SF |
| Elsted Crescent | BN1 8GE |
| Eskbank Avenue | BN1 8SL |
| Fernhurst Close | BN1 8FE |
| Fernhurst Crescent | BN1 8FA BN1 8FD |
| Galliers Close | BN1 8TR |
| Glenfalls Avenue | BN1 8SJ |
| Graham Avenue | BN1 8HA BN1 8HB BN1 8HD |
| Grange Walk | BN1 8BL BN1 8WL |
| Grangeways | BN1 8XN |
| Greenfield Close | BN1 8HN |
| Greenfield Crescent | BN1 8HJ BN1 8HL |
| Hartfield Avenue | BN1 8AD BN1 8AE |
| Haywards Road | BN1 8TN |
| Heston Avenue | BN1 8UP |
| Highfield Crescent | BN1 8JD |
| Highview Avenue North | BN1 8WR |
| Highview Avenue South | BN1 8WQ BN1 8WW |
| Highview Road | BN1 8WT |
| Highview Way | BN1 8WS |
| Hurst Hill | BN1 8GG |
| Jasmine Court | BN1 8NG |
| Kenmure Avenue | BN1 8SH |
| Keymer Road | BN1 8FB |
| Ladies Mile Close | BN1 8TS |
| Ladies Mile Road | BN1 8QE BN1 8QF BN1 8QN BN1 8TA BN1 8TB BN1 8TD BN1 8TE BN1 8TF BN1 8PB |
| Land Adjoining | BN1 8LA |
| Larkfield Way | BN1 8EF BN1 8EG |
| Lomond Avenue | BN1 8SN |
| London Road | BN1 8QA BN1 8QS BN1 8QT BN1 8YD BN1 8YQ |
| Lyminster Avenue | BN1 8JL BN1 8JN |
| Mackie Avenue | BN1 8RA BN1 8RB BN1 8RD BN1 8SB BN1 8SD BN1 8SE BN1 8SG |
| Mayfield Close | BN1 8HP |
| Mayfield Crescent | BN1 8HQ BN1 8HR |
| Midhurst Rise | BN1 8LP |
| Mill Cottages | BN1 8WN |
| Morecambe Road | BN1 8TL |
| Northfield Way | BN1 8EH |
| Old Boat Walk | BN1 8PL |
| Old Court Close | BN1 8HF |
| Old Farm Road | BN1 8HE |
| Old London Road | BN1 8XL BN1 8XQ BN1 8XR BN1 8XS BN1 8YA BN1 8BB |
| Old Mill Close | BN1 8WE |
| Old Patcham Mews | BN1 8YW |
| Orchid View | BN1 8GP |
| Overhill Drive | BN1 8WF BN1 8WG BN1 8WH BN1 8WJ |
| Overhill Gardens | BN1 8ND |
| Overhill Way | BN1 8WP |
| Patcham By Pass | BN1 8YB |
| Patcham Grange | BN1 8UR |
| Patchdean | BN1 8LZ |
| Petworth Road | BN1 8LQ |
| Plainfields Avenue | BN1 8RJ |
| Portfield Avenue | BN1 8TG |
| Ridgeside Avenue | BN1 8WB BN1 8WD |
| Rodmell Place | BN1 8DR |
| Rotherfield Close | BN1 8FJ |
| Rotherfield Crescent | BN1 8FF BN1 8FH BN1 8FP BN1 8FQ |
| Rustington Road | BN1 8DQ |
| Sanyhils Avenue | BN1 8UL BN1 8UN |
| Saxon Way | BN1 8AN |
| Singleton Road | BN1 8TH |
| Solway Avenue | BN1 8UJ |
| South Woodlands | BN1 8WU |
| St Michaels Way | BN1 8AZ |
| Stoneleigh Avenue | BN1 8NP |
| Stoneleigh Close | BN1 8NQ |
| Sunnydale Avenue | BN1 8NR |
| Sunnydale Close | BN1 8NS |
| Surrenden Close | BN1 8EB |
| Surrenden Road | BN1 6NN BN1 6ZA |
| Tangmere Place | BN1 8TZ |
| Tangmere Road | BN1 8TJ |
| The Close | BN1 8XF |
| The Deeside | BN1 8SA |
| The Deneway | BN1 8QR |
| The Square | BN1 8YP |
| The Village Barn | BN1 8YU |
| The Woodlands | BN1 8WA |
| Thornhill Avenue | BN1 8RG |
| Upper Winfield Avenue | BN1 8QJ |
| Vale Avenue | BN1 8UA BN1 8UB BN1 8YF |
| Warmdene Avenue | BN1 8UD |
| Warmdene Close | BN1 8LB |
| Warmdene Road | BN1 8NL BN1 8NN BN1 8NX BN1 8NY BN1 8NZ BN1 8PA |
| Warmdene Way | BN1 8NW |
| Warnham Rise | BN1 8DF |
| Westfield Close | BN1 8EN |
| Westfield Crescent | BN1 8JA BN1 8JB |
| Wilmington Close | BN1 8JE |
| Wilmington Parade | BN1 8JJ |
| Wilmington Way | BN1 8JF BN1 8JG BN1 8JH |
| Windmill View | BN1 8TU |
| Winfield Avenue | BN1 8QH |
| Winfield Close | BN1 8QL |
| Woodbourne Avenue | BN1 8EJ BN1 8EQ BN1 8AG |
| Woodland Way | BN1 8BA |
| Youngsmere Close | BN1 8FL |
| BN1 8ZA BN1 8ZB |
Transport near Patcham
-
Preston Park Station
-
Moulsecoomb Station
-
London Road Brighton Station
-
Brighton Station
-
Hove Station
-
Falmer Station
-
Aldrington Station
- FAQ
- Price Paid By Year
- Property Type Price
Frequently asked questions about Patcham
What is the average price for a property for sale in Patcham?
The average price for a property for sale in Patcham is £515,903. This amount is 11% higher than the average price in Brighton. There are 5,107 property listings for sale in Patcham.
What streets have the most expensive properties for sale in Patcham?
The streets with the most expensive properties for sale in Patcham are Surrenden Road at an average of £1,083,000, Beechwood Close at an average of £1,080,000 and Ditchling Road at an average of £1,030,000.
What streets have the most affordable properties for sale in Patcham?
The streets with the most affordable properties for sale in Patcham are London Road at an average of £259,721, Birch Grove Crescent at an average of £315,800 and Greenfield Close at an average of £350,000.
Which train stations are available in or near Patcham?
Some of the train stations available in or near Patcham are Preston Park, Moulsecoomb and London Road Brighton.
Property Price Paid in Patcham by Year
The average sold property price by year was:
| Year | Average Sold Price | Price Change |
Sold Properties
|
|---|---|---|---|
| 2025 | £481,087 | -8% |
109 Properties |
| 2024 | £521,584 | 2% |
188 Properties |
| 2023 | £513,451 | -3% |
149 Properties |
| 2022 | £530,488 | 8% |
212 Properties |
| 2021 | £488,375 | 9% |
277 Properties |
| 2020 | £444,273 | 7% |
185 Properties |
| 2019 | £415,030 | -1% |
171 Properties |
| 2018 | £419,834 | 2% |
188 Properties |
| 2017 | £412,193 | 3% |
226 Properties |
| 2016 | £398,014 | 11% |
203 Properties |
| 2015 | £352,870 | 4% |
219 Properties |
| 2014 | £339,154 | 16% |
232 Properties |
| 2013 | £283,401 | - |
215 Properties |
| 2012 | £283,263 | 4% |
212 Properties |
| 2011 | £273,025 | 0,5% |
200 Properties |
| 2010 | £271,771 | 10% |
183 Properties |
| 2009 | £243,596 | -9% |
183 Properties |
| 2008 | £264,672 | -6% |
136 Properties |
| 2007 | £281,867 | 12% |
259 Properties |
| 2006 | £248,575 | 7% |
316 Properties |
| 2005 | £230,928 | 0,1% |
280 Properties |
| 2004 | £230,790 | 14% |
243 Properties |
| 2003 | £199,174 | 9% |
262 Properties |
| 2002 | £181,422 | 18% |
289 Properties |
| 2001 | £147,934 | 7% |
347 Properties |
| 2000 | £137,977 | 25% |
236 Properties |
| 1999 | £103,240 | 8% |
327 Properties |
| 1998 | £95,032 | 10% |
287 Properties |
| 1997 | £85,913 | 19% |
271 Properties |
| 1996 | £69,966 | -6% |
277 Properties |
| 1995 | £74,425 | - |
210 Properties |
Property Price per Property Type in Patcham
Here you can find historic sold price data in order to help with your property search.
The average Property Paid Price for specific property types in the last three years are:
| Property Type | Average Sold Price | Sold Properties |
|---|---|---|
| Flat | £265,572.00 | 70 Flats |
| Semi Detached House | £503,539.00 | 376 Semi Detached Houses |
| Detached House | £722,387.00 | 133 Detached Houses |
| Terraced House | £448,935.00 | 79 Terraced Houses |

