
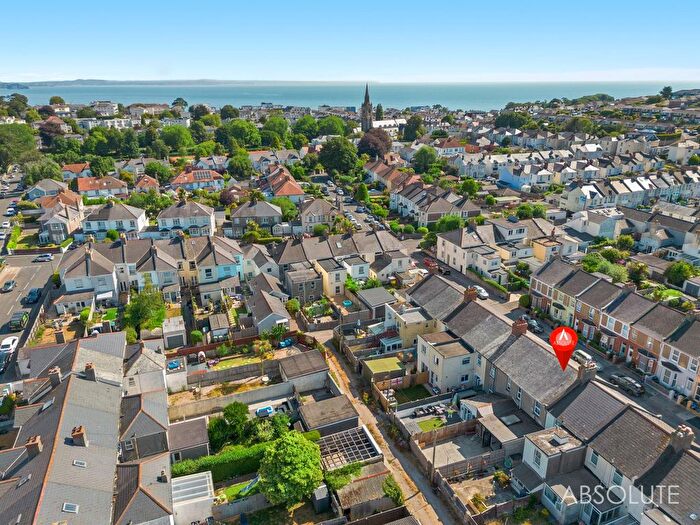
Houses for sale in Ellacombe, Torquay
House Prices in Ellacombe
Properties in Ellacombe have an average house price of £204k and had 334 Property Transactions within the last 3 years¹.
Ellacombe is an area in Torquay, Torbay with 3,429 households², where the most expensive property was sold for £580k.
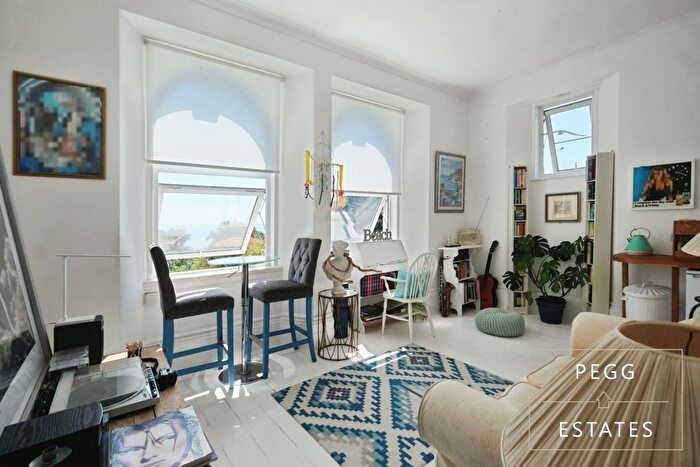
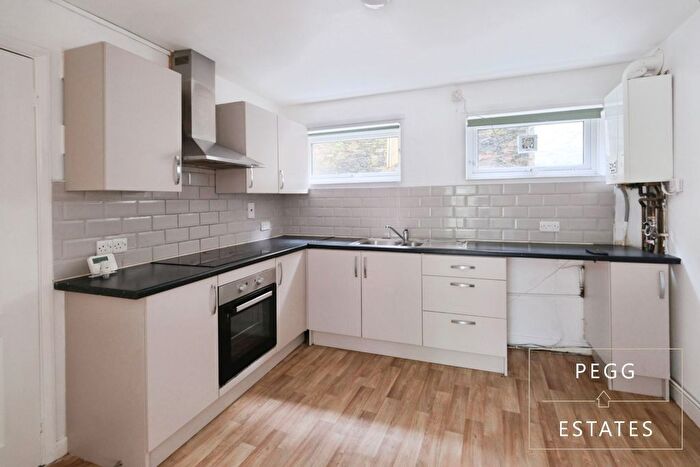
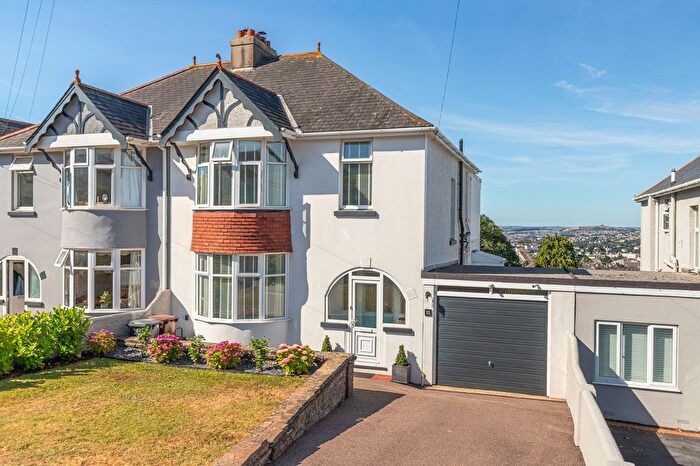
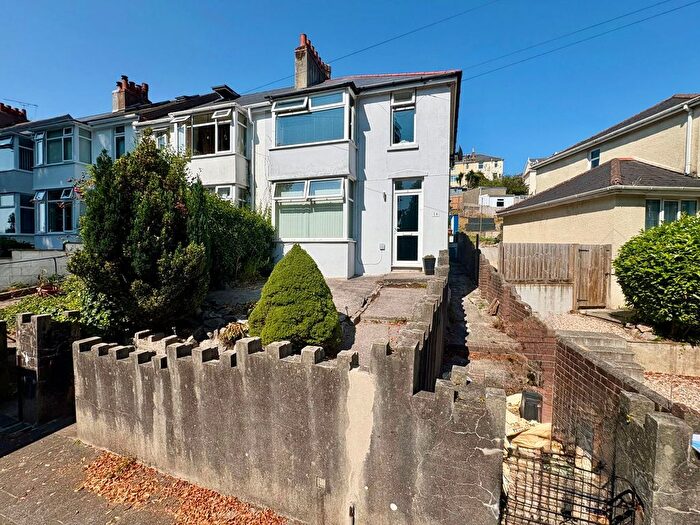
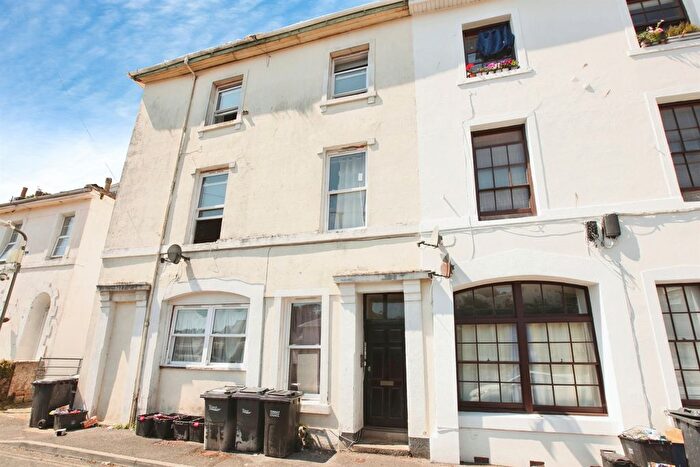
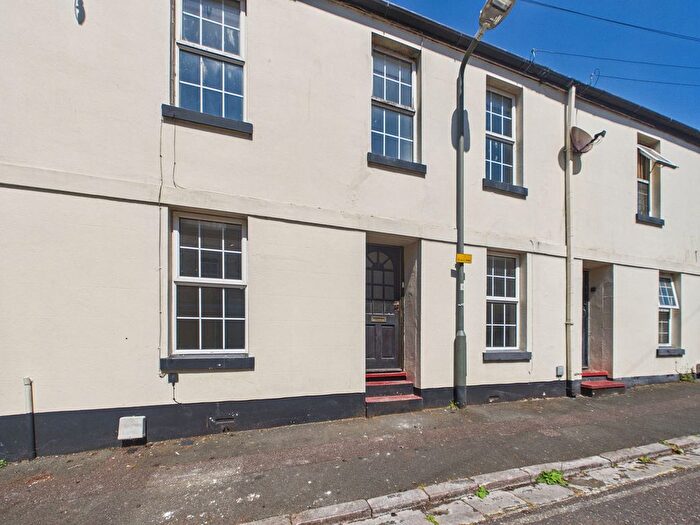
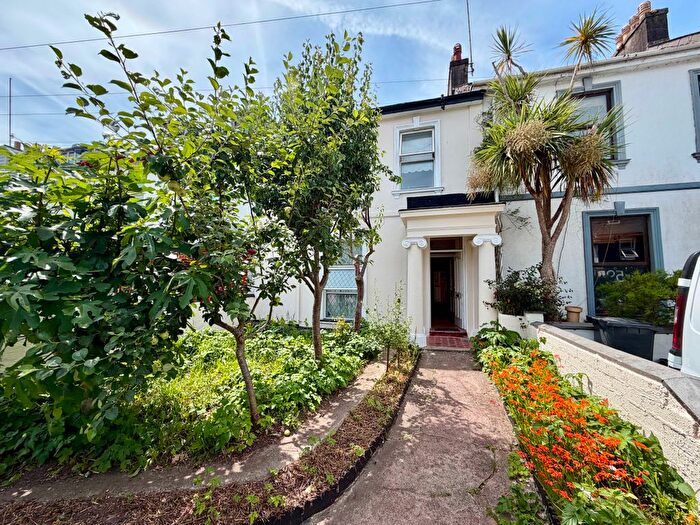
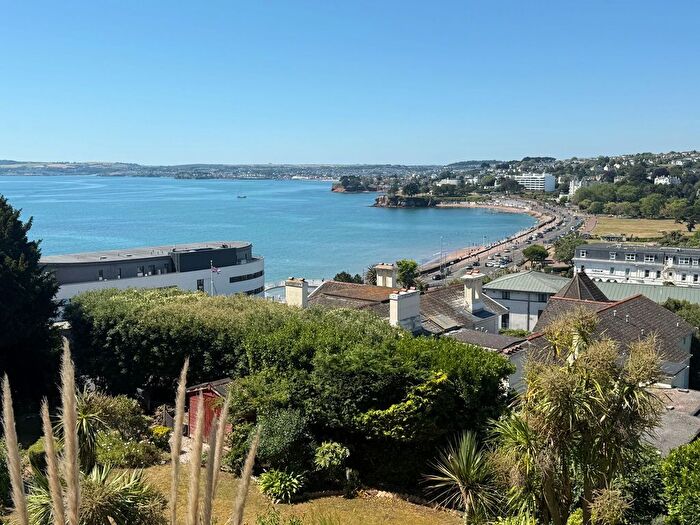
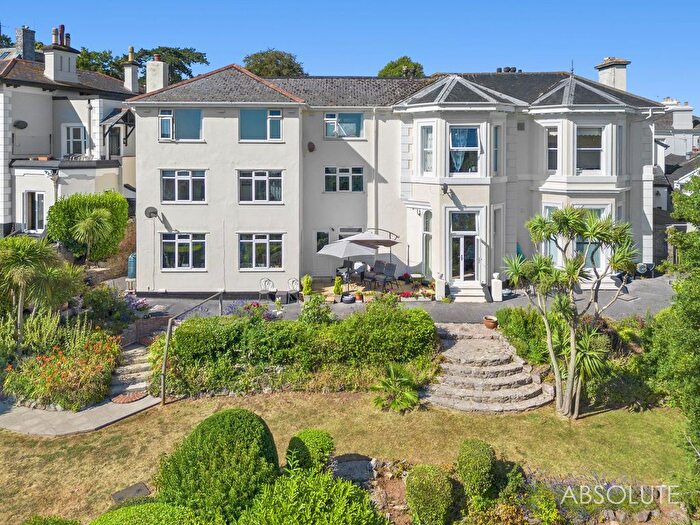
Properties for sale in Ellacombe
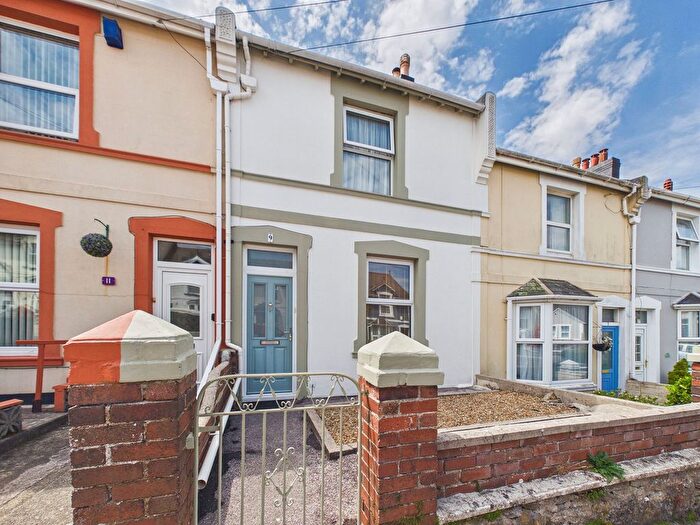
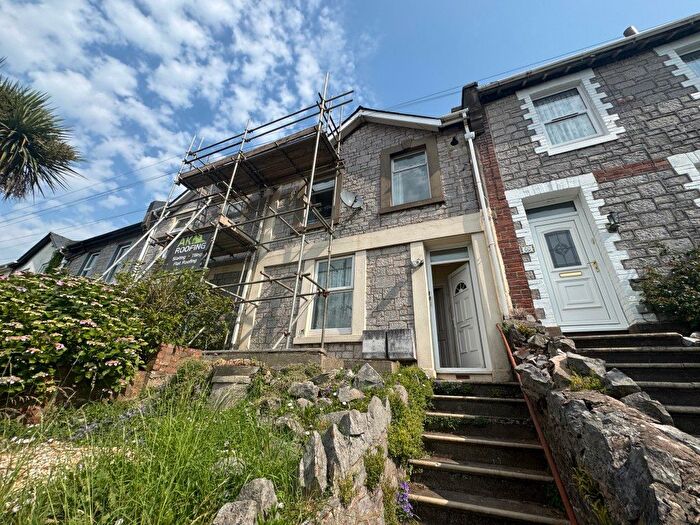
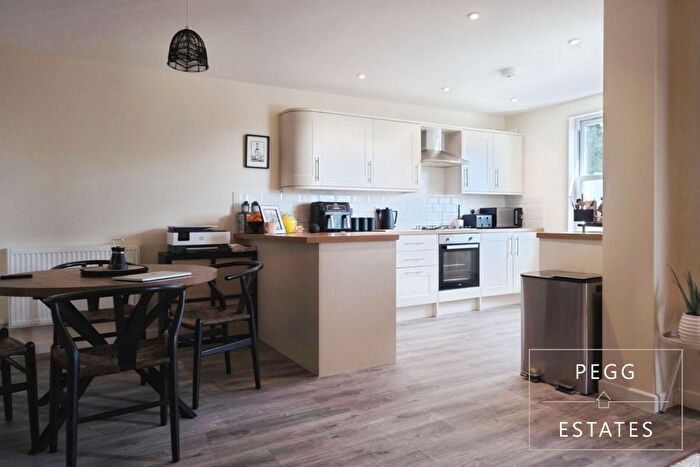
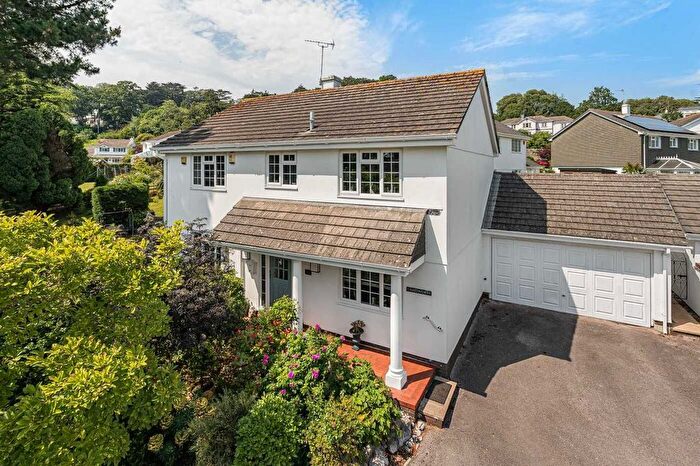
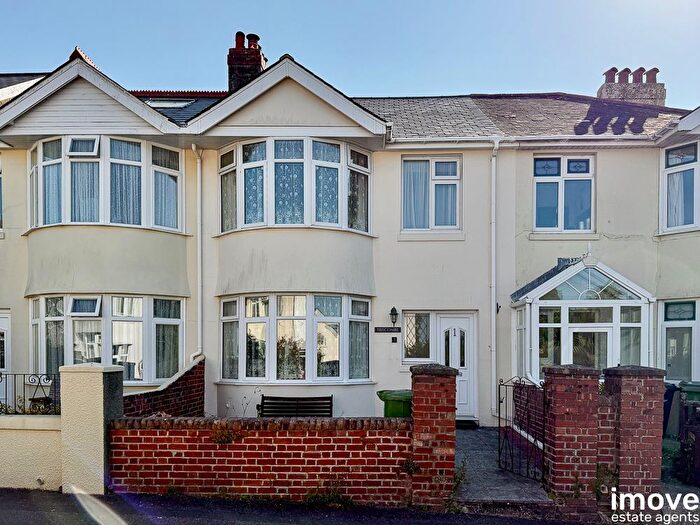
![]()
If you are looking to sell your house, let it out, or receive a property valuation, an expert can help you.
Click the button below to get started.
Roads and Postcodes in Ellacombe
Navigate through our locations to find the location of your next house in Ellacombe, Torquay for sale or to rent.
| Streets | Postcodes |
|---|---|
| Alexandra Lane | TQ1 1JD |
| Alexandra Road | TQ1 1HZ |
| All Saints Road | TQ1 3RD |
| Alpine Road | TQ1 1RB TQ1 1AQ TQ1 1RE |
| Ash Hill Road | TQ1 3HZ TQ1 3JA TQ1 3JB |
| Belmont Road | TQ1 1ND TQ1 1NE |
| Berachah Road | TQ1 3AX |
| Berea Road | TQ1 1JP |
| Bethel Terrace | TQ1 1NN |
| Braddon Street | TQ1 1QH |
| Briary Lane | TQ1 3BD TQ1 3BX |
| Bronshill Mews | TQ1 3HT |
| Bronshill Road | TQ1 3HE TQ1 3HA TQ1 3HD |
| Camden Road | TQ1 1NZ |
| Carlton Mews | TQ1 1NG |
| Carlton Road | TQ1 1LZ TQ1 1NA TQ1 1NB |
| Cary Park Road | TQ1 3PU |
| Castle Gardens | TQ1 3BQ |
| Castle Lane | TQ1 3AN TQ1 3BE |
| Castle Road | TQ1 3BB TQ1 3BG |
| Cavern Road | TQ1 1NS |
| Chatsworth Road | TQ1 3BH TQ1 3BJ TQ1 3BL TQ1 3BN |
| Clifton Terrace | TQ1 1EZ |
| Congella Road | TQ1 1JU |
| Denys Road | TQ1 1JL |
| Dunmere Road | TQ1 1LR |
| Egerton Road | TQ1 1JJ TQ1 1JN |
| Ellacombe Church Road | TQ1 1TG TQ1 1LG TQ1 1LH TQ1 1LJ TQ1 1LL TQ1 1LN TQ1 1LW |
| Ellacombe Road | TQ1 3AT TQ1 3AU TQ1 3BT TQ1 3BU |
| Florida Road | TQ1 1JY |
| Garden Road | TQ1 1TF |
| Grafton Terrace | TQ1 1QG |
| Grange Road | TQ1 1JZ TQ1 1LE TQ1 1LF |
| Hatfield Road | TQ1 3BP TQ1 3BW |
| Henbury Close | TQ1 3HR |
| Highbury Road | TQ1 1TE |
| Higher Queens Terrace | TQ1 1RG |
| Hilldrop Terrace | TQ1 3AP |
| Hillesdon Road | TQ1 1QQ |
| Hingston Road | TQ1 3RA |
| Hoxton Road | TQ1 1JG TQ1 1JQ TQ1 1NY |
| Kenwyn Road | TQ1 1LU TQ1 1LX TQ1 1LY |
| Lords Place | TQ1 3HS |
| Lower Congella Road | TQ1 1JW |
| Lower Ellacombe Church Road | TQ1 1JH |
| Madrepore Road | TQ1 1EY |
| Market Street | TQ1 3AF TQ1 3AH TQ1 3AW TQ1 3BY |
| Middle Warberry Road | TQ1 1QX |
| Mount Hermon Road | TQ1 1NF |
| Mount Pleasant Road | TQ1 1LQ |
| Netherleigh Road | TQ1 3HB |
| Orchard Road | TQ1 1JE |
| Pembroke Road | TQ1 1NR |
| Pennsylvania Road | TQ1 1NX |
| Pine View Avenue | TQ1 1JR |
| Pine View Gardens | TQ1 1JS |
| Pine View Road | TQ1 1JT |
| Potters Hill | TQ1 3AR TQ1 3AS |
| Princes Road | TQ1 1NL TQ1 1NP TQ1 1NW TQ1 1PA |
| Princes Road East | TQ1 1PE TQ1 1PF TQ1 1PG |
| Princes Road West | TQ1 1PB TQ1 1PD |
| Queen Street | TQ1 1RQ |
| Quinta Close | TQ1 3RP TQ1 3RU TQ1 3RW |
| Quinta Road | TQ1 3RJ TQ1 3RL TQ1 3RN |
| Rear Dunmere Road | TQ1 1LS |
| Reddenhill Road | TQ1 3RQ |
| St Michaels Terrace | TQ1 3AL |
| Stentiford Hill Road | TQ1 1RF |
| Sunbury Hill | TQ1 3EU |
| The Crestas | TQ1 3RH |
| Thurlow Road | TQ1 3EQ |
| Victoria Road | TQ1 1HT TQ1 1HU TQ1 1HX TQ1 1HY |
| Warberry Road West | TQ1 1NT |
| Warberry Vale | TQ1 1JA TQ1 1JF |
| Warbro Road | TQ1 3QZ TQ1 3RB TQ1 3RG |
| Waterloo Road | TQ1 3AY |
| Wellesley Road | TQ1 3BS |
| Wellington Place | TQ1 3AZ |
| Wellington Road | TQ1 3BA |
| Willoughby Road | TQ1 1JX |
| Windermere Road | TQ1 3RF |
| Windsor Close | TQ1 1TA |
| Windsor Road | TQ1 1SP TQ1 1SR TQ1 1SS TQ1 1ST TQ1 1SU TQ1 1SX TQ1 1SY TQ1 1SZ TQ1 1TB TQ1 1TD |
| Woodville Road | TQ1 1LP TQ1 1LT |
Property price trends in Ellacombe
According to the latest Land Registry data, the average home in Ellacombe sold for £223,307 in 2026. That figure comes from a substantial record of 5,148 sales logged over the past 31 years.
Prices have continued to climb over the last three years. Compared with 2023, when the typical sale came in around £204,539, that's a rise of roughly 9.2%.
Looking back five years, average prices are up about 14.9% since 2021, a gain of around £29,007 in cash terms.
Zoom out to the past decade for the fuller picture. Back in 2016, homes here averaged £151,928, so the typical sold price has climbed about 47% since then, roughly 3.9% a year. Stretch the view to fifteen years and that annual pace eases back to about 3.5%.
Frequently asked questions about Ellacombe
What is the average price for a property for sale in Ellacombe?
The average price for a property for sale in Ellacombe is £204,073. This amount is 23% lower than the average price in Torquay. There are 3,309 property listings for sale in Ellacombe.
What streets have the most expensive properties for sale in Ellacombe?
The streets with the most expensive properties for sale in Ellacombe are Windsor Close at an average of £475,000, Quinta Road at an average of £343,500 and Reddenhill Road at an average of £340,000.
What streets have the most affordable properties for sale in Ellacombe?
The streets with the most affordable properties for sale in Ellacombe are Market Street at an average of £71,875, Carlton Mews at an average of £85,000 and Queen Street at an average of £112,000.
Which train stations are available in or near Ellacombe?
Some of the train stations available in or near Ellacombe are Torre, Torquay and Paignton.
Property Price Paid in Ellacombe by Year
The average sold property price by year was:
| Year | Average Sold Price | Price Change |
Sold Properties
|
|---|---|---|---|
| 2026 | £223,307 | 7% |
13 Properties |
| 2025 | £206,727 | 4% |
103 Properties |
| 2024 | £198,588 | -3% |
105 Properties |
| 2023 | £204,539 | -1% |
113 Properties |
| 2022 | £205,671 | 6% |
166 Properties |
| 2021 | £194,300 | 14% |
190 Properties |
| 2020 | £166,664 | 3% |
115 Properties |
| 2019 | £161,866 | 4% |
146 Properties |
| 2018 | £155,531 | 6% |
140 Properties |
| 2017 | £146,944 | -3% |
153 Properties |
Property Price per Property Type in Ellacombe
Here you can find historic sold price data in order to help with your property search.
The average Property Paid Price for specific property types in the last three years are:
| Property Type | Average Sold Price | Sold Properties |
|---|---|---|
| Semi Detached House | £310,090.00 | 22 Semi Detached Houses |
| Detached House | £385,262.00 | 11 Detached Houses |
| Terraced House | £213,201.00 | 227 Terraced Houses |
| Flat | £117,620.00 | 74 Flats |
