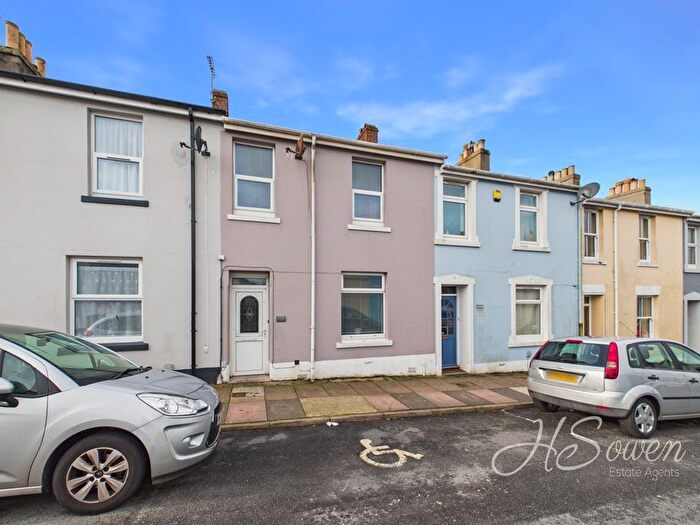
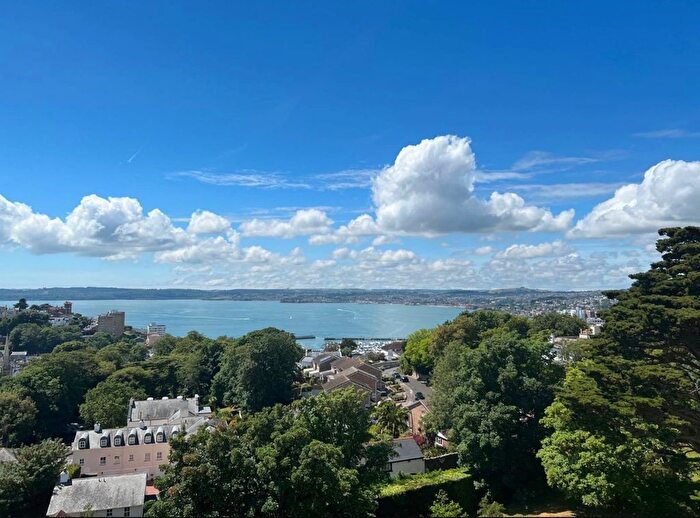
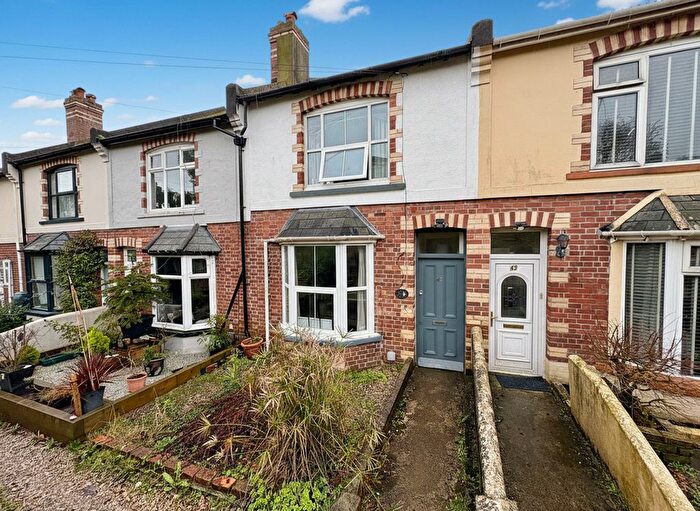
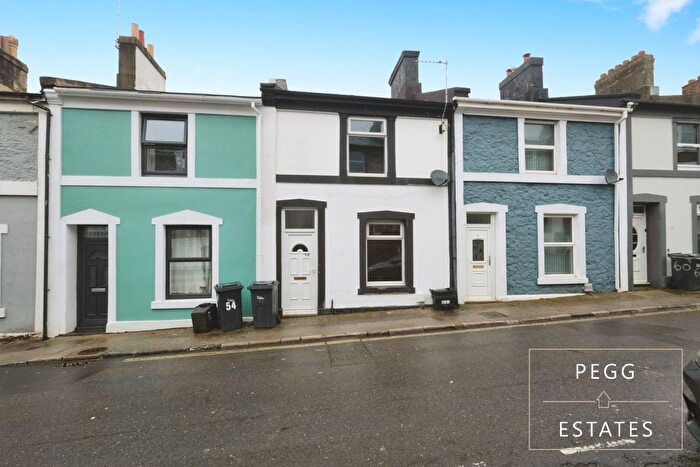
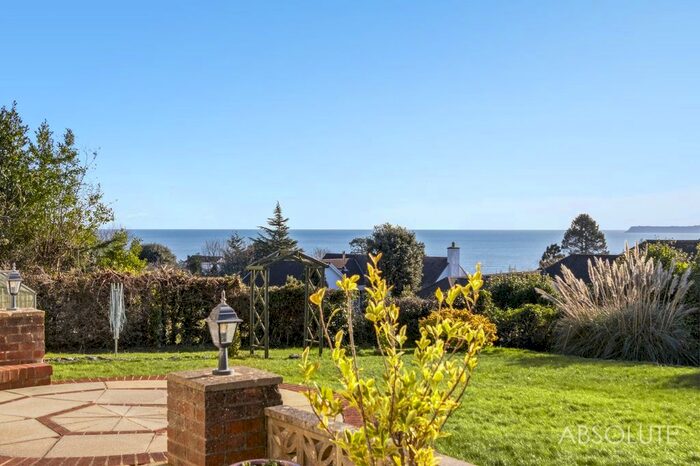
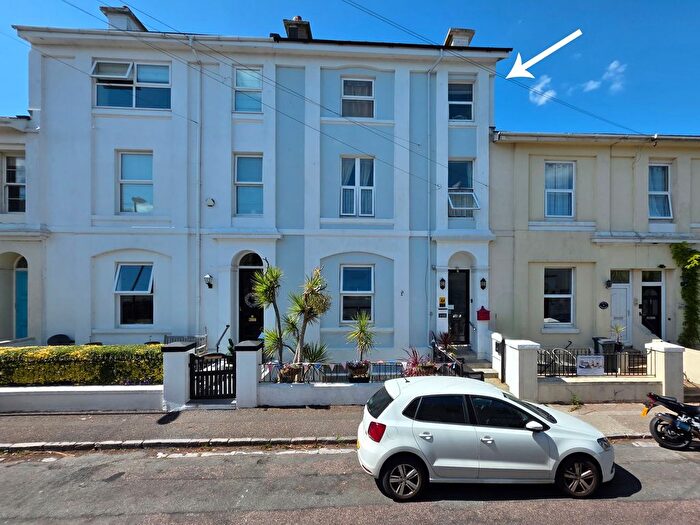
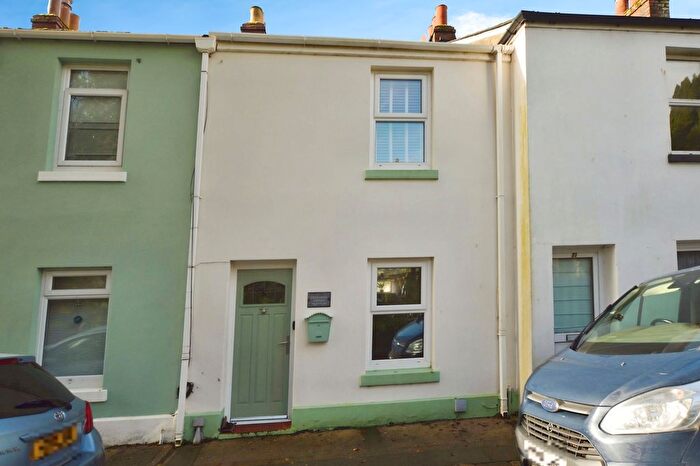
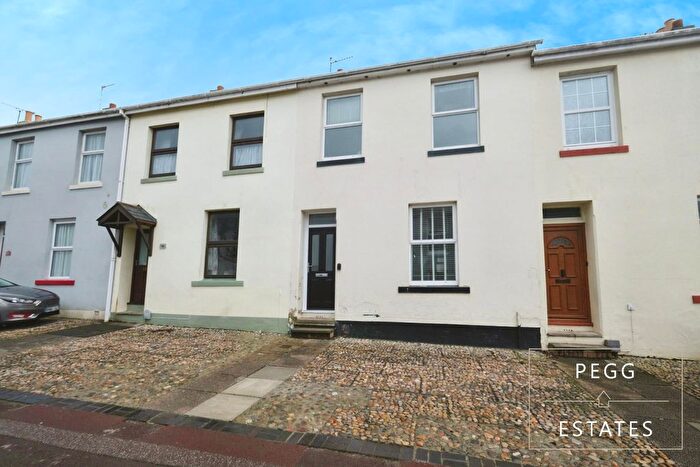
Houses for sale & to rent in Torquay, Torbay
House Prices in Torquay
Properties in Torquay have an average house price of £266,949.00 and had 2,859 Property Transactions within the last 3 years.¹
Torquay is an area in Torbay with 29,450 households², where the most expensive property was sold for £3,110,000.00.
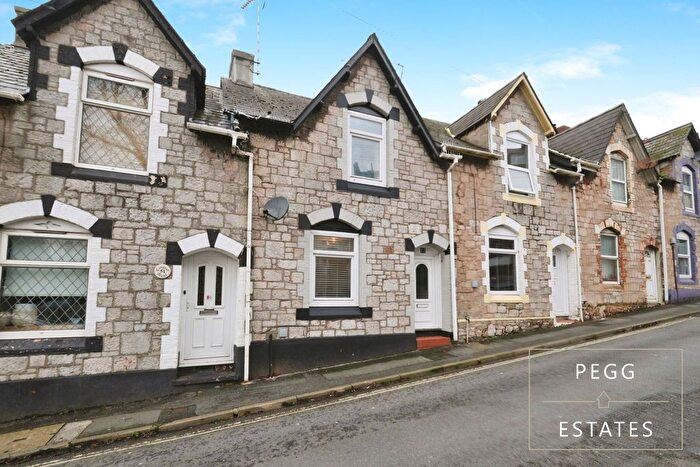
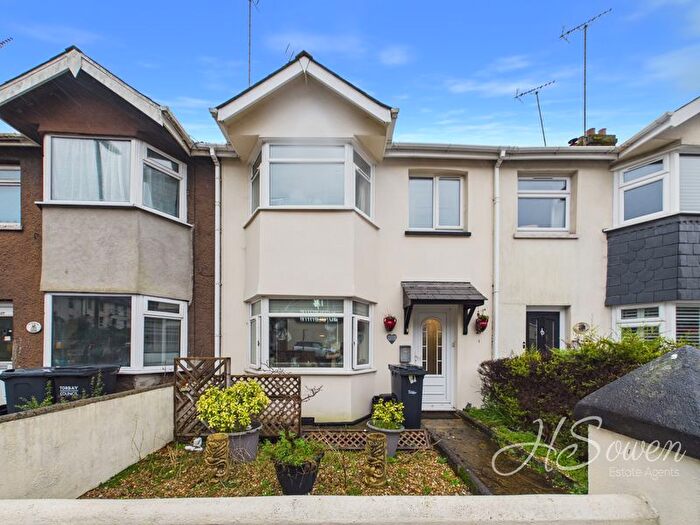
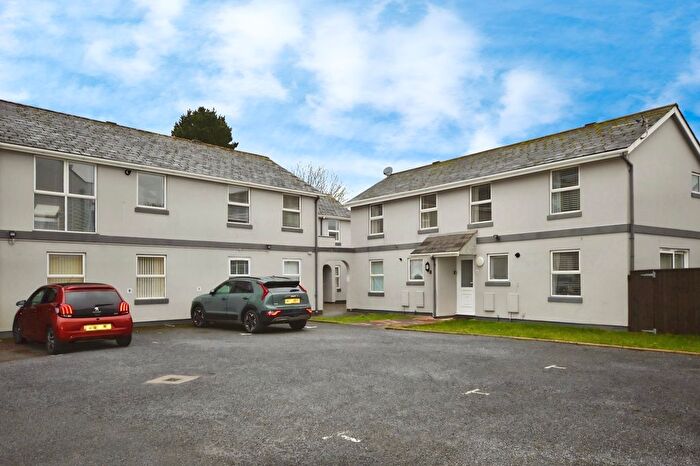
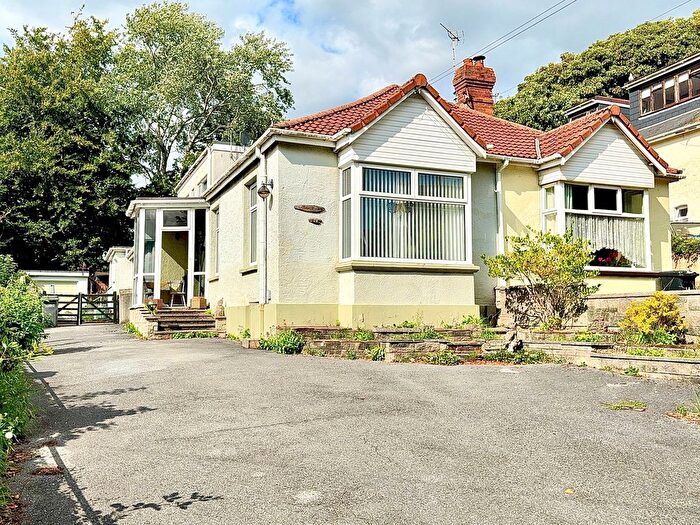
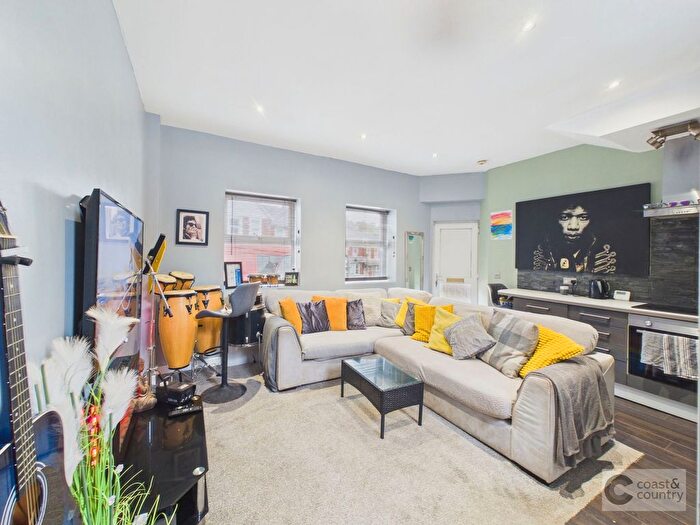
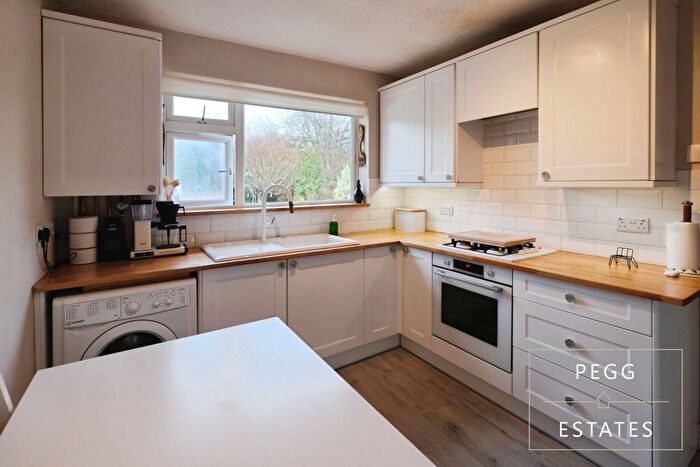
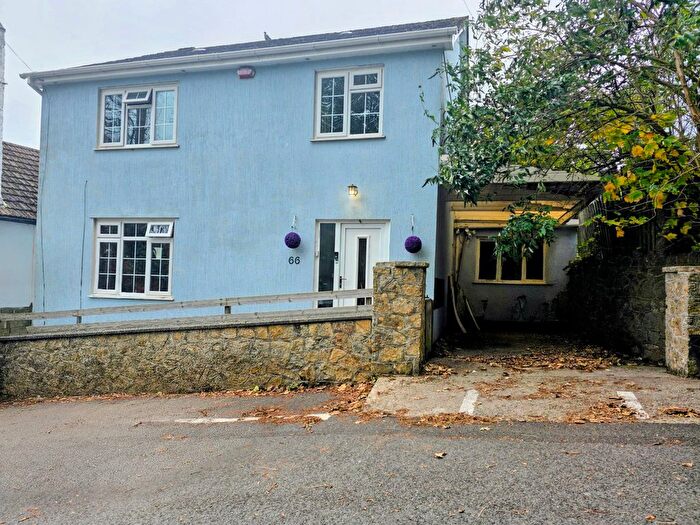
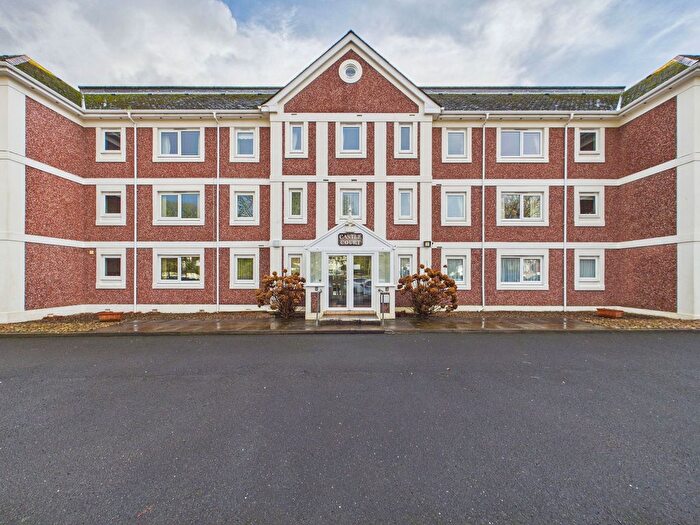
Properties for sale in Torquay
Neighbourhoods in Torquay
Navigate through our locations to find the location of your next house in Torquay, Torbay for sale or to rent.
Transport in Torquay
Please see below transportation links in this area:
- FAQ
- Price Paid By Year
- Property Type Price
Frequently asked questions about Torquay
What is the average price for a property for sale in Torquay?
The average price for a property for sale in Torquay is £266,949. This amount is 3% lower than the average price in Torbay. There are more than 10,000 property listings for sale in Torquay.
What locations have the most expensive properties for sale in Torquay?
The locations with the most expensive properties for sale in Torquay are Shiphay at an average of £390,625, Wellswood at an average of £341,148 and Cockington-with-chelston at an average of £309,893.
What locations have the most affordable properties for sale in Torquay?
The locations with the most affordable properties for sale in Torquay are Tormohun at an average of £198,118, Ellacombe at an average of £203,464 and Barton with Watcombe at an average of £242,043.
Which train stations are available in or near Torquay?
Some of the train stations available in or near Torquay are Torre, Torquay and Paignton.
Property Price Paid in Torquay by Year
The average sold property price by year was:
| Year | Average Sold Price | Price Change |
Sold Properties
|
|---|---|---|---|
| 2025 | £254,905 | -5% |
841 Properties |
| 2024 | £267,303 | -4% |
1,033 Properties |
| 2023 | £276,860 | 3% |
985 Properties |
| 2022 | £268,582 | 3% |
1,439 Properties |
| 2021 | £259,570 | 9% |
1,812 Properties |
| 2020 | £236,623 | 6% |
1,113 Properties |
| 2019 | £222,660 | 5% |
1,371 Properties |
| 2018 | £211,658 | -1% |
1,491 Properties |
| 2017 | £213,490 | 5% |
1,553 Properties |
| 2016 | £203,193 | 2% |
1,480 Properties |
| 2015 | £199,580 | 9% |
1,418 Properties |
| 2014 | £181,981 | 0,2% |
1,330 Properties |
| 2013 | £181,696 | -1% |
1,173 Properties |
| 2012 | £183,661 | 0,2% |
994 Properties |
| 2011 | £183,365 | -4% |
935 Properties |
| 2010 | £190,117 | 5% |
924 Properties |
| 2009 | £179,699 | -7% |
952 Properties |
| 2008 | £192,753 | -2% |
977 Properties |
| 2007 | £196,415 | 8% |
1,992 Properties |
| 2006 | £181,148 | 4% |
2,025 Properties |
| 2005 | £173,346 | 3% |
1,486 Properties |
| 2004 | £167,704 | 17% |
1,992 Properties |
| 2003 | £138,439 | 16% |
2,115 Properties |
| 2002 | £116,975 | 17% |
2,461 Properties |
| 2001 | £97,424 | 12% |
2,271 Properties |
| 2000 | £86,155 | 13% |
2,116 Properties |
| 1999 | £74,906 | 8% |
2,092 Properties |
| 1998 | £68,946 | 2% |
1,861 Properties |
| 1997 | £67,477 | 12% |
1,821 Properties |
| 1996 | £59,322 | 1% |
1,538 Properties |
| 1995 | £58,895 | - |
1,239 Properties |
Property Price per Property Type in Torquay
Here you can find historic sold price data in order to help with your property search.
The average Property Paid Price for specific property types in the last three years are:
| Property Type | Average Sold Price | Sold Properties |
|---|---|---|
| Semi Detached House | £298,871.00 | 485 Semi Detached Houses |
| Terraced House | £232,010.00 | 990 Terraced Houses |
| Detached House | £515,346.00 | 435 Detached Houses |
| Flat | £173,224.00 | 949 Flats |

