Houses for sale & to rent in St Marychurch, Torquay
House Prices in St Marychurch
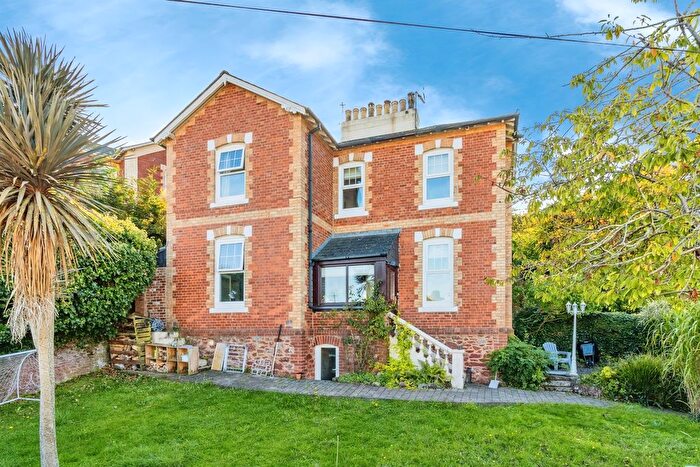
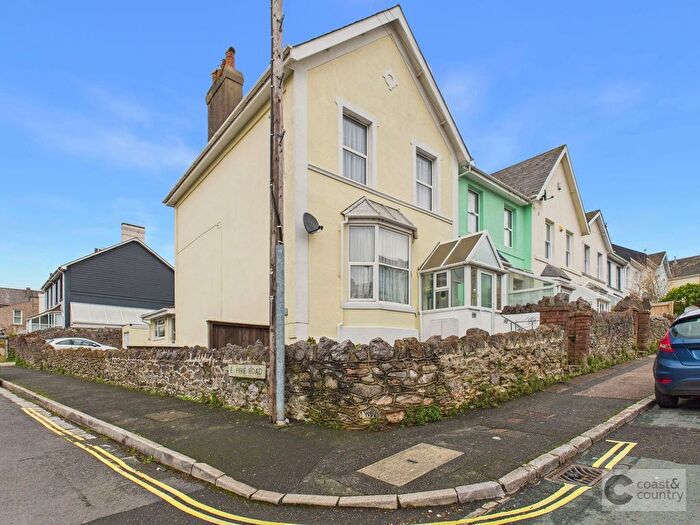
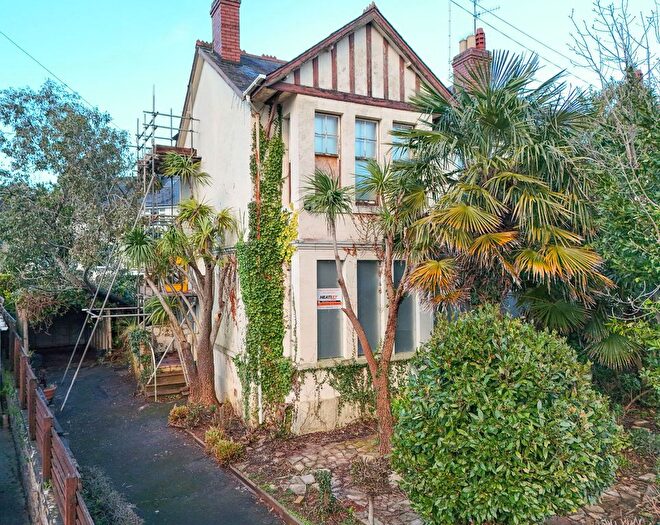
Properties in St Marychurch have an average house price of £253,620.00 and had 529 Property Transactions within the last 3 years¹.
St Marychurch is an area in Torquay, Torbay with 5,089 households², where the most expensive property was sold for £3,110,000.00.
Properties for sale in St Marychurch
Roads and Postcodes in St Marychurch
Navigate through our locations to find the location of your next house in St Marychurch, Torquay for sale or to rent.
| Streets | Postcodes |
|---|---|
| Ashley Priors Lane | TQ1 4SE |
| Aveland Road | TQ1 3PT |
| Babbacombe Business Park | TQ1 3UP |
| Babbacombe Downs Road | TQ1 3LE TQ1 3LF TQ1 3LP TQ1 3LU TQ1 3LH TQ1 3LN TQ1 3LQ |
| Babbacombe Road | TQ1 3JR TQ1 3QS TQ1 3SB TQ1 3SF TQ1 3SJ TQ1 3SN TQ1 3SR TQ1 3SU TQ1 3SW TQ1 3SX TQ1 3SY TQ1 3SZ TQ1 3TJ TQ1 3UR TQ1 3SS TQ1 3TA |
| Barewell Close | TQ1 4PB |
| Barewell Road | TQ1 4PA |
| Beach Road | TQ1 3LX TQ1 3LY |
| Bedford Road | TQ1 3LJ |
| Blake Close | TQ1 4UJ |
| Blythswood Crescent | TQ1 3HJ |
| Borough Road | TQ1 4QW |
| Bradley Park Road | TQ1 4RD |
| Branscombe Close | TQ1 3UQ |
| Brim Hill | TQ1 4TR |
| Budleigh Close | TQ1 3UE |
| Byron Road | TQ1 4PH |
| Cambridge Road | TQ1 4QN |
| Cary Avenue | TQ1 3NQ TQ1 3QT |
| Cary Castle Drive | TQ1 4QZ |
| Cary Park | TQ1 3NE TQ1 3NG TQ1 3NH TQ1 3NL |
| Cedar Court Road | TQ1 3HH |
| Charmouth Close | TQ1 3UD |
| Chatto Road | TQ1 4HU TQ1 4HY TQ1 4FQ |
| Chatto Way | TQ1 4UE |
| Chilcote Close | TQ1 4QT |
| Church Road | TQ1 4QY |
| Churchway | TQ1 3NS |
| Claddon Lane | TQ1 4TB |
| Cliffside Road | TQ1 3LB |
| Compton Place | TQ1 4QP |
| Coombe Lane | TQ2 8DY TQ2 8EA |
| Cuthbert Close | TQ1 4RU |
| Daison Crescent | TQ1 4LJ |
| Derwent Road | TQ1 3QL |
| Devons Road | TQ1 3PR |
| Empire Road | TQ1 4LA TQ1 4LB TQ1 4LE TQ1 4LF |
| Enfield Cottages | TQ1 3LT |
| Enfield Road | TQ1 3RS |
| First Avenue | TQ1 4JB |
| Fore Street | TQ1 4LX TQ1 4LY TQ1 4NE TQ1 4PR TQ1 4PU TQ1 4PZ TQ2 8BD TQ1 4NA TQ1 4PP TQ1 4PY TQ1 4QX |
| Forest Road | TQ1 4JX TQ1 4JY TQ1 4JZ |
| Fortune Way | TQ1 3PG TQ1 3PF |
| Foxlands Walk | TQ1 4NL |
| Furrough Cross | TQ1 3SE |
| Gabwell Hill | TQ1 4TW |
| Grasmere Close | TQ2 8SB |
| Greenway Lane | TQ1 4NX TQ1 4TZ |
| Greenway Road | TQ1 4NQ |
| Greenway Terrace | TQ1 4NN |
| Greys Cottages | TQ1 3LR |
| Greystone Way | TQ1 3PN |
| Guestland Road | TQ1 3NN |
| Hampton Avenue | TQ1 3LA |
| Hampton Close | TQ1 4PS |
| Hampton Lane | TQ1 4PT |
| Happaway Road | TQ2 8ED |
| Hartop Road | TQ1 4QH TQ1 4QJ TQ1 4QQ |
| Havelock Road | TQ1 4RG TQ1 4RQ |
| Haytor Road | TQ1 4LP |
| Higher Downs Road | TQ1 3LD |
| Hill Park Road | TQ1 4LD |
| Hilly Gardens Road | TQ1 4QL |
| Homefield Cottages | TQ1 3LS |
| Homestead Road | TQ1 4JL |
| Homestead Terrace | TQ1 4JA |
| Langstone Close | TQ1 3TX TQ1 3TY |
| Lily Vale Mews | TQ1 4LZ |
| Lindridge Road | TQ1 3SD |
| Livvy Dean Mews | TQ1 4FZ |
| Locks Close | TQ1 3TU |
| Locks Hill | TQ1 3TT |
| Locksley Close | TQ1 3HQ |
| Longpark Hill | TQ1 4TG TQ1 4TL |
| Lummaton Place | TQ2 8EB |
| Lyme View Close | TQ1 3UL |
| Lyme View Road | TQ1 3TR TQ1 3TS TQ1 3UA TQ1 3UB TQ1 3UF TQ1 3UJ |
| Lymington Road | TQ1 4AS |
| Main Avenue | TQ1 4HZ TQ1 4JG TQ1 4JQ |
| Manor Road | TQ1 3JS TQ1 3JU TQ1 3JX |
| Marnham Road | TQ1 3QW |
| Meyrick Road | TQ1 3QX |
| Orestone Drive | TQ1 4TX |
| Palermo Road | TQ1 3NW |
| Park Crescent | TQ1 4FW |
| Park Road | TQ1 4QR TQ1 4QS |
| Perinville Road | TQ1 3NZ TQ1 3PA TQ1 3PB TQ1 3PD TQ1 3ST |
| Petitor Mews | TQ1 4QU |
| Petitor Road | TQ1 4GE TQ1 4QA TQ1 4QD TQ1 4QE TQ1 4QF TQ1 4FS |
| Plainmoor Road | TQ1 3PY |
| Portland Road | TQ1 3LL TQ1 3NB |
| Princes Street | TQ1 3LW |
| Priory Road | TQ1 4NH TQ1 4NY |
| Redcliffe Road | TQ1 4QG |
| Reddenhill Road | TQ1 3NT TQ1 3NY TQ1 3RR TQ1 3RT |
| Redgate Close | TQ1 3UG |
| Rock House Lane | TQ1 4SU TQ1 4SX |
| Rowley Road | TQ1 4PW TQ1 4PX TQ1 4FR |
| Seaton Close | TQ1 3UH |
| Second Avenue | TQ1 4JD TQ1 4JE |
| Shelley Avenue | TQ1 4PF TQ1 4PG |
| Shirburn Road | TQ1 3JH TQ1 3JL TQ1 4HR |
| Sladnor Park Road | TQ1 4TF |
| Sovereign Mews | TQ1 4SP |
| Springfield Road | TQ1 3PZ TQ1 3QA |
| St Albans Lane | TQ1 3QR |
| St Albans Road | TQ1 3LG TQ1 3ND TQ1 3NF TQ1 3NP TQ1 3SL |
| St Annes Road | TQ1 3NR TQ1 3NU TQ1 3NX TQ1 3FA |
| St Catherines Road | TQ1 4NZ |
| St Dominics Close | TQ1 4UN |
| St Edmunds Road | TQ1 3PX TQ1 3QE TQ1 3QG TQ1 3QQ |
| St Georges Crescent | TQ1 3QU |
| St Georges Road | TQ1 3QY |
| St James Place | TQ1 3UY |
| St Margarets Avenue | TQ1 4LL TQ1 4LN TQ1 4LW |
| St Margarets Close | TQ1 4NR TQ1 4FY |
| St Margarets Road | TQ1 4NU TQ1 4NW TQ1 4PJ |
| St Marychurch Road | TQ1 3AB TQ1 3HG TQ1 3HL TQ1 3HP TQ1 3HW TQ1 3HX TQ1 3JP TQ1 3JT TQ1 3PH TQ1 4GF TQ1 3NA TQ1 4NB TQ1 4TY |
| St Marys Mews | TQ1 4NJ |
| St Pauls Crescent | TQ1 3QN |
| St Pauls Road | TQ1 3QB TQ1 3QD TQ1 3QF |
| Stable Lane | TQ1 4SA TQ1 4ST |
| Stanley Road | TQ1 3JJ TQ1 3JZ |
| Steep Hill | TQ1 4TS |
| Stoke Road | TQ1 4TQ |
| Studley Road | TQ1 3JN |
| Teignmouth Road | TQ1 4RP TQ1 4RR TQ1 4RS TQ1 4RT TQ1 4RW TQ1 4RX TQ1 4SB TQ1 4SF TQ1 4SL TQ1 4SQ TQ1 4SW TQ1 4SY TQ1 4SZ TQ1 4TA TQ1 4TH TQ1 4TP TQ1 4TJ |
| Tennyson Close | TQ1 4PQ |
| Third Avenue | TQ1 4JF |
| Trumlands Road | TQ1 4RA TQ1 4RB TQ1 4RE TQ1 4RN |
| Victoria Park Road | TQ1 3QH TQ1 3QJ |
| Walls Hill Road | TQ1 3LZ |
| Warbro Road | TQ1 3PJ TQ1 3PL TQ1 3PP TQ1 3PS TQ1 3PW TQ1 3RE |
| Warwick Close | TQ1 3TH |
| Watcombe Beach Road | TQ1 4SH |
| Watcombe Heights Road | TQ1 4SG |
| Western Road | TQ1 4RH TQ1 4RJ TQ1 4RL |
| Westhill Avenue | TQ1 4LH TQ1 4LQ TQ1 4LR |
| Westhill Avenue Close | TQ1 4LG |
| Westhill Road | TQ1 4LT TQ1 4LU TQ1 4NS TQ1 4NT TQ1 4PD TQ1 4PE |
| Westlands Lane | TQ1 3PE |
| Winnings Way | TQ1 3GZ |
| Winstone Avenue | TQ2 8DZ |
| York Crescent | TQ1 3SH |
| York Road | TQ1 3RZ TQ1 3SG |
| TQ1 3QP TQ1 4GB TQ1 4RZ |
Transport near St Marychurch
- FAQ
- Price Paid By Year
- Property Type Price
Frequently asked questions about St Marychurch
What is the average price for a property for sale in St Marychurch?
The average price for a property for sale in St Marychurch is £253,620. This amount is 5% lower than the average price in Torquay. There are 5,468 property listings for sale in St Marychurch.
What streets have the most expensive properties for sale in St Marychurch?
The streets with the most expensive properties for sale in St Marychurch are Cary Avenue at an average of £3,110,000, Sladnor Park Road at an average of £945,000 and Redcliffe Road at an average of £733,000.
What streets have the most affordable properties for sale in St Marychurch?
The streets with the most affordable properties for sale in St Marychurch are Petitor Mews at an average of £95,000, Plainmoor Road at an average of £120,500 and Manor Road at an average of £125,500.
Which train stations are available in or near St Marychurch?
Some of the train stations available in or near St Marychurch are Torre, Torquay and Paignton.
Property Price Paid in St Marychurch by Year
The average sold property price by year was:
| Year | Average Sold Price | Price Change |
Sold Properties
|
|---|---|---|---|
| 2025 | £240,380 | -5% |
162 Properties |
| 2024 | £253,342 | -5% |
194 Properties |
| 2023 | £266,331 | 8% |
173 Properties |
| 2022 | £245,570 | 0,5% |
259 Properties |
| 2021 | £244,426 | 4% |
357 Properties |
| 2020 | £234,484 | 10% |
216 Properties |
| 2019 | £211,634 | 9% |
230 Properties |
| 2018 | £192,020 | -4% |
267 Properties |
| 2017 | £200,192 | 7% |
269 Properties |
| 2016 | £186,132 | -1% |
292 Properties |
| 2015 | £187,637 | 4% |
272 Properties |
| 2014 | £180,395 | 6% |
248 Properties |
| 2013 | £170,047 | -5% |
181 Properties |
| 2012 | £178,478 | 7% |
185 Properties |
| 2011 | £165,710 | -13% |
181 Properties |
| 2010 | £187,000 | 11% |
160 Properties |
| 2009 | £167,004 | -12% |
158 Properties |
| 2008 | £187,401 | 1% |
155 Properties |
| 2007 | £185,253 | 5% |
355 Properties |
| 2006 | £176,315 | 3% |
350 Properties |
| 2005 | £170,209 | 8% |
258 Properties |
| 2004 | £157,342 | 13% |
316 Properties |
| 2003 | £137,477 | 20% |
379 Properties |
| 2002 | £110,484 | 12% |
381 Properties |
| 2001 | £97,408 | 14% |
402 Properties |
| 2000 | £84,221 | 20% |
375 Properties |
| 1999 | £67,383 | 6% |
332 Properties |
| 1998 | £63,316 | 7% |
293 Properties |
| 1997 | £58,667 | 3% |
348 Properties |
| 1996 | £56,616 | -4% |
290 Properties |
| 1995 | £58,860 | - |
236 Properties |
Property Price per Property Type in St Marychurch
Here you can find historic sold price data in order to help with your property search.
The average Property Paid Price for specific property types in the last three years are:
| Property Type | Average Sold Price | Sold Properties |
|---|---|---|
| Flat | £172,232.00 | 215 Flats |
| Semi Detached House | £303,723.00 | 65 Semi Detached Houses |
| Detached House | £583,825.00 | 43 Detached Houses |
| Terraced House | £253,829.00 | 206 Terraced Houses |

