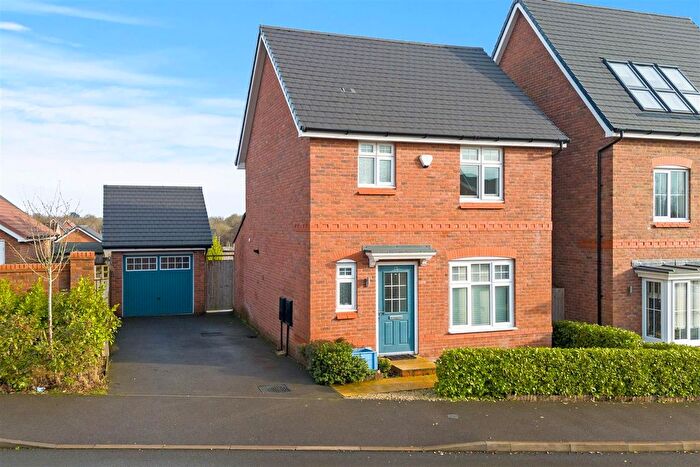
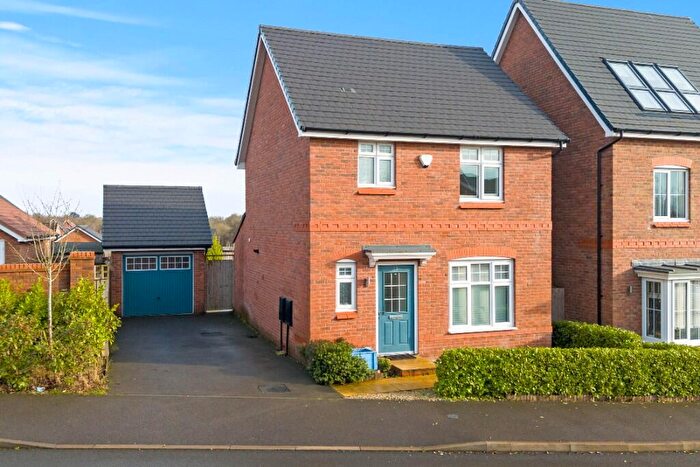
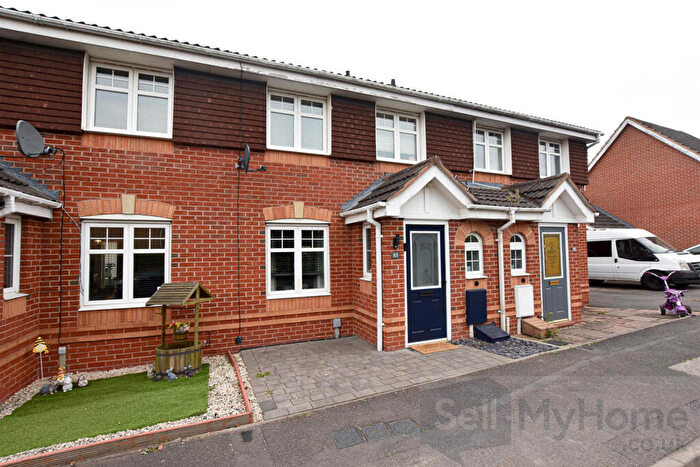
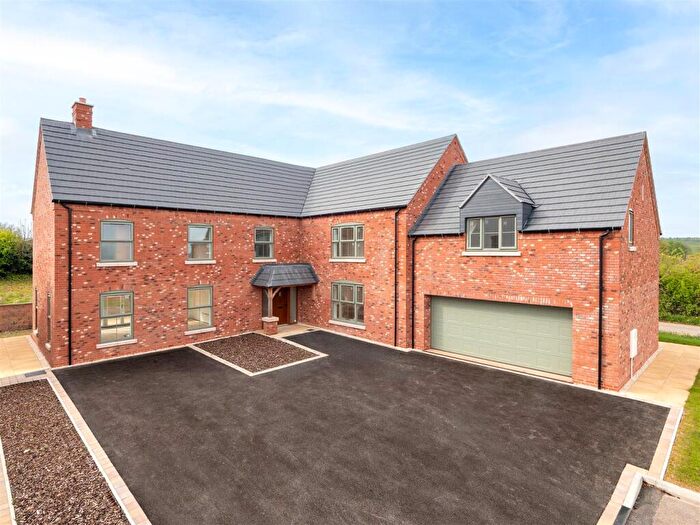
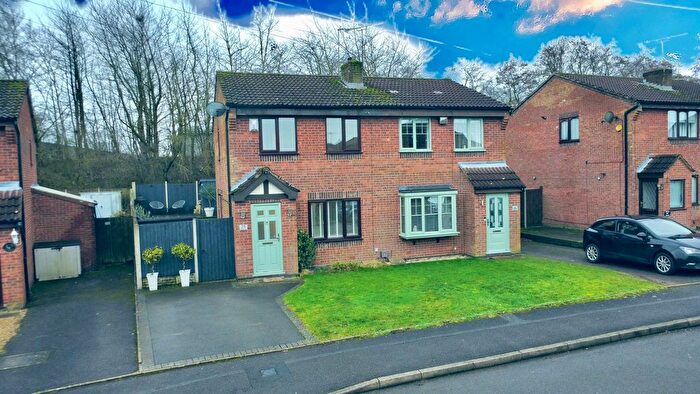
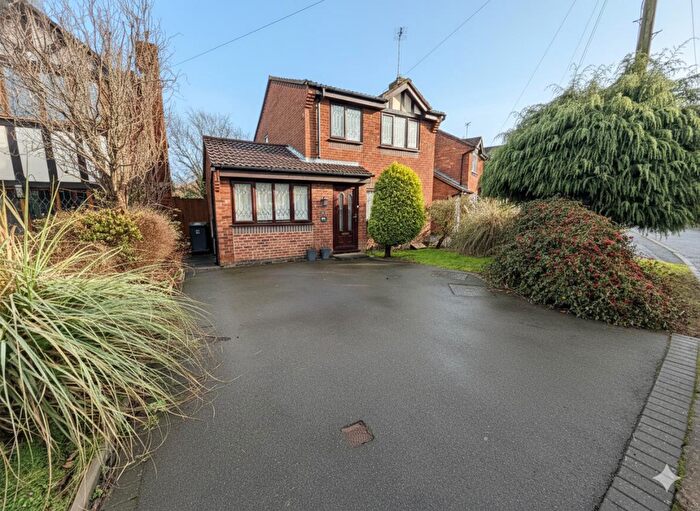
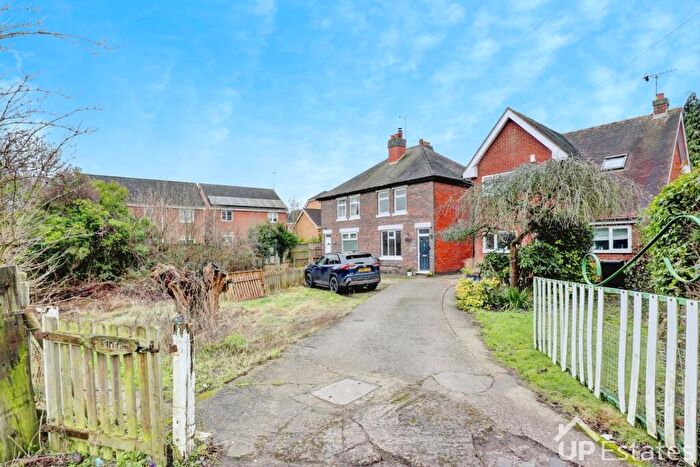
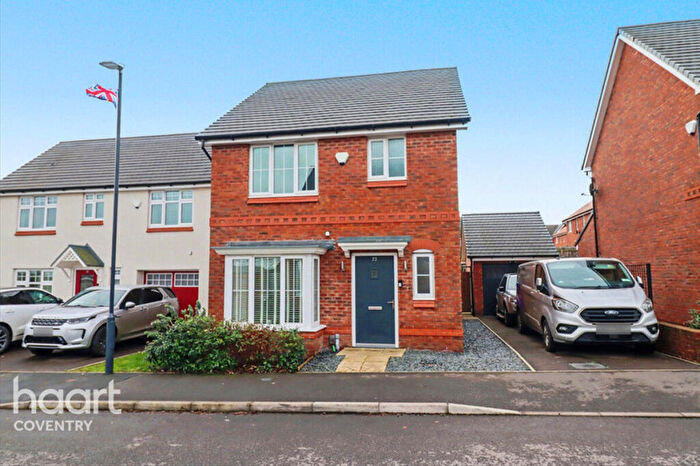
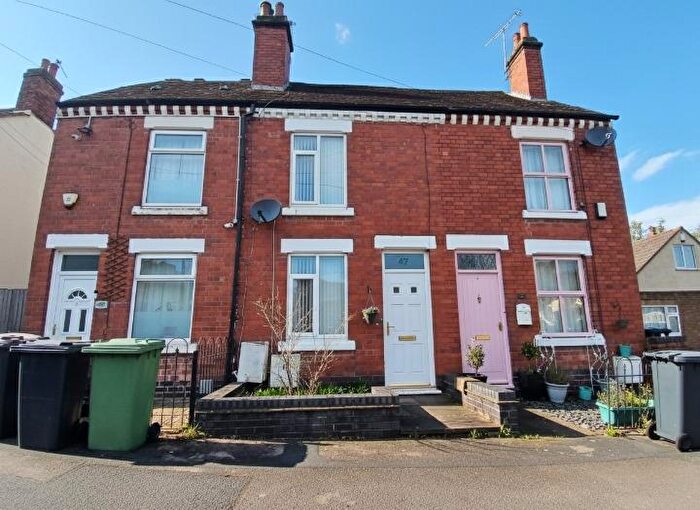
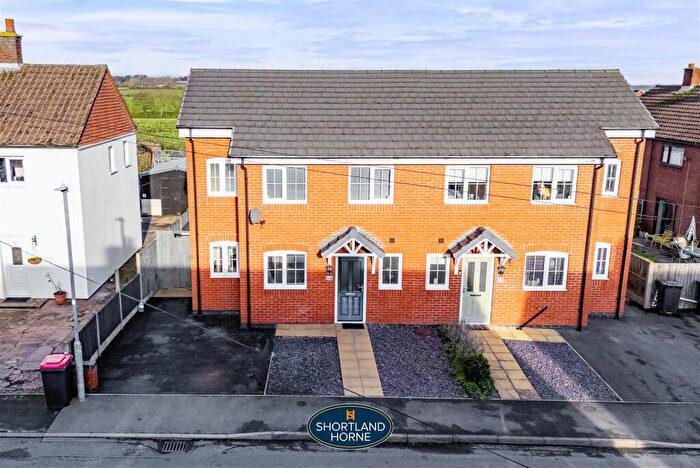
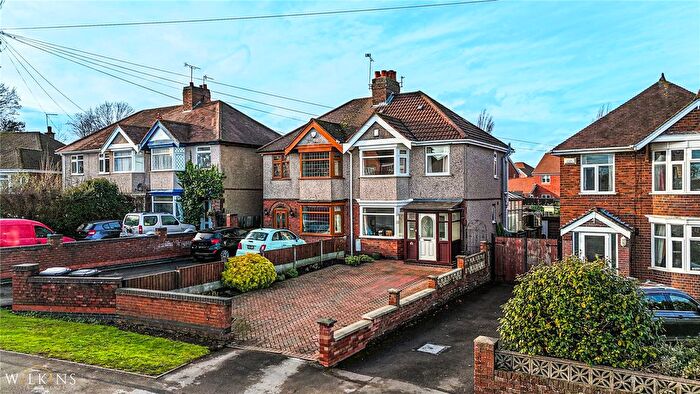
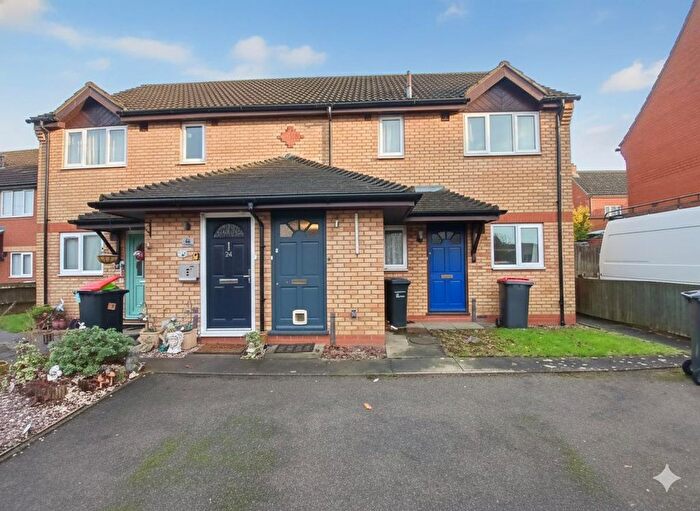
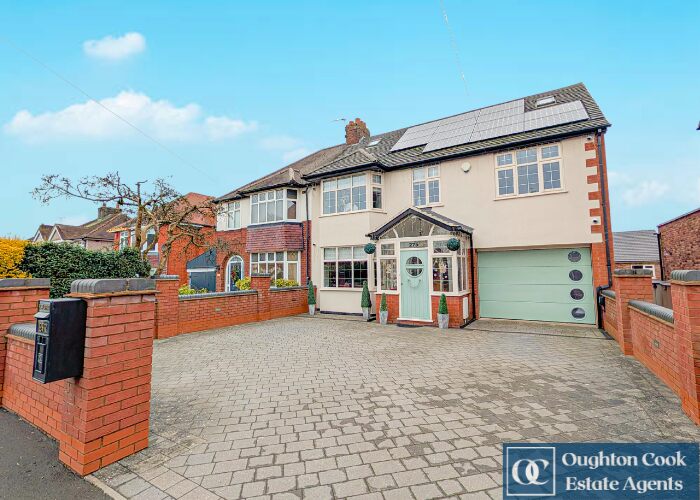
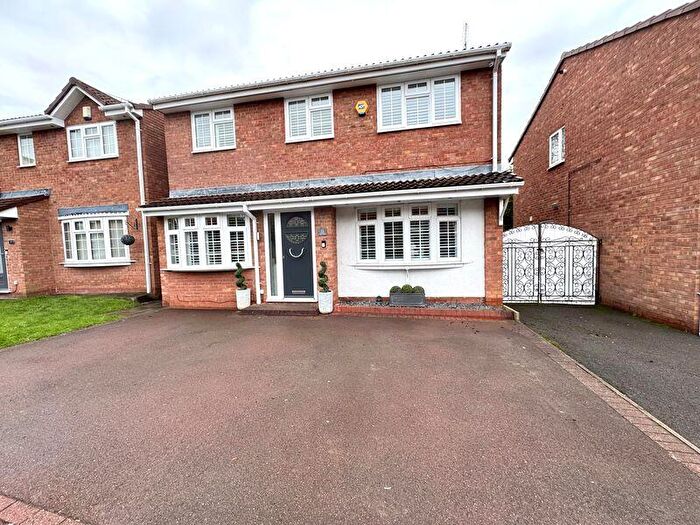
Houses for sale & to rent in Arley And Whitacre, Nuneaton
House Prices in Arley And Whitacre
Properties in Arley And Whitacre have an average house price of £288,787.00 and had 74 Property Transactions within the last 3 years¹.
Arley And Whitacre is an area in Nuneaton, Warwickshire with 966 households², where the most expensive property was sold for £1,300,000.00.
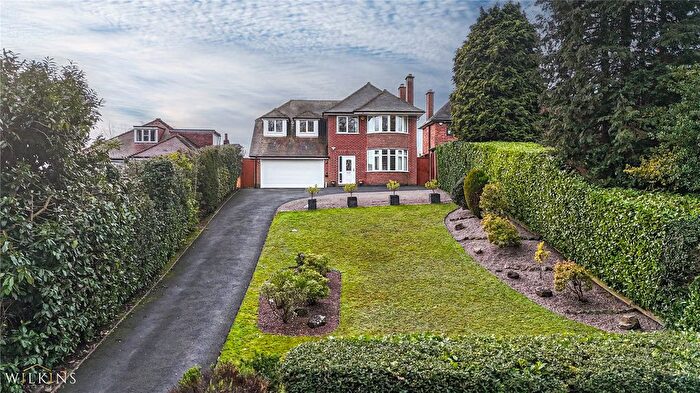
Properties for sale in Arley And Whitacre
Roads and Postcodes in Arley And Whitacre
Navigate through our locations to find the location of your next house in Arley And Whitacre, Nuneaton for sale or to rent.
| Streets | Postcodes |
|---|---|
| Ansley Common | CV10 0PP CV10 0PQ CV10 0PR CV10 0PS CV10 0PX CV10 0PY CV10 0QA CV10 0QD CV10 0QL CV10 0QN CV10 0QJ |
| Ansley Lane | CV10 9ND |
| Arley Lane | CV10 9PH |
| Birchley Heath Road | CV10 0QX CV10 0QY |
| Birmingham Road | CV10 9PG CV10 9PL CV10 9PQ CV10 9PS |
| Bretts Hall Estate | CV10 0PN CV10 0PW |
| Church End | CV10 0QR |
| Cloverfield Cottages | CV10 9PU |
| Coleshill Road | CV10 0PF CV10 0PG CV10 0QG CV10 0GP |
| Cornish Close | CV10 0XU |
| Croft Mead | CV10 9PX |
| Dolly Tub Lane | CV10 9TQ |
| Fletchers Drift Lane | CV10 0NS |
| Galley View | CV10 9GT |
| Goldsby Croft | CV10 9PT |
| Hatters Way | CV10 9TP |
| Izons Croft | CV10 0QW |
| Limes Coppice | CV10 0UT |
| Ludford Close | CV10 9PP |
| Malthouse Close | CV10 9PR |
| Mary Carroll Close | CV10 9SR |
| Nursery Road | CV10 0PT |
| Nuthurst Crescent | CV10 9PJ |
| Oak View | CV10 9SW |
| Oldbury Road | CV10 0RL |
| Park Cottages | CV10 0QP |
| Pipers Lane | CV10 0RH |
| Plough Hill Road | CV10 0PJ |
| Purley Chase Estate | CV10 0RG |
| Ribbon Avenue | CV10 9TJ CV10 9TL |
| St Johns Road | CV10 0PU |
| St Lawrence Road | CV10 9PN CV10 9PW |
| The Burrows | CV10 9GW |
| The Larches | CV10 0GL CV10 0RQ |
| The Rookery | CV10 0RA |
| Thorncliffe Way | CV10 0XT |
| Tunnel Road | CV10 9PF |
| West View | CV10 0PZ |
| Wyatts Way | CV10 9PY |
| CV10 0QT CV10 0QU CV10 0QS |
Transport near Arley And Whitacre
- FAQ
- Price Paid By Year
- Property Type Price
Frequently asked questions about Arley And Whitacre
What is the average price for a property for sale in Arley And Whitacre?
The average price for a property for sale in Arley And Whitacre is £288,787. This amount is 22% higher than the average price in Nuneaton. There are 645 property listings for sale in Arley And Whitacre.
What streets have the most expensive properties for sale in Arley And Whitacre?
The streets with the most expensive properties for sale in Arley And Whitacre are Birchley Heath Road at an average of £513,000, Fletchers Drift Lane at an average of £420,000 and Arley Lane at an average of £287,500.
What streets have the most affordable properties for sale in Arley And Whitacre?
The streets with the most affordable properties for sale in Arley And Whitacre are West View at an average of £97,500, St Johns Road at an average of £170,000 and Coleshill Road at an average of £177,250.
Which train stations are available in or near Arley And Whitacre?
Some of the train stations available in or near Arley And Whitacre are Atherstone, Nuneaton and Bermuda Park.
Property Price Paid in Arley And Whitacre by Year
The average sold property price by year was:
| Year | Average Sold Price | Price Change |
Sold Properties
|
|---|---|---|---|
| 2025 | £230,818 | -6% |
22 Properties |
| 2024 | £244,000 | -45% |
19 Properties |
| 2023 | £353,221 | 31% |
33 Properties |
| 2022 | £244,020 | 9% |
53 Properties |
| 2021 | £220,930 | -3% |
33 Properties |
| 2020 | £226,908 | 13% |
41 Properties |
| 2019 | £197,252 | 20% |
48 Properties |
| 2018 | £158,156 | -5% |
32 Properties |
| 2017 | £166,460 | -28% |
36 Properties |
| 2016 | £212,474 | 23% |
41 Properties |
| 2015 | £164,114 | -2% |
25 Properties |
| 2014 | £167,786 | 23% |
26 Properties |
| 2013 | £128,861 | -3% |
18 Properties |
| 2012 | £132,909 | -6% |
11 Properties |
| 2011 | £140,607 | -1% |
14 Properties |
| 2010 | £141,702 | -4% |
17 Properties |
| 2009 | £147,279 | -3% |
12 Properties |
| 2008 | £151,863 | 8% |
15 Properties |
| 2007 | £139,944 | 18% |
40 Properties |
| 2006 | £115,372 | -37% |
45 Properties |
| 2005 | £158,414 | 28% |
44 Properties |
| 2004 | £114,552 | 9% |
35 Properties |
| 2003 | £104,646 | 24% |
52 Properties |
| 2002 | £79,067 | 28% |
57 Properties |
| 2001 | £56,890 | -40% |
36 Properties |
| 2000 | £79,642 | 33% |
32 Properties |
| 1999 | £53,218 | 2% |
41 Properties |
| 1998 | £52,100 | 15% |
35 Properties |
| 1997 | £44,450 | -3% |
33 Properties |
| 1996 | £45,957 | -23% |
28 Properties |
| 1995 | £56,735 | - |
18 Properties |
Property Price per Property Type in Arley And Whitacre
Here you can find historic sold price data in order to help with your property search.
The average Property Paid Price for specific property types in the last three years are:
| Property Type | Average Sold Price | Sold Properties |
|---|---|---|
| Semi Detached House | £230,319.00 | 28 Semi Detached Houses |
| Detached House | £560,083.00 | 18 Detached Houses |
| Terraced House | £176,394.00 | 25 Terraced Houses |
| Flat | £143,333.00 | 3 Flats |

