
Houses for sale & to rent in CV12 8QP, Newtown Road, Bede, Bedworth
House Prices in CV12 8QP, Newtown Road, Bede
Properties in CV12 8QP have no sales history available within the last 3 years. CV12 8QP is a postcode in Newtown Road located in Bede, an area in Bedworth, Warwickshire, with 6 households².
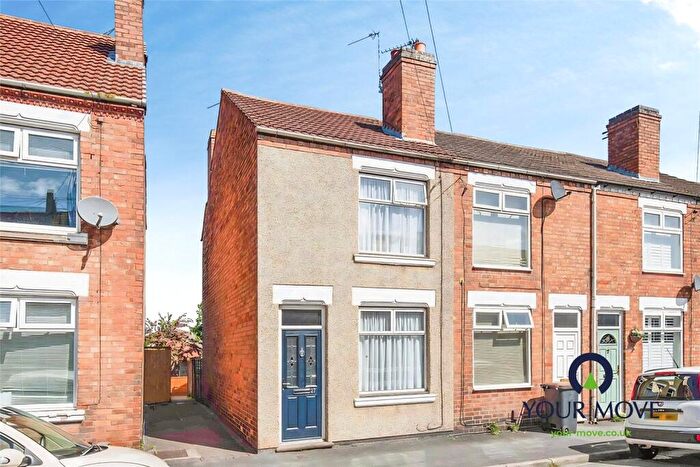
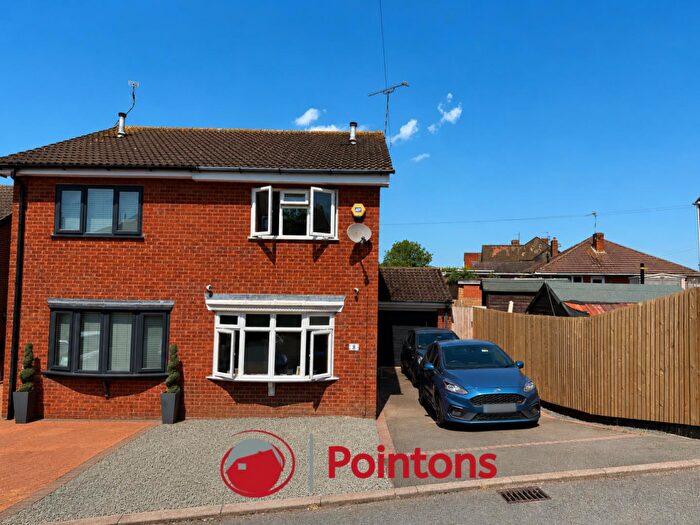
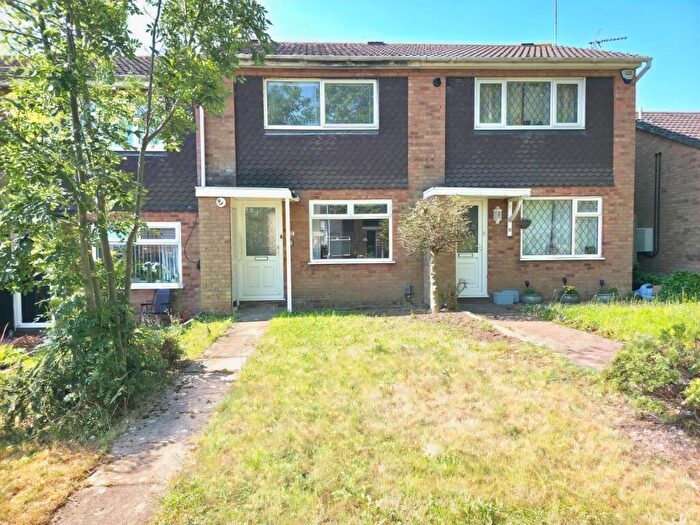
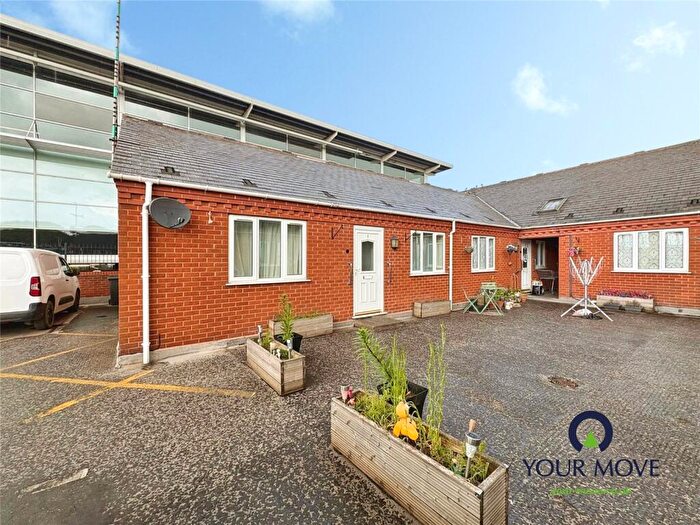
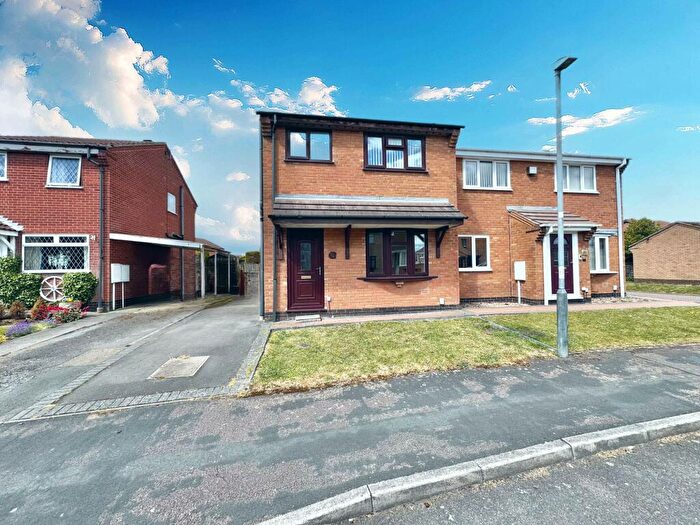
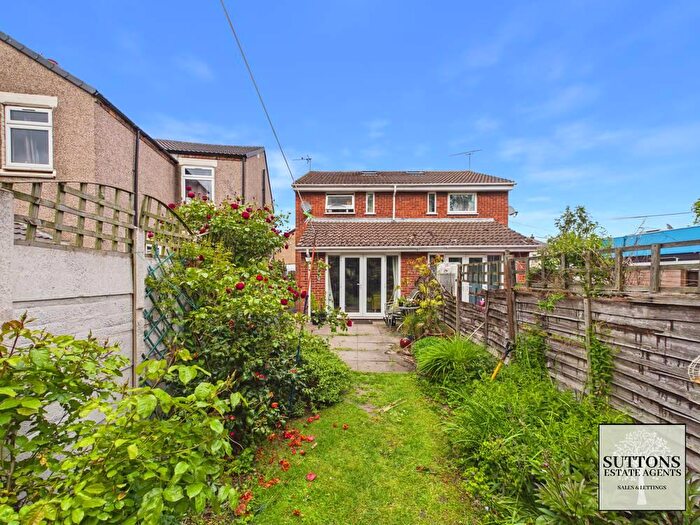
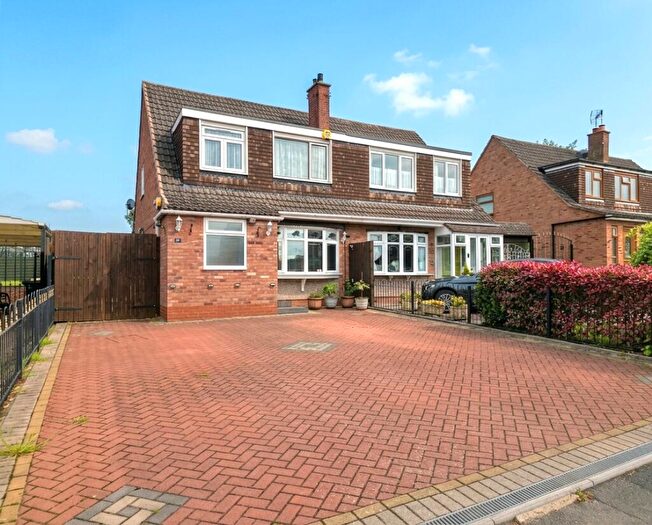
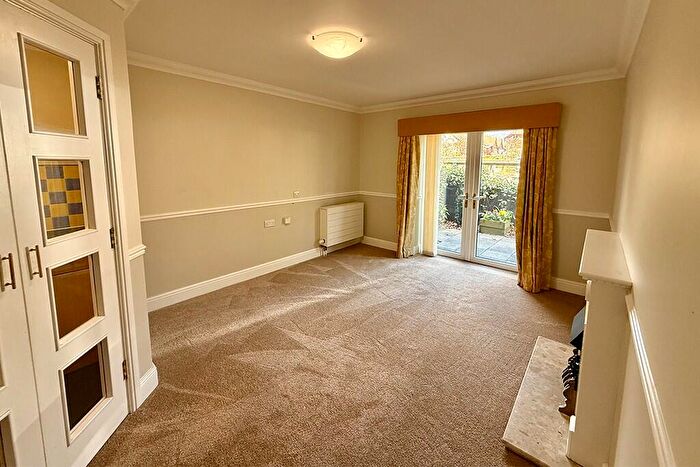
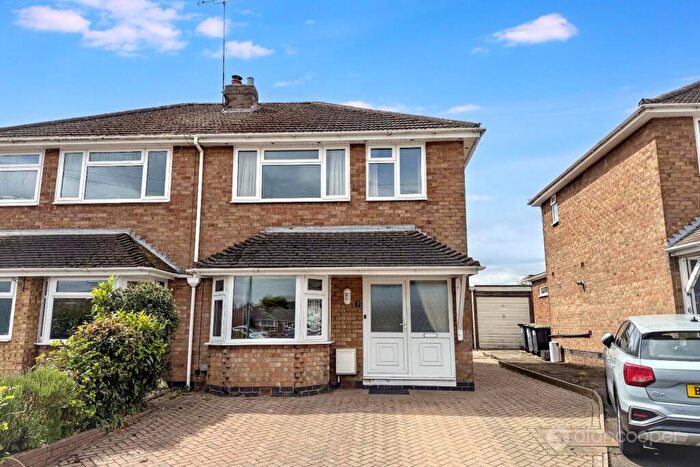
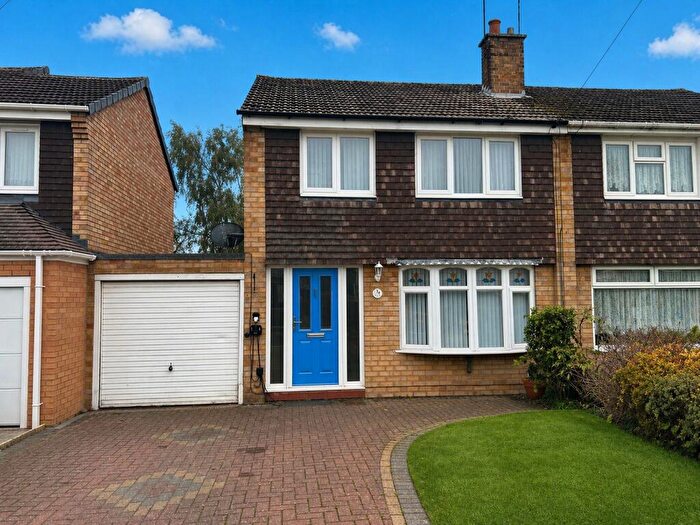
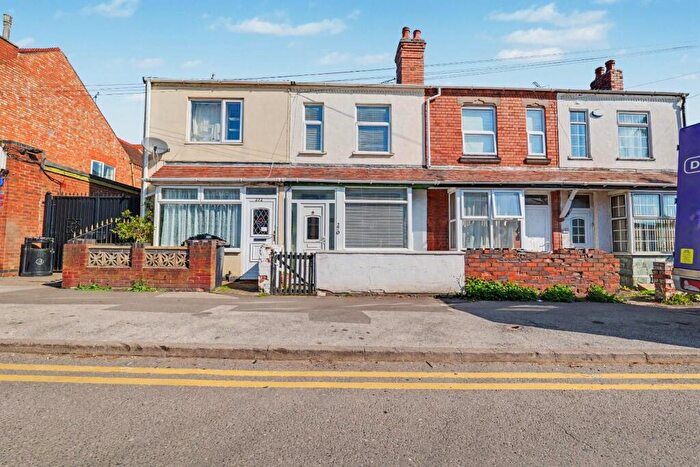
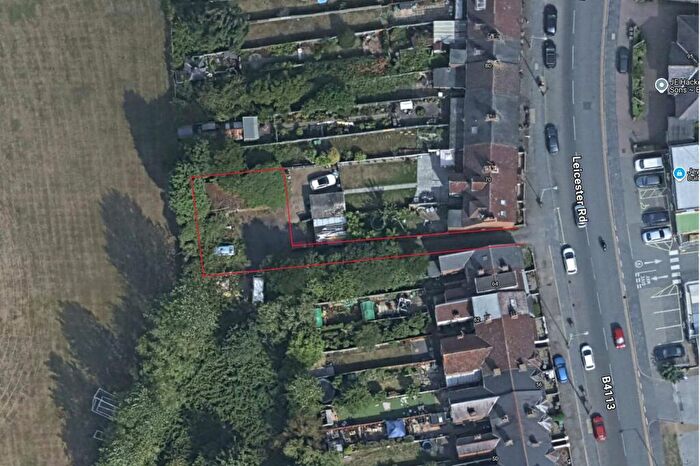
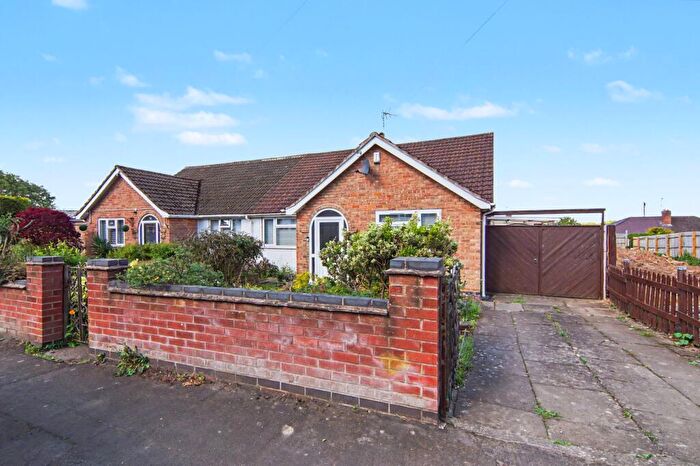
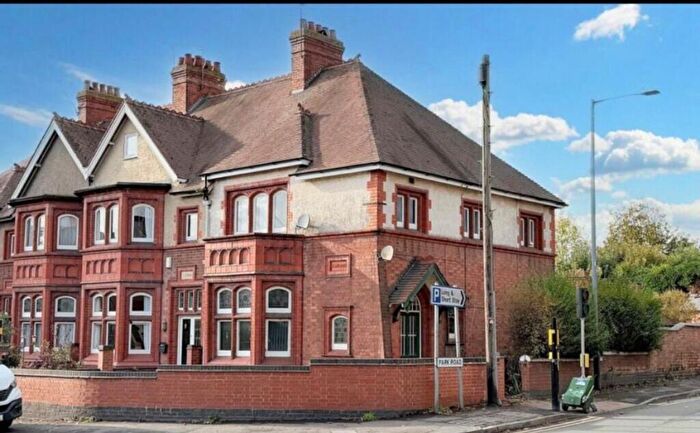
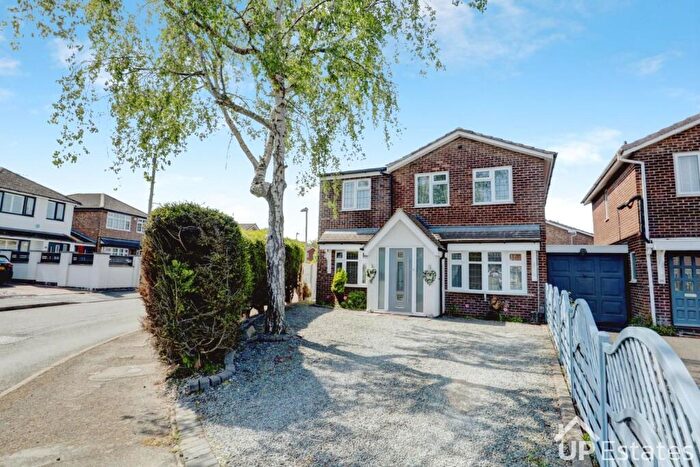
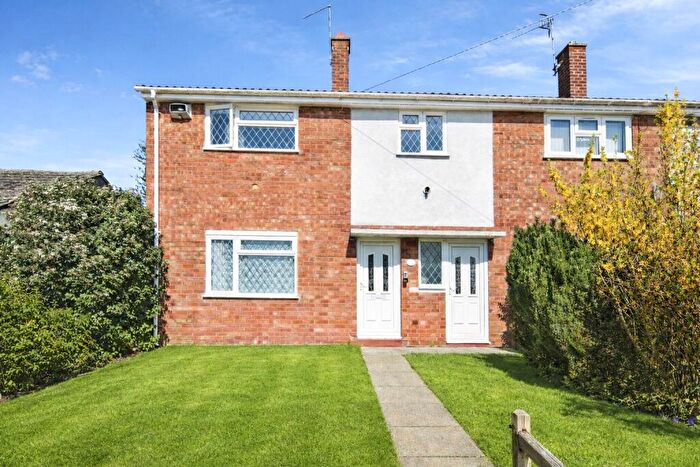
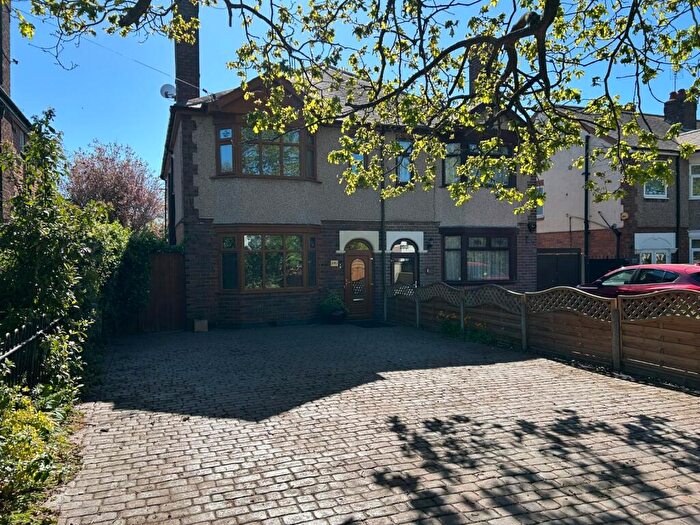
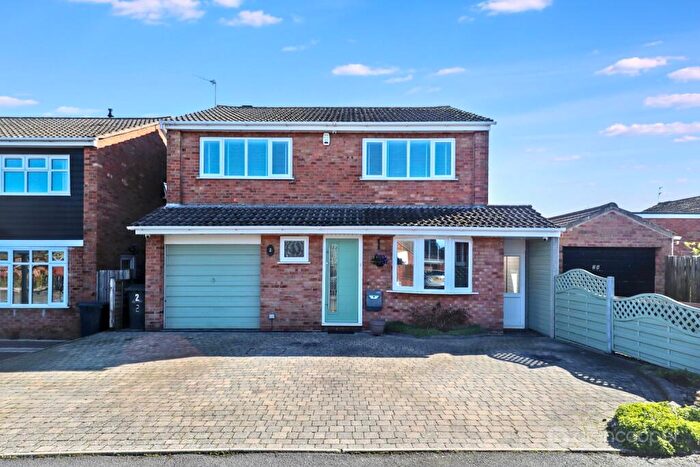
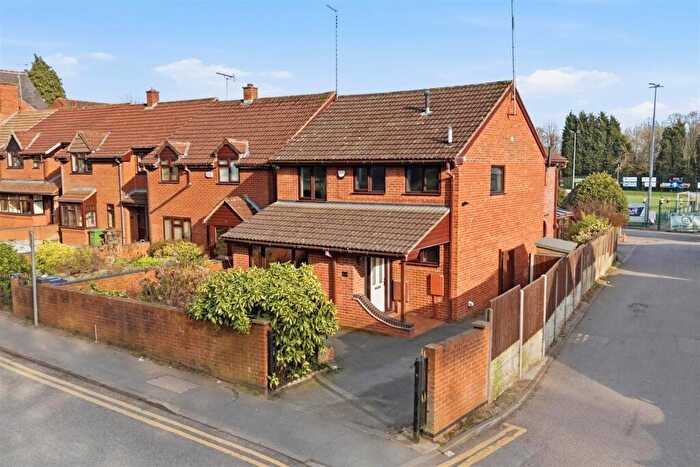
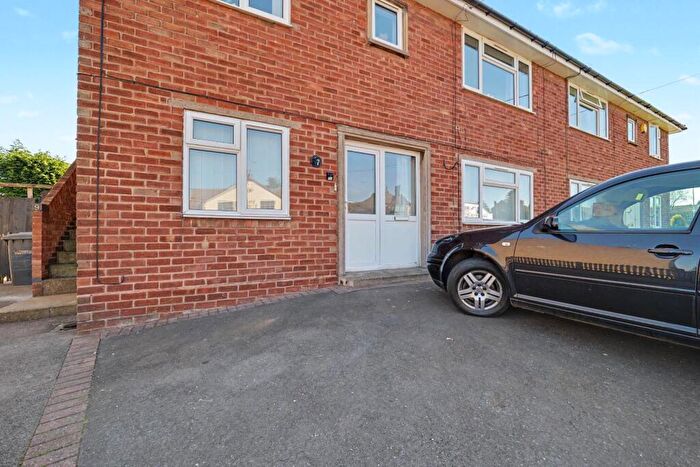
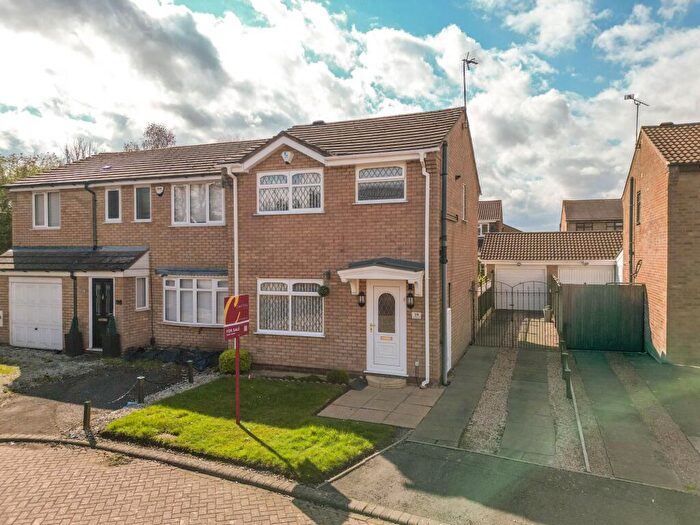
Properties for sale near CV12 8QP, Newtown Road
![]()
If you are looking to sell your house, let it out, or receive a property valuation, an expert can help you.
Click the button below to get started.
Price Paid in Newtown Road, CV12 8QP, Bede
110 Newtown Road, CV12 8QP, Bede Bedworth
Property 110 has been sold 6 times. The last time it was sold was in 18/10/2022 and the sold price was £189,000.00.
This terraced house, sold as a freehold on 18/10/2022, is a 77 sqm mid-terrace house with an EPC rating of C.
| Date | Price | Property Type | Tenure | Classification |
|---|---|---|---|---|
| 18/10/2022 | £189,000.00 | Terraced House | freehold | Established Building |
| 24/05/2016 | £127,000.00 | Terraced House | freehold | Established Building |
| 02/09/2011 | £104,000.00 | Terraced House | freehold | Established Building |
| 20/07/2007 | £113,000.00 | Terraced House | freehold | Established Building |
| 12/07/2002 | £59,000.00 | Terraced House | freehold | Established Building |
| 15/11/1996 | £39,950.00 | Terraced House | freehold | Established Building |
108 Newtown Road, CV12 8QP, Bede Bedworth
Property 108 has been sold 1 time. The last time it was sold was in 22/02/2008 and the sold price was £110,000.00.
This is a Semi Detached House which was sold as a freehold in 22/02/2008
| Date | Price | Property Type | Tenure | Classification |
|---|---|---|---|---|
| 22/02/2008 | £110,000.00 | Semi Detached House | freehold | Established Building |
Postcodes in Newtown Road, Bede
Navigate through other locations in Newtown Road, Bede, Bedworth to see more property listings for sale or to rent.
Transport near CV12 8QP, Newtown Road

House price paid reports for CV12 8QP, Newtown Road
Click on the buttons below to see price paid reports by year or property price:
- Price Paid By Year
Property Price Paid in CV12 8QP, Newtown Road by Year
The average sold property price by year was:
| Year | Average Sold Price | Price Change |
Sold Properties
|
|---|---|---|---|
| 2022 | £189,000 | 33% |
1 Property |
| 2016 | £127,000 | 18% |
1 Property |
| 2011 | £104,000 | -6% |
1 Property |
| 2008 | £110,000 | -3% |
1 Property |
| 2007 | £113,000 | 48% |
1 Property |
| 2002 | £59,000 | 32% |
1 Property |
| 1996 | £39,950 | - |
1 Property |