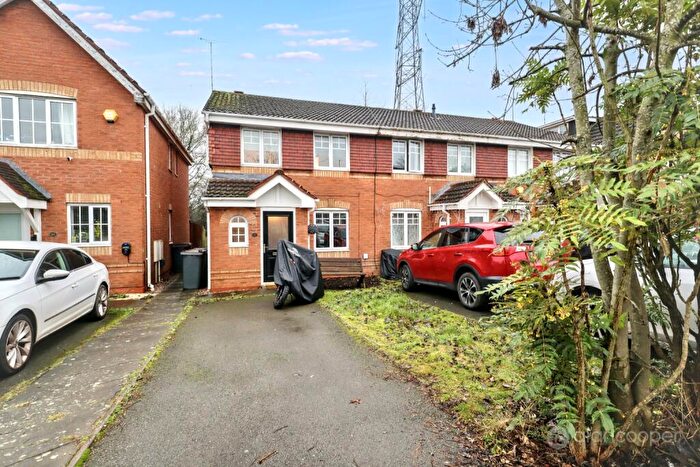
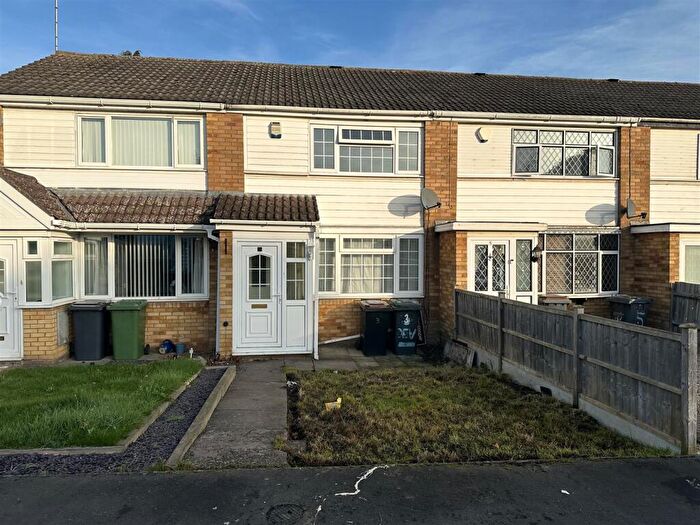
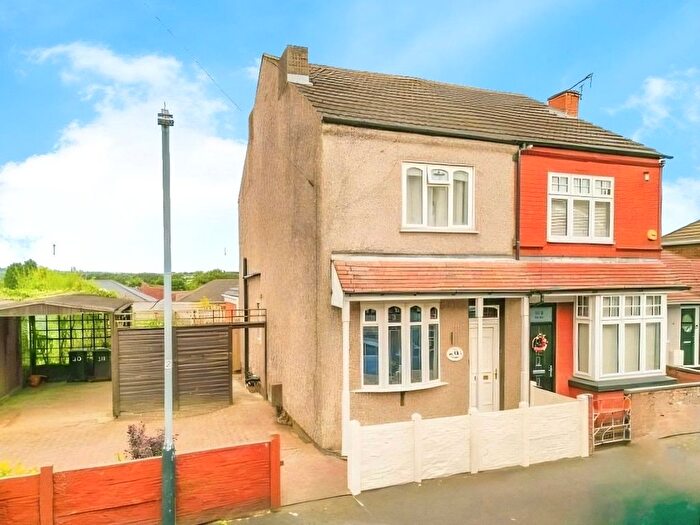
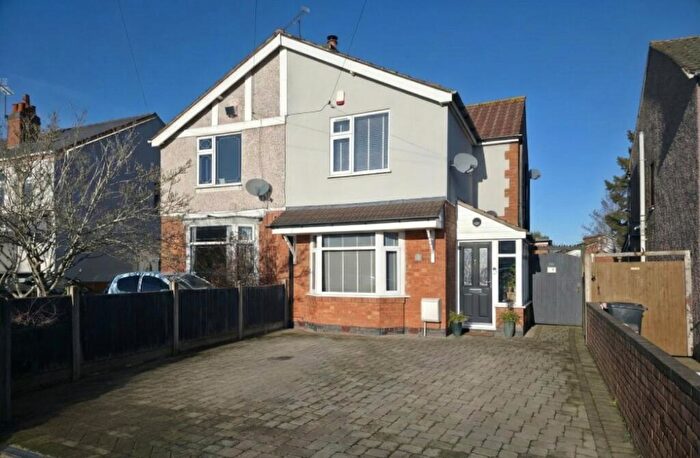
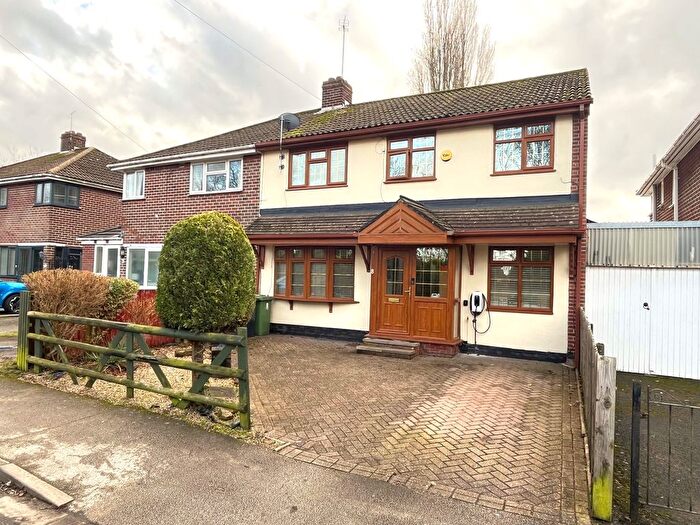
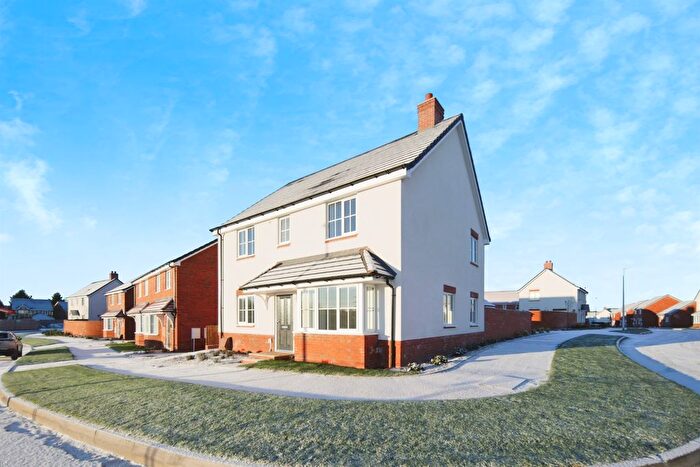
Houses for sale & to rent in Poplar, Coventry
House Prices in Poplar
Properties in Poplar have an average house price of £236,518.00 and had 187 Property Transactions within the last 3 years¹.
Poplar is an area in Coventry, Warwickshire with 1,522 households², where the most expensive property was sold for £805,000.00.
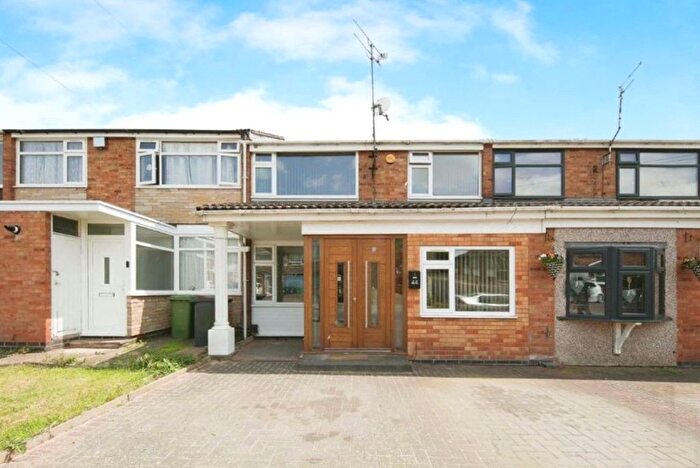
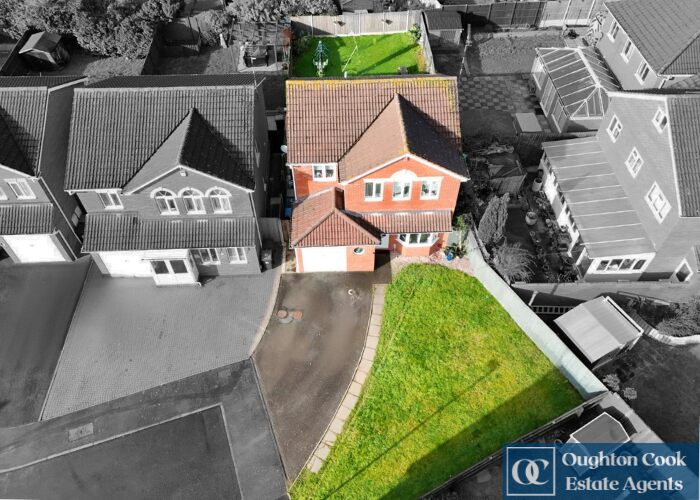
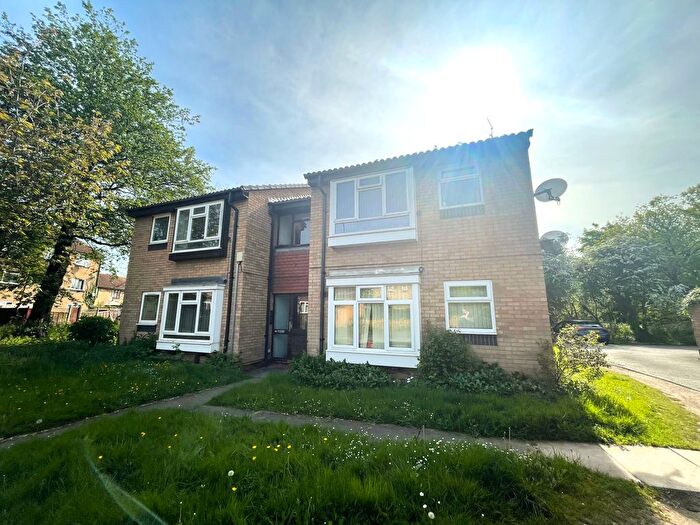
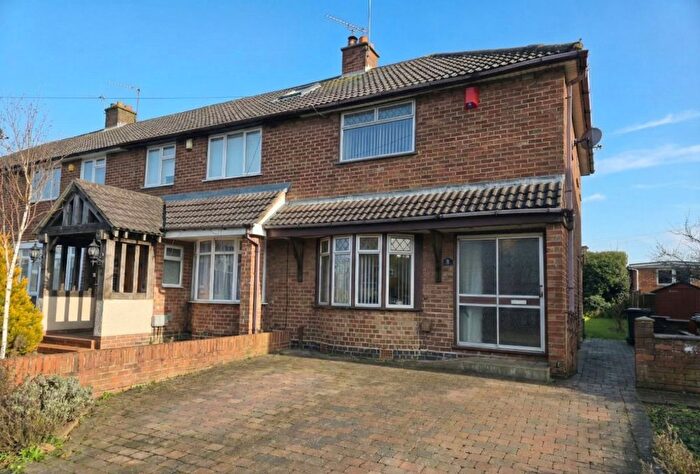
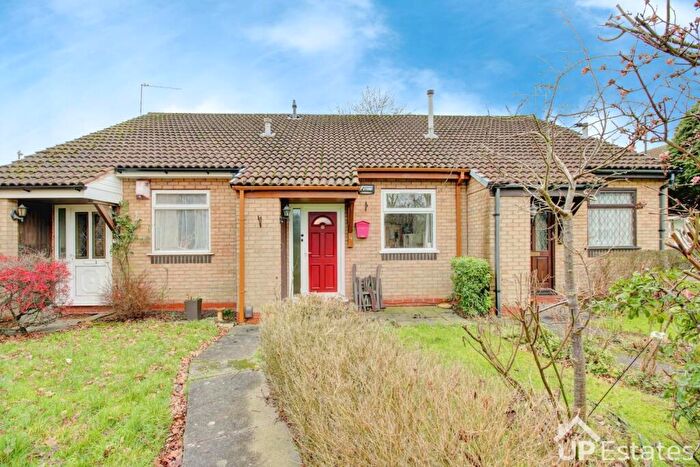
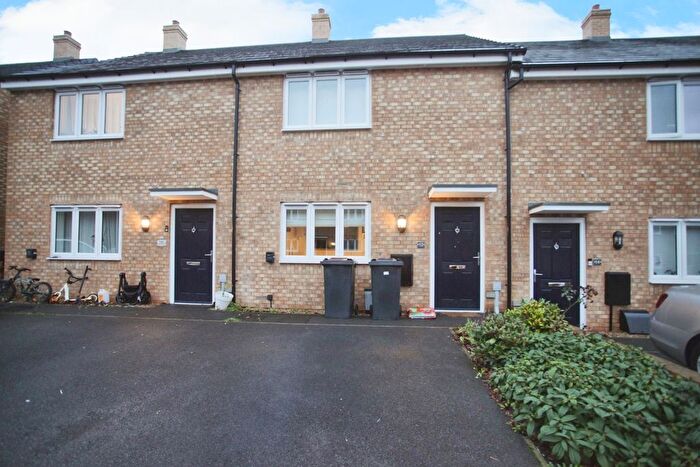
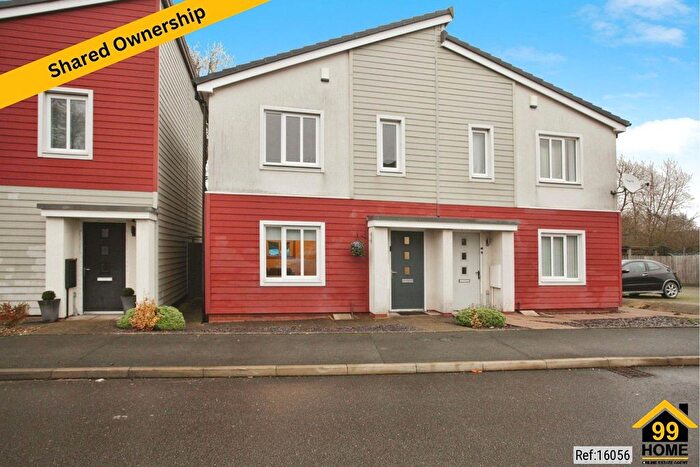
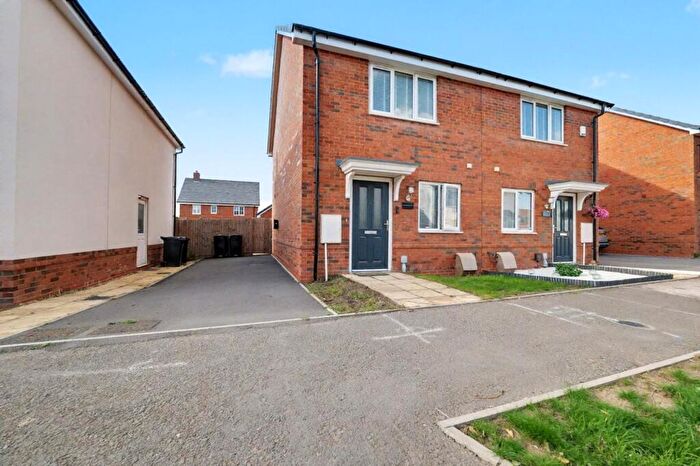
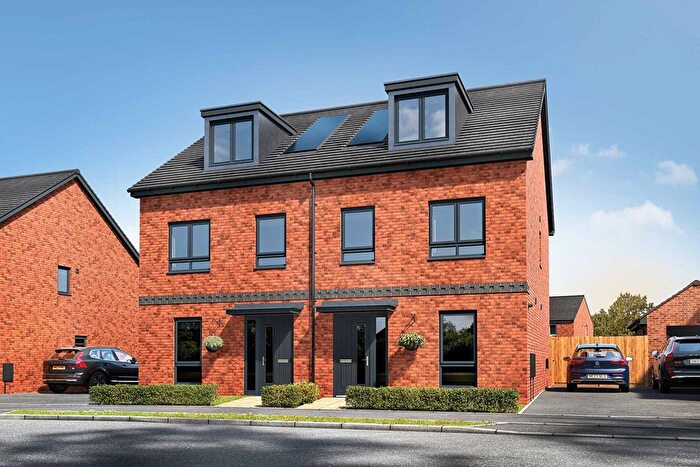
Properties for sale in Poplar
Roads and Postcodes in Poplar
Navigate through our locations to find the location of your next house in Poplar, Coventry for sale or to rent.
| Streets | Postcodes |
|---|---|
| Alwoodley Road | CV6 6PZ |
| Ashurst Close | CV6 6TB |
| Aspen Drive | CV6 6QS |
| Baker Street | CV6 6DJ |
| Bayton Road | CV7 9EJ CV7 9EL CV7 9EF |
| Bayton Road Industrial Estate | CV7 9DJ CV7 9TH |
| Bayton Way | CV7 9ER |
| Black Bank | CV7 9NY |
| Blackhorse Road | CV6 6DG CV6 6DL CV6 6DP CV7 9FW |
| Brindley Road | CV7 9EP |
| Brockenhurst Way | CV6 6TE |
| Bryant Road | CV7 9EN |
| Canalside | CV6 6RB |
| Cedars Road | CV7 9NJ |
| Channel Way | CV6 6RF |
| Colliery Lane | CV7 9NW |
| Coney Lane | CV6 6EF |
| Coventry Road | CV7 9BG CV7 9EY CV7 9EZ CV7 9FT CV7 9FU |
| Crondal Road | CV7 9NH |
| Devoran Close | CV7 9NP |
| Ganton Close | CV6 6QJ |
| Grovelands Industrial Estate | CV7 9ND CV7 9NE |
| Heritage Drive | CV6 6QR |
| Hindhead Drive | CV6 6PY |
| Kenwyn Green | CV7 9PL |
| Larchwood Road | CV7 9FZ CV7 9GD |
| Lovell Close | CV7 9QD |
| Lymington Drive | CV6 6TA |
| Lyndhurst Close | CV6 6TD |
| Maple Avenue | CV7 9AY |
| Martindale Road | CV7 9ET |
| Mawnan Close | CV7 9NR |
| Milestone Close | CV6 6RJ |
| Mottram Close | CV6 6QN |
| Narrowboat Close | CV6 6RD |
| Palmerston Way | CV6 6QE |
| Paragon Way | CV7 9QS |
| Phoenix Park | CV7 9QN |
| Portrush Way | CV6 6QH |
| Pumphouse Close | CV6 6RE |
| Rosemullion Close | CV7 9NQ |
| Sanders Road | CV6 6DH |
| Sephton Drive | CV6 6QY CV6 6QQ |
| Sinclair Drive | CV6 6QX |
| Stephenson Road | CV7 9EQ |
| Stockley Road | CV6 6PJ |
| Sundridge Avenue | CV6 6QF |
| Sutton Court | CV6 6QU |
| Telford Road | CV7 9ES |
| The Copse | CV7 9JW |
| The Larches | CV7 9NF |
| The Moorings Business Park | CV6 6RH |
| The Waterfront | CV7 9JH |
| Towpath Close | CV6 6RG |
| Tregorrick Road | CV7 9FF CV7 9FH |
| Tregullan Road | CV7 9NG |
| Trelawney Road | CV7 9FB CV7 9FD |
| Trenance Road | CV7 9FJ CV7 9FQ |
| Treneere Road | CV7 9FR |
| Tresillian Road | CV7 9FL CV7 9FN CV7 9PP CV7 9PW |
| Treviscoe Close | CV7 9FE |
| Trevose Avenue | CV7 9FP |
| Trewint Close | CV7 9FG |
| Waterside | CV6 6QW |
| Whitehorse Close | CV6 6NE |
| CV6 6DU |
Transport near Poplar
- FAQ
- Price Paid By Year
- Property Type Price
Frequently asked questions about Poplar
What is the average price for a property for sale in Poplar?
The average price for a property for sale in Poplar is £236,518. This amount is 18% lower than the average price in Coventry. There are 873 property listings for sale in Poplar.
What streets have the most expensive properties for sale in Poplar?
The streets with the most expensive properties for sale in Poplar are Coventry Road at an average of £349,600, Aspen Drive at an average of £325,721 and The Larches at an average of £310,000.
What streets have the most affordable properties for sale in Poplar?
The streets with the most affordable properties for sale in Poplar are Coney Lane at an average of £139,187, The Waterfront at an average of £140,450 and Tregullan Road at an average of £155,000.
Which train stations are available in or near Poplar?
Some of the train stations available in or near Poplar are Bedworth, Coventry Arena and Bermuda Park.
Property Price Paid in Poplar by Year
The average sold property price by year was:
| Year | Average Sold Price | Price Change |
Sold Properties
|
|---|---|---|---|
| 2025 | £214,330 | -11% |
45 Properties |
| 2024 | £238,148 | -5% |
75 Properties |
| 2023 | £249,595 | 17% |
67 Properties |
| 2022 | £206,635 | 1% |
85 Properties |
| 2021 | £204,302 | 9% |
66 Properties |
| 2020 | £185,488 | 2% |
55 Properties |
| 2019 | £182,013 | 0,5% |
61 Properties |
| 2018 | £181,118 | 17% |
58 Properties |
| 2017 | £150,037 | -3% |
63 Properties |
| 2016 | £153,790 | 6% |
62 Properties |
| 2015 | £145,118 | 4% |
63 Properties |
| 2014 | £138,919 | 11% |
74 Properties |
| 2013 | £123,290 | 1% |
53 Properties |
| 2012 | £122,160 | 11% |
48 Properties |
| 2011 | £108,889 | -29% |
37 Properties |
| 2010 | £140,351 | 9% |
34 Properties |
| 2009 | £128,359 | -1% |
33 Properties |
| 2008 | £129,531 | -5% |
65 Properties |
| 2007 | £136,623 | 0,2% |
126 Properties |
| 2006 | £136,344 | 4% |
131 Properties |
| 2005 | £130,297 | 8% |
115 Properties |
| 2004 | £119,582 | 10% |
139 Properties |
| 2003 | £107,901 | 3% |
183 Properties |
| 2002 | £104,807 | 31% |
239 Properties |
| 2001 | £71,903 | 0,1% |
104 Properties |
| 2000 | £71,830 | 17% |
127 Properties |
| 1999 | £59,935 | 11% |
148 Properties |
| 1998 | £53,354 | 19% |
84 Properties |
| 1997 | £43,452 | -0,5% |
41 Properties |
| 1996 | £43,668 | 9% |
47 Properties |
| 1995 | £39,613 | - |
38 Properties |
Property Price per Property Type in Poplar
Here you can find historic sold price data in order to help with your property search.
The average Property Paid Price for specific property types in the last three years are:
| Property Type | Average Sold Price | Sold Properties |
|---|---|---|
| Semi Detached House | £235,568.00 | 70 Semi Detached Houses |
| Detached House | £347,987.00 | 44 Detached Houses |
| Terraced House | £187,735.00 | 51 Terraced Houses |
| Flat | £129,693.00 | 22 Flats |

