
Houses for sale in Fillongley, Coventry
House Prices in Fillongley
Properties in Fillongley have an average house price of £436k and had 56 Property Transactions within the last 3 years¹.
Fillongley is an area in Coventry, Warwickshire with 976 households², where the most expensive property was sold for £1.14M.
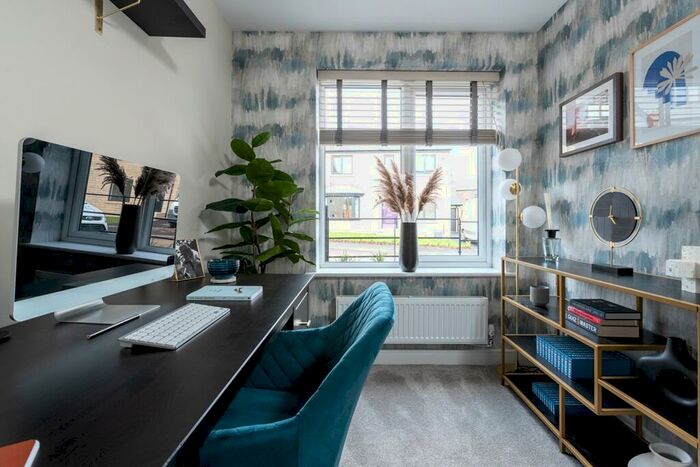
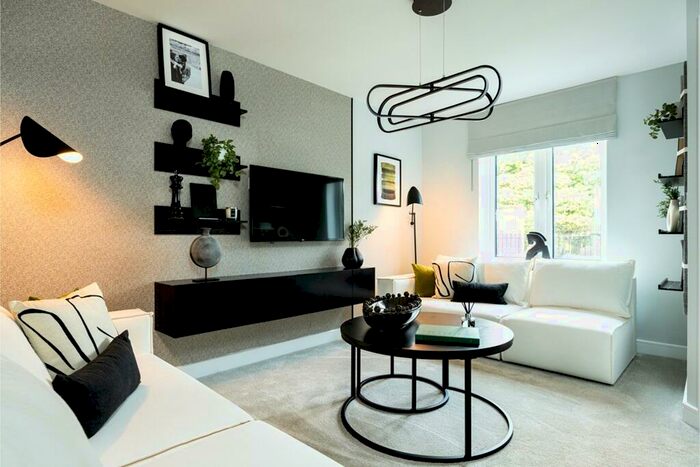
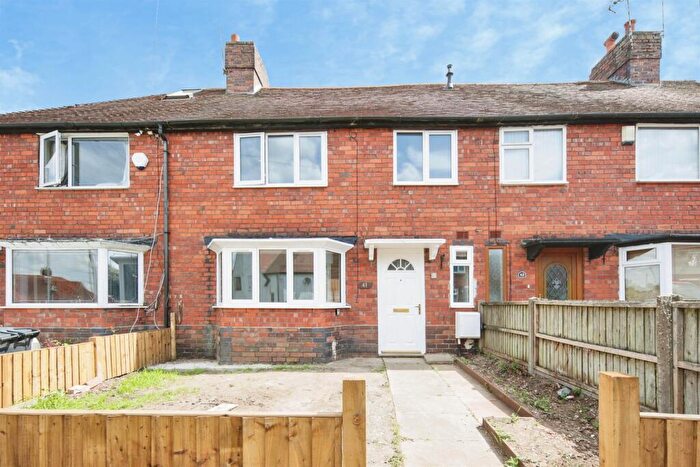
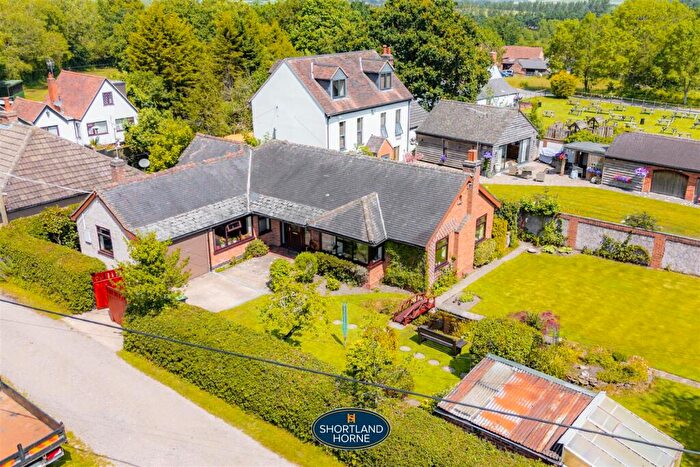
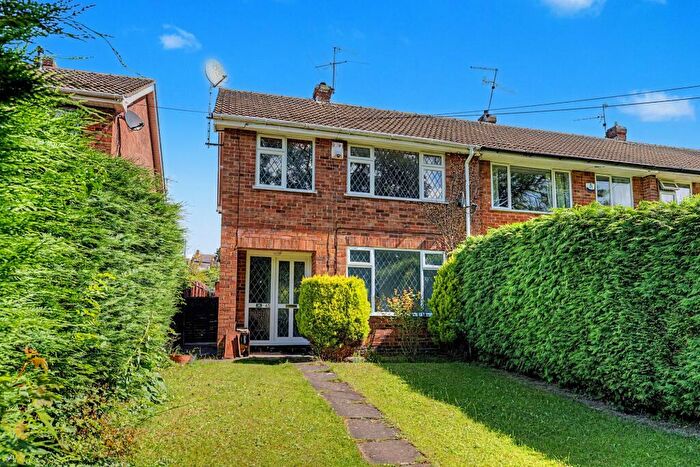
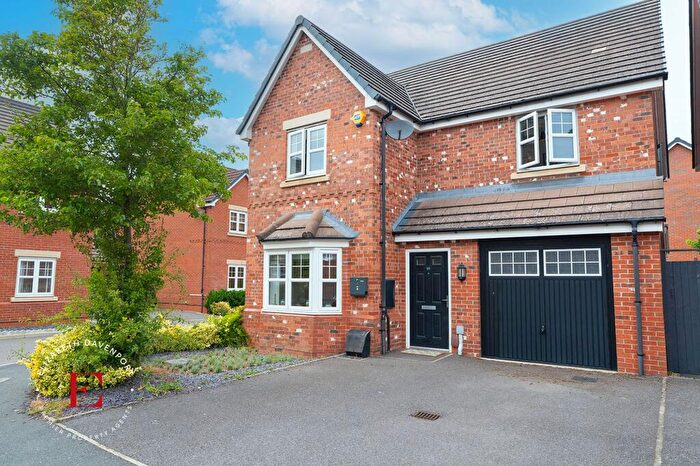
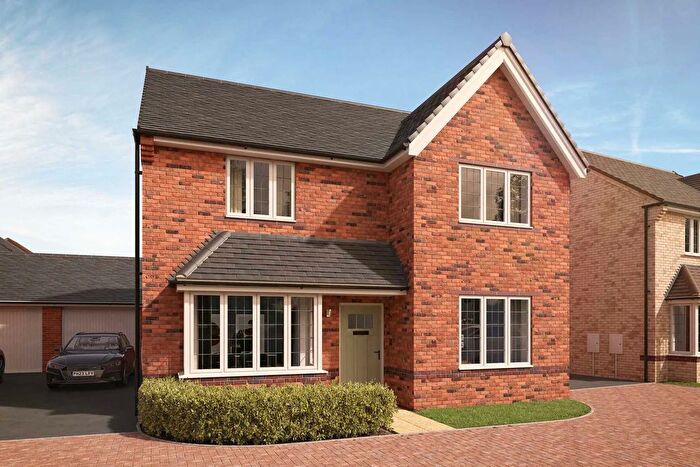
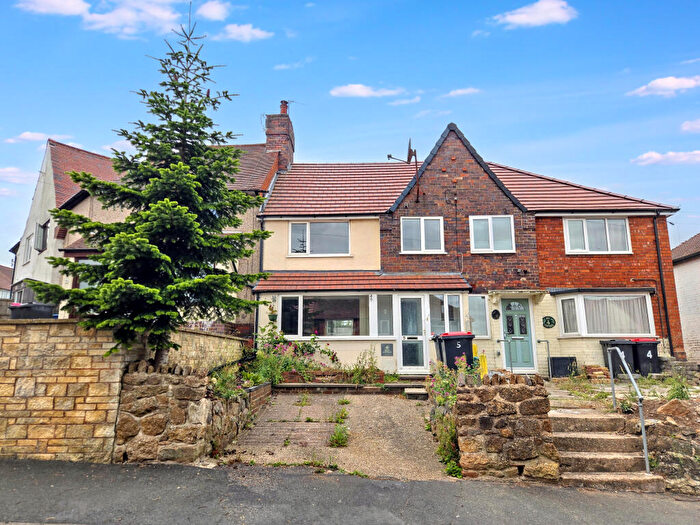
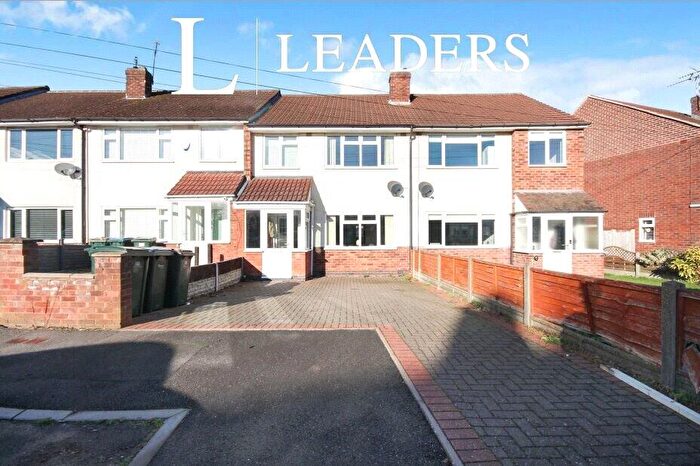
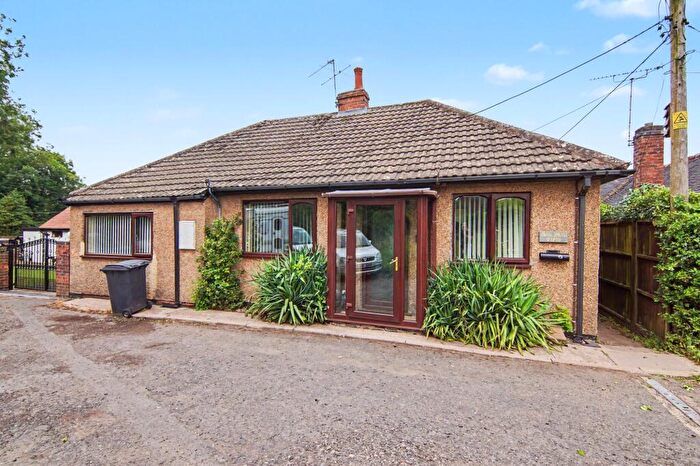
Properties for sale in Fillongley
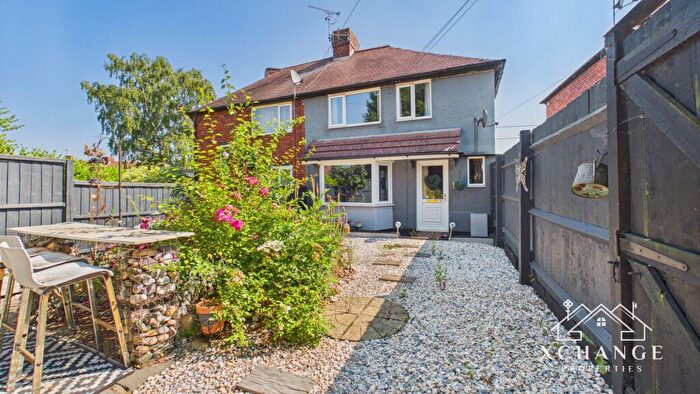
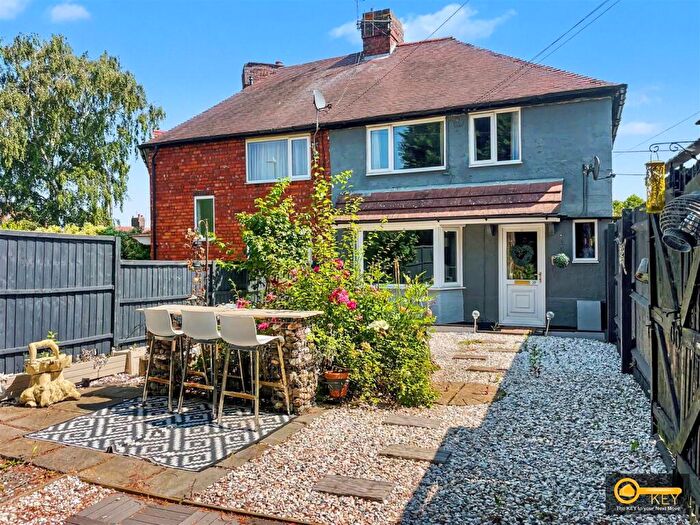
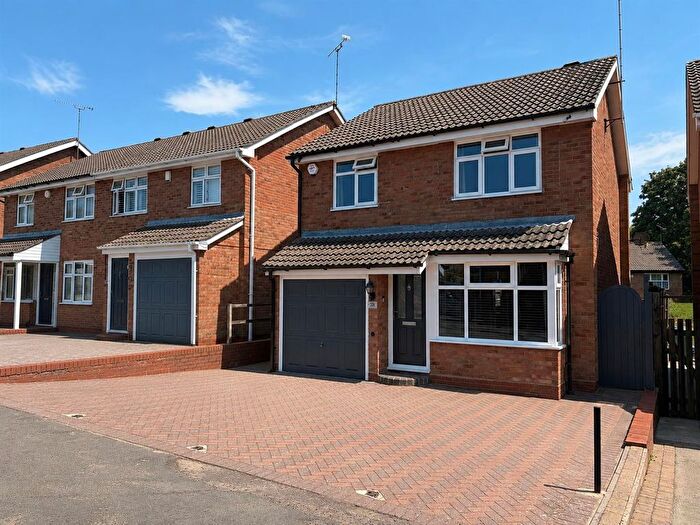
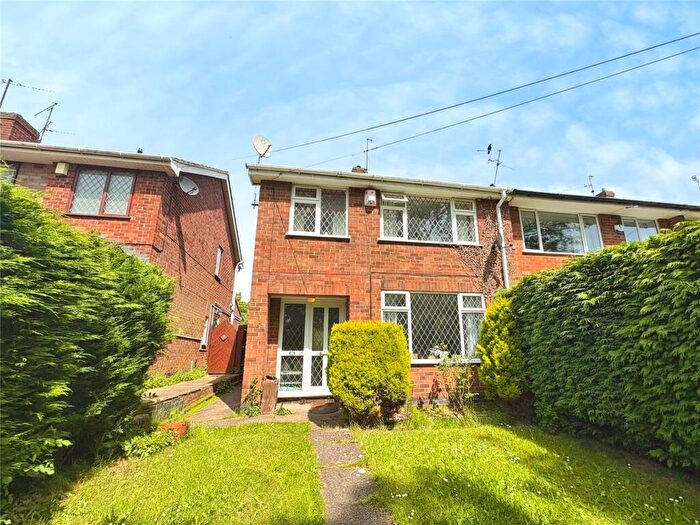
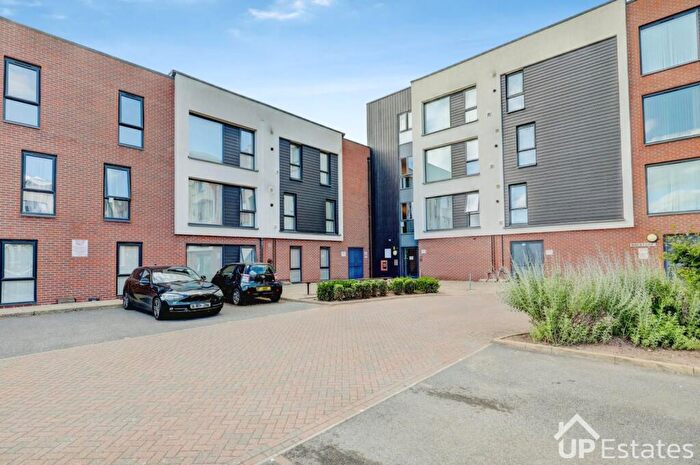
![]()
If you are looking to sell your house, let it out, or receive a property valuation, an expert can help you.
Click the button below to get started.
Roads and Postcodes in Fillongley
Navigate through our locations to find the location of your next house in Fillongley, Coventry for sale or to rent.
| Streets | Postcodes |
|---|---|
| Adkins Croft | CV7 8PA |
| Arley Lane | CV7 8QJ CV7 8DH CV7 8QG |
| Bennetts Road North | CV7 8BG |
| Berryfields | CV7 8EX |
| Birmingham Road | CV7 7JT CV7 7HJ |
| Black Hall Lane | CV7 8EG |
| Bourne Brook Close | CV7 8NS |
| Breach Oak Lane | CV7 8AU CV7 8AW CV7 8DE |
| Broad Lane | CV7 8EH |
| Burrow Hill Lane | CV7 8BE |
| Castle Close | CV7 8PB |
| Church Lane | CV7 8AS CV7 8AZ CV7 8BA CV7 8EW |
| Common Lane | CV7 8AQ |
| Coventry Road | CV7 8BY CV7 8BZ CV7 8DA CV7 8EQ CV7 8ET |
| Eastlang Road | CV7 8ER |
| Far Parks | CV7 8HS |
| Fillongley Road | CV7 8PJ |
| Gorsey Green Lane | CV7 8PH |
| Great Packington | CV7 7HG CV7 7HH |
| Green End | CV7 8DT CV7 8DU |
| Green End Road | CV7 8DS CV7 8EN CV7 8EP |
| Hardingwood Lane | CV7 8EL |
| Highfield Lane | CV7 8BJ CV7 8BL CV7 8BN |
| Holbeche Crescent | CV7 8ES |
| Howe Green Lane | CV7 8SA |
| Kingswood Avenue | CV7 8BU |
| Kinwalsey Lane | CV7 7HS |
| Lawrence Court | CV7 8FB |
| Maxstoke Lane | CV7 7HR CV7 7JW |
| Meriden Road | CV7 8DP CV7 8DR CV7 8DX |
| Mill Lane | CV7 8EE |
| Motorway Services Area M6 | CV7 8NR |
| Newhall Green | CV7 8DW |
| Nuneaton Road | CV7 8DL CV7 8DN CV7 8EZ |
| Old House Lane | CV7 8BS |
| Ousterne Lane | CV7 8EU |
| Packington Lane | CV7 7HN |
| Packington Park | CV7 7PD CV7 7HE CV7 7HF |
| Park Lane | CV7 8DG |
| Pump Lane | CV7 8DQ |
| Rock Lane | CV7 8BD CV7 8BH |
| Sandy Lane | CV7 8DD |
| Shawbury Lane | CV7 8EF |
| Shepherds Lane | CV7 7JU |
| Solomons Temple Lane | CV7 8EJ |
| Somers Road | CV7 7PL |
| Square Lane | CV7 8AX |
| St Marys Road | CV7 8EY |
| Stonehouse Lane | CV7 8AG |
| Tamworth Road | CV7 8SL CV7 8AA CV7 8BB CV7 8BP CV7 8BQ CV7 8BT CV7 8BW CV7 8BX CV7 8DY CV7 8DZ CV7 8EA |
| The Common | CV7 8AR |
| The Glebe | CV7 8AY |
| The Laurels | CV7 8FA |
| The Meadows | CV7 8BF |
| The Oaks | CV7 8QN |
| Tippers Hill Lane | CV7 8DJ CV7 8RZ |
| Wall Hill Road | CV7 8AP |
| Whitestitch Lane | CV7 7JE |
| Willow Lane | CV7 8JB |
| Windmill Lane | CV7 8AN |
| Wood End Lane | CV7 8DB CV7 8DF |
| CV7 8QP |
Property price trends in Fillongley
According to the latest Land Registry data, the average home in Fillongley sold for £442,956 in 2025. That figure comes from 929 sales logged over the past 30 years.
Prices have fallen back over the last three years. Compared with 2022, when the typical sale came in around £503,093, that's a fall of roughly 12%.
Looking back five years, average prices are down about 6.9% since 2020, a drop of around £32,671 in cash terms.
Zoom out to the past decade for the fuller picture. Back in 2015, homes here averaged £255,268, so the typical sold price has climbed about 73.5% since then, roughly 5.7% a year. Stretch the view to fifteen years and that annual pace eases back to about 2.4%.
Frequently asked questions about Fillongley
What is the average price for a property for sale in Fillongley?
The average price for a property for sale in Fillongley is £436,360. This amount is 52% higher than the average price in Coventry. There are 4,122 property listings for sale in Fillongley.
What streets have the most expensive properties for sale in Fillongley?
The streets with the most expensive properties for sale in Fillongley are Meriden Road at an average of £597,500, Coventry Road at an average of £588,250 and Willow Lane at an average of £535,000.
What streets have the most affordable properties for sale in Fillongley?
The streets with the most affordable properties for sale in Fillongley are Breach Oak Lane at an average of £245,000, St Marys Road at an average of £270,000 and Eastlang Road at an average of £273,495.
Which train stations are available in or near Fillongley?
Some of the train stations available in or near Fillongley are Coventry Arena, Bedworth and Tile Hill.
Property Price Paid in Fillongley by Year
The average sold property price by year was:
| Year | Average Sold Price | Price Change |
Sold Properties
|
|---|---|---|---|
| 2025 | £442,956 | 10% |
21 Properties |
| 2024 | £400,766 | -14% |
15 Properties |
| 2023 | £456,130 | -10% |
20 Properties |
| 2022 | £503,093 | 16% |
43 Properties |
| 2021 | £424,475 | -12% |
42 Properties |
| 2020 | £475,627 | 31% |
35 Properties |
| 2019 | £326,987 | -33% |
41 Properties |
| 2018 | £434,603 | 10% |
38 Properties |
| 2017 | £390,945 | 11% |
37 Properties |
| 2016 | £348,485 | 27% |
35 Properties |
Property Price per Property Type in Fillongley
Here you can find historic sold price data in order to help with your property search.
The average Property Paid Price for specific property types in the last three years are:
| Property Type | Average Sold Price | Sold Properties |
|---|---|---|
| Semi Detached House | £316,865.00 | 26 Semi Detached Houses |
| Detached House | £613,586.00 | 24 Detached Houses |
| Terraced House | £245,268.00 | 6 Terraced Houses |
