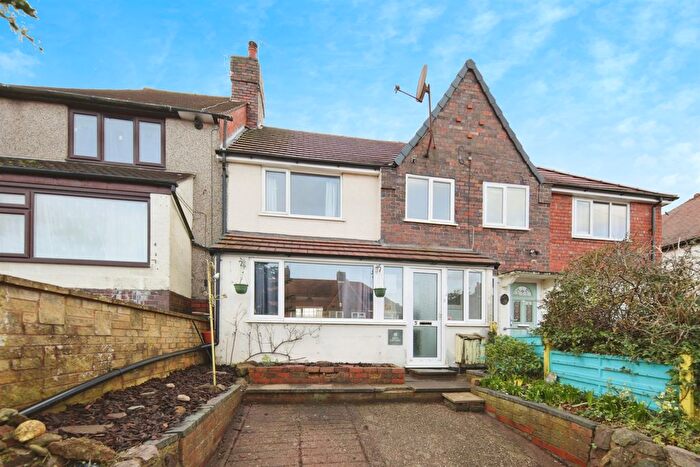
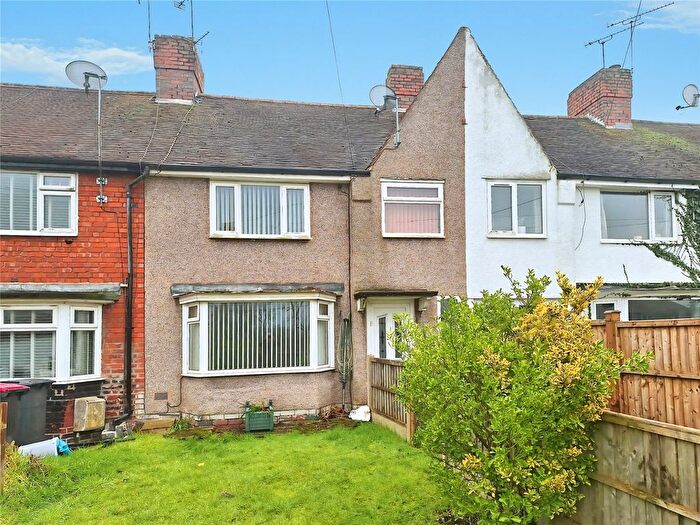
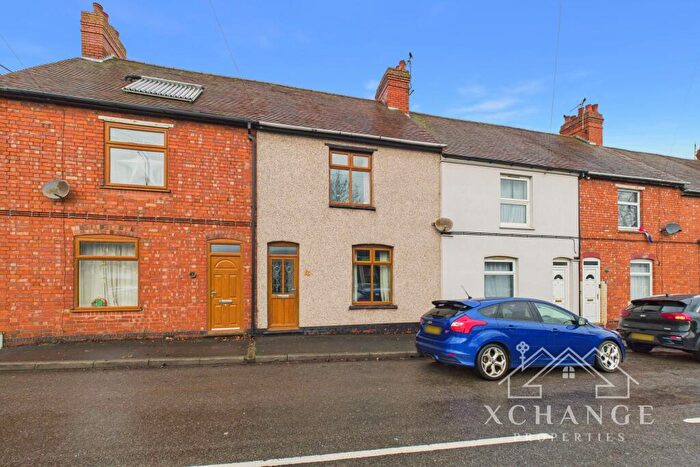
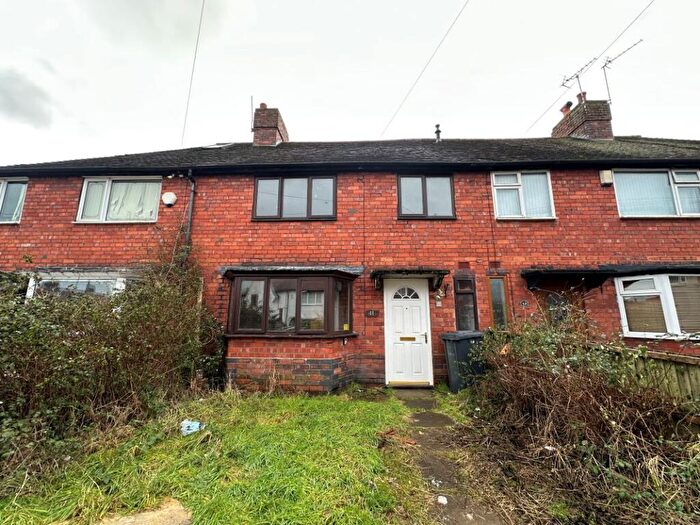
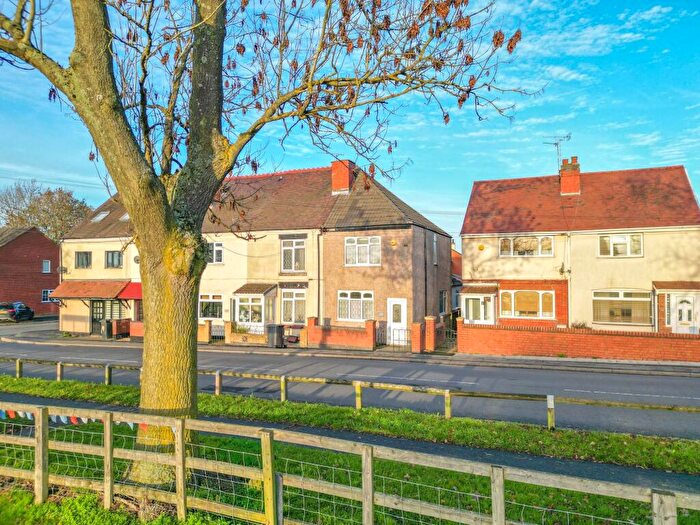
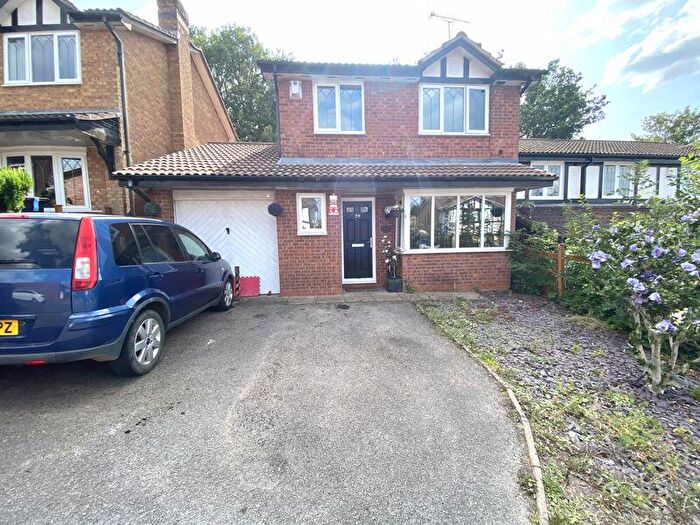
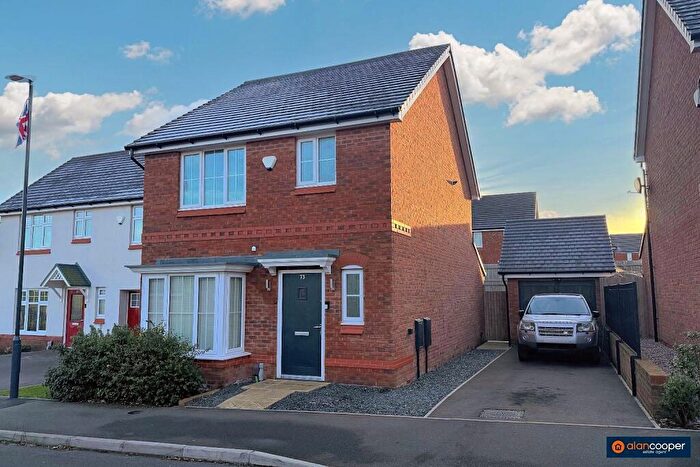
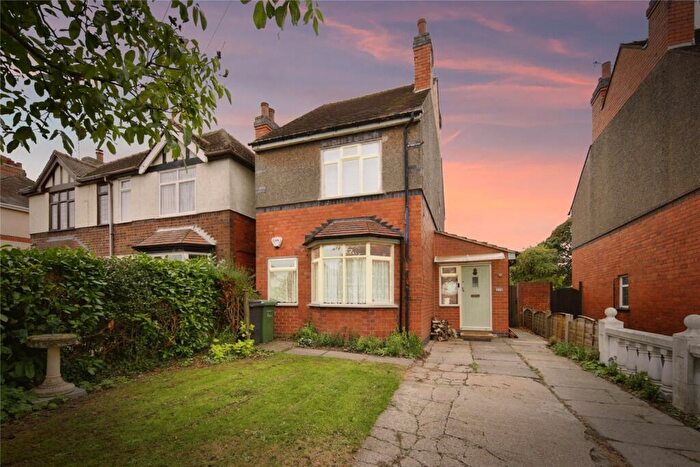
Houses for sale & to rent in Arley And Whitacre, Coventry
House Prices in Arley And Whitacre
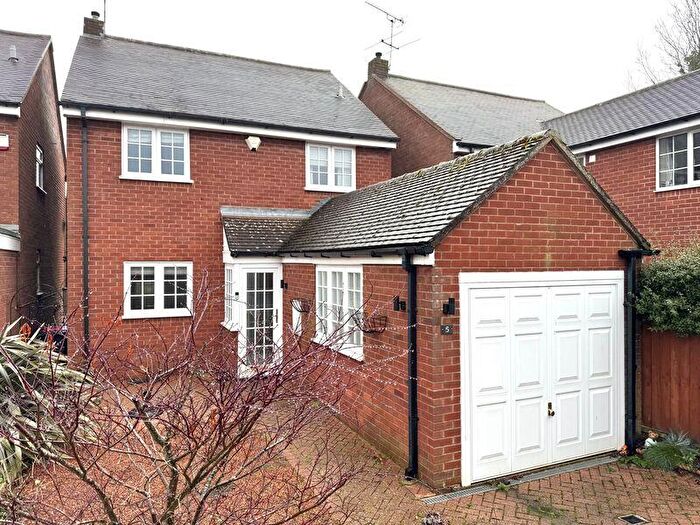
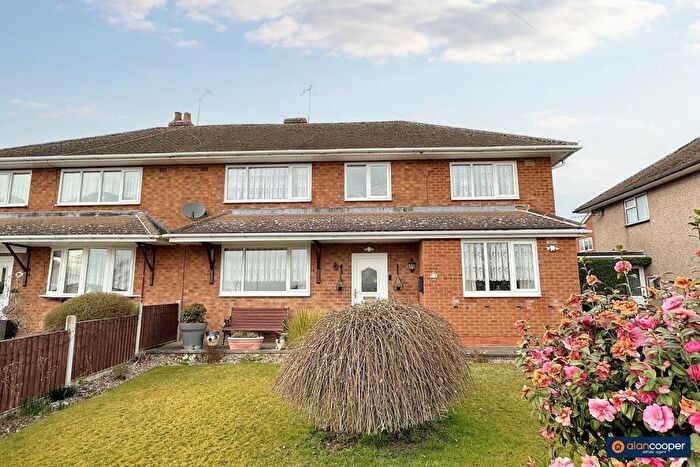
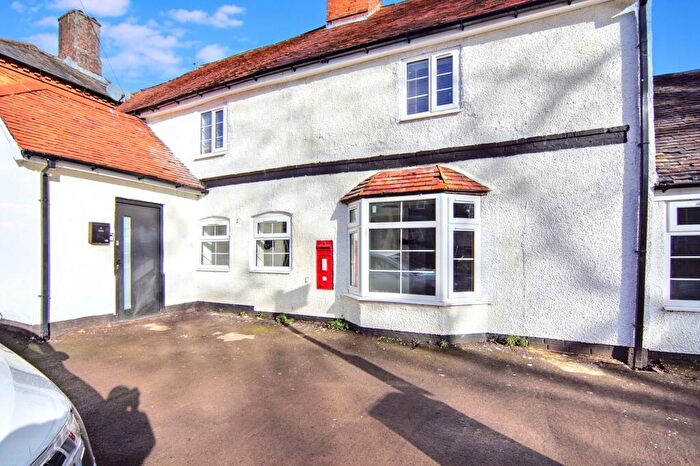
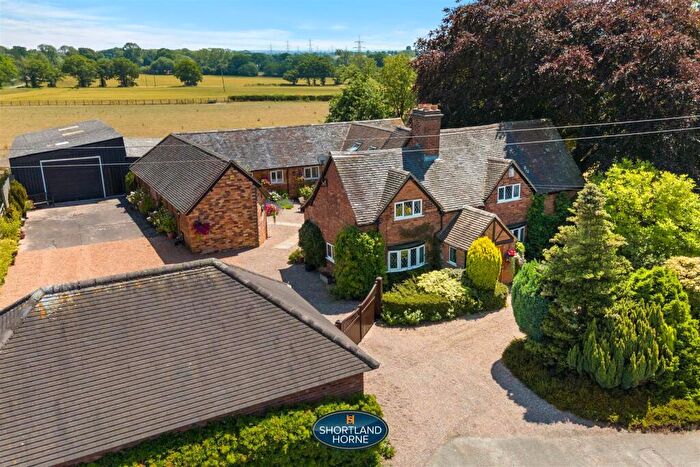
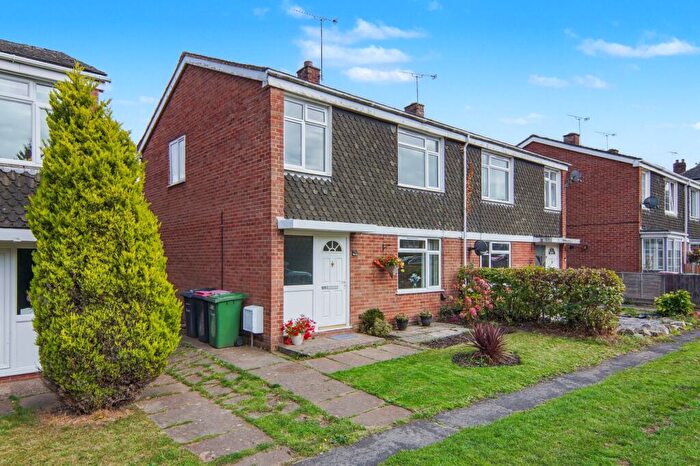
Properties in Arley And Whitacre have an average house price of £225,855.00 and had 113 Property Transactions within the last 3 years¹.
Arley And Whitacre is an area in Coventry, Warwickshire with 1,181 households², where the most expensive property was sold for £1,175,000.00.
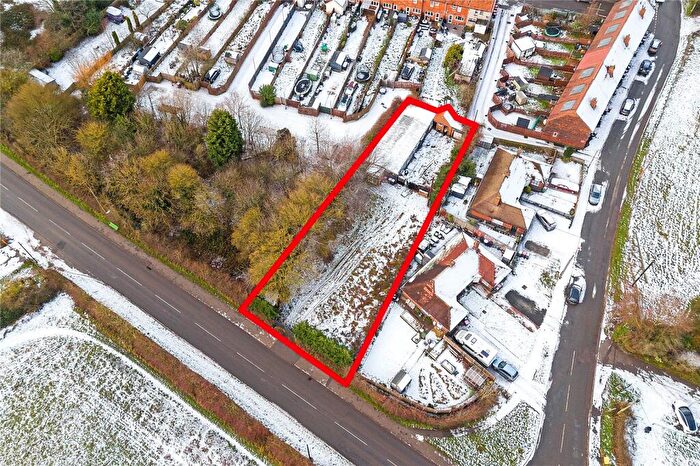
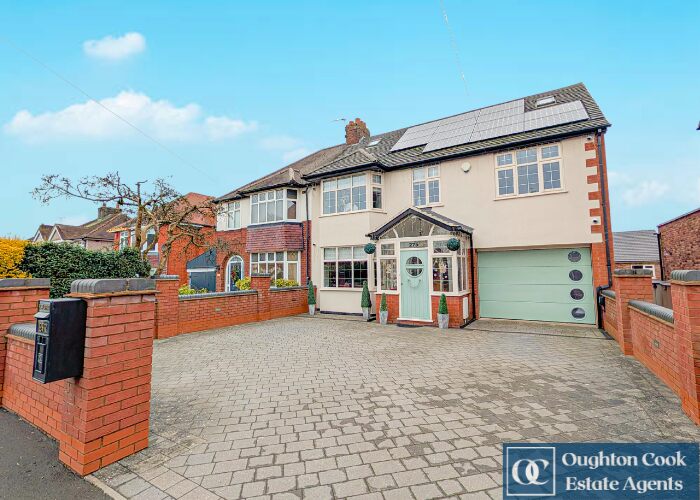
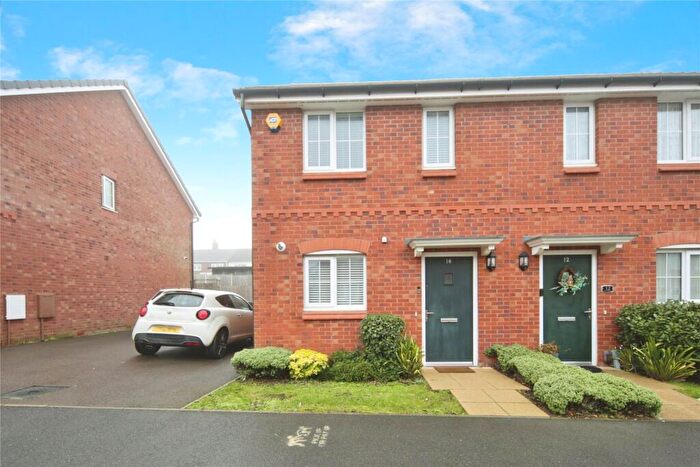
Properties for sale in Arley And Whitacre
Roads and Postcodes in Arley And Whitacre
Navigate through our locations to find the location of your next house in Arley And Whitacre, Coventry for sale or to rent.
| Streets | Postcodes |
|---|---|
| Ansley Lane | CV7 8FT CV7 8FU CV7 8FS CV7 8NU |
| Ash Grove | CV7 8FP |
| Atheron Grove | CV7 8QL |
| Beech Grove | CV7 8FQ |
| Bournebrook View | CV7 8NZ |
| Charles Street | CV7 8GL CV7 8GN |
| Church Close | CV7 8QA |
| Church Lane | CV7 8FW |
| Colliers Way | CV7 8HN |
| Daffern Avenue | CV7 8GR |
| Devitts Green Lane | CV7 8GF CV7 8HP CV7 8GE |
| Earnlege Way | CV7 8QF |
| Elm Grove | CV7 8NT |
| Fir Tree Lane | CV7 8GW CV7 8GX CV7 8GU |
| Fourfields Way | CV7 8PX |
| Frederick Road | CV7 8GQ |
| George Street | CV7 8GP CV7 8HJ CV7 8HL |
| Gun Hill | CV7 8HA CV7 8HH CV7 8PQ CV7 8HB CV7 8QH |
| Hawthorne Avenue | CV7 8HF |
| Hill Top | CV7 8FX CV7 8GA |
| Hilltop | CV7 8FZ CV7 8FY |
| Hollick Crescent | CV7 8GT |
| James Street | CV7 8GJ |
| Lamp Lane | CV7 8QE |
| Laurel Close | CV7 8HR |
| Lichfield Close | CV7 8PU |
| Meadow Croft | CV7 8NL |
| Morgan Close | CV7 8PR |
| Oak Avenue | CV7 8FN |
| Phil Collins Way | CV7 8PZ CV7 8FD |
| Ransome Road | CV7 8GY CV7 8GZ |
| Rectory Drive | CV7 8RD |
| Rectory Road | CV7 8FL CV7 8FR CV7 8FJ |
| Rowland Court | CV7 8PF |
| Ryder Row | CV7 8GS |
| Slowley Hill | CV7 8HQ |
| Spinney Close | CV7 8PD |
| Spring Hill | CV7 8FE CV7 8FF |
| St Michaels Close | CV7 8PY |
| Station Hill | CV7 8ED |
| Station Road | CV7 8FG CV7 8GD |
| Stewart Court | CV7 8NX |
| Stonehouse Lane | CV7 8GB |
| Sycamore Crescent | CV7 8HD CV7 8HE CV7 8HG |
| Tamworth Road | CV7 8HT CV7 8EB |
| Teagles Gardens | CV7 8FH |
| Tremelling Way | CV7 8PS |
| Willow Walk | CV7 8NY |
| Wood Lane | CV7 8GG |
| Woodside | CV7 8GH |
Transport near Arley And Whitacre
-
Bermuda Park Station
-
Nuneaton Station
-
Atherstone Station
-
Bedworth Station
-
Coventry Arena Station
-
Coleshill Parkway Station
-
Water Orton Station
-
Birmingham International Station
-
Hampton-In-Arden Station
-
Canley Station
- FAQ
- Price Paid By Year
- Property Type Price
Frequently asked questions about Arley And Whitacre
What is the average price for a property for sale in Arley And Whitacre?
The average price for a property for sale in Arley And Whitacre is £225,855. This amount is 22% lower than the average price in Coventry. There are 408 property listings for sale in Arley And Whitacre.
What streets have the most expensive properties for sale in Arley And Whitacre?
The streets with the most expensive properties for sale in Arley And Whitacre are Station Road at an average of £707,500, Spring Hill at an average of £457,500 and Lichfield Close at an average of £422,500.
What streets have the most affordable properties for sale in Arley And Whitacre?
The streets with the most affordable properties for sale in Arley And Whitacre are Daffern Avenue at an average of £115,375, Ryder Row at an average of £139,800 and Ransome Road at an average of £141,166.
Which train stations are available in or near Arley And Whitacre?
Some of the train stations available in or near Arley And Whitacre are Bermuda Park, Nuneaton and Atherstone.
Property Price Paid in Arley And Whitacre by Year
The average sold property price by year was:
| Year | Average Sold Price | Price Change |
Sold Properties
|
|---|---|---|---|
| 2025 | £232,357 | -6% |
35 Properties |
| 2024 | £245,158 | 21% |
45 Properties |
| 2023 | £192,636 | -18% |
33 Properties |
| 2022 | £226,721 | -2% |
52 Properties |
| 2021 | £231,459 | 11% |
62 Properties |
| 2020 | £205,436 | 20% |
48 Properties |
| 2019 | £164,138 | -18% |
50 Properties |
| 2018 | £194,256 | 13% |
65 Properties |
| 2017 | £168,156 | 19% |
51 Properties |
| 2016 | £136,469 | 2% |
58 Properties |
| 2015 | £134,200 | -17% |
55 Properties |
| 2014 | £156,533 | 7% |
55 Properties |
| 2013 | £145,964 | -21% |
35 Properties |
| 2012 | £176,091 | 32% |
36 Properties |
| 2011 | £120,237 | -21% |
41 Properties |
| 2010 | £145,248 | -15% |
32 Properties |
| 2009 | £167,141 | 23% |
24 Properties |
| 2008 | £128,726 | -19% |
34 Properties |
| 2007 | £153,036 | 14% |
66 Properties |
| 2006 | £131,416 | -9% |
59 Properties |
| 2005 | £142,829 | 10% |
64 Properties |
| 2004 | £128,212 | 36% |
62 Properties |
| 2003 | £82,140 | -16% |
87 Properties |
| 2002 | £95,303 | 35% |
71 Properties |
| 2001 | £61,861 | 4% |
81 Properties |
| 2000 | £59,219 | -3% |
71 Properties |
| 1999 | £61,012 | 23% |
59 Properties |
| 1998 | £46,786 | -8% |
59 Properties |
| 1997 | £50,560 | 2% |
54 Properties |
| 1996 | £49,438 | 4% |
48 Properties |
| 1995 | £47,446 | - |
40 Properties |
Property Price per Property Type in Arley And Whitacre
Here you can find historic sold price data in order to help with your property search.
The average Property Paid Price for specific property types in the last three years are:
| Property Type | Average Sold Price | Sold Properties |
|---|---|---|
| Semi Detached House | £210,880.00 | 21 Semi Detached Houses |
| Detached House | £377,633.00 | 31 Detached Houses |
| Terraced House | £153,877.00 | 61 Terraced Houses |

