
Houses for sale & to rent in Welford, Market Harborough
House Prices in Welford
Properties in Welford have an average house price of £549k and had 62 Property Transactions within the last 3 years¹.
Welford is an area in Market Harborough, Warwickshire with 759 households², where the most expensive property was sold for £3.6M.
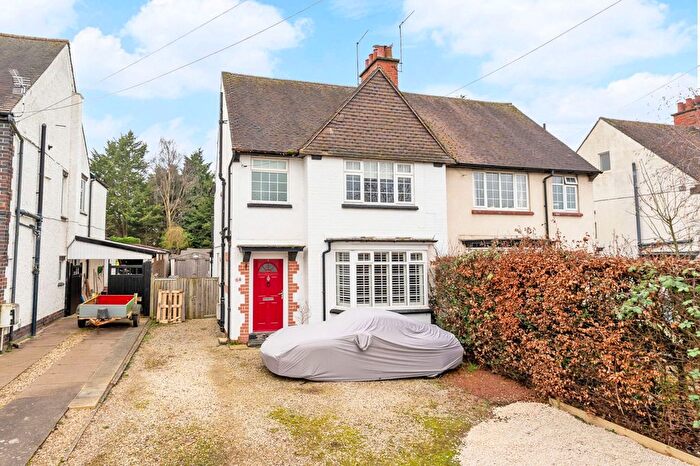
Properties for sale in Welford
![]()
If you are looking to sell your house, let it out, or receive a property valuation, an expert can help you.
Click the button below to get started.


Roads and Postcodes in Welford
Navigate through our locations to find the location of your next house in Welford, Market Harborough for sale or to rent.
| Streets | Postcodes |
|---|---|
| Agricultural Cottages | LE16 8JY |
| Back Lane | LE16 9SE |
| Bassett Way | LE16 9RJ |
| Beeches Close | LE16 9UQ |
| Berkeley Street | LE16 9UF |
| Braybrooke Road | LE16 8LT LE16 8LU LE16 8LX |
| Chapel Lane | LE16 9RL |
| Chestnut Grove | LE16 9RH |
| Church Close | LE16 9RN |
| Church Farm Way | LE16 8NP |
| Church Lane | LE16 9RW |
| Church Street | LE16 9UA |
| Clipston Lane | LE16 8LY |
| Clipston Road | LE16 9SN LE16 9UB |
| Coombes Yard | LE16 9UP |
| East Farndon Road | LE16 9TU |
| Farndon Road | LE16 9SW |
| Gold Street | LE16 9RR |
| Granary Yard | LE16 9BS |
| Hall Close | LE16 8JS |
| Harborough Road | LE16 8NA LE16 9RT LE16 9SF |
| Harts Lane | LE16 9SR |
| High Street | LE16 9RU |
| Home Farm Close | LE16 9SS |
| Home Farm Grove | LE16 8NJ |
| Hothorpe Road | LE16 9TX |
| Kelmarsh Road | LE16 8JX LE16 8JZ LE16 9RX LE16 9RY |
| Main Street | LE16 8ND LE16 8NE LE16 8NG LE16 8NS LE16 9SH LE16 9SJ LE16 9TY |
| Marecroft | LE16 9RG |
| Marston Lane | LE16 9SL |
| Naseby Road | LE16 9RZ LE16 9UG LE16 9UH |
| Nether Green | LE16 9SA |
| Northampton Road | LE16 8NH |
| Oxendon Road | LE16 8LA LE16 8LB |
| Pegs Lane | LE16 9SB |
| Rectory Court | LE16 9SU |
| Sibbertoft Road | LE16 9TZ |
| The Green | LE16 9RS |
| The Lealand | LE16 9SQ |
| The Orchard | LE16 9UX |
| Theddingworth Road | LE16 9TQ |
| Welford Road | LE16 9UJ |
| Welland Gardens | LE16 9BF |
| Welland Rise | LE16 9UD |
| Weskers Close | LE16 9SD |
| Westhorpe | LE16 9UL |
Transport near Welford
-
 Market Harborough Station
 -
Kettering Station
-
Long Buckby Station
-
Corby Station
-
South Wigston Station
-
Rugby Station
-
Narborough Station
-
Northampton Station
-
Wellingborough Station
- FAQ
- Price Paid By Year
- Property Type Price
Frequently asked questions about Welford
What is the average price for a property for sale in Welford?
The average price for a property for sale in Welford is £548,905. There are 1,955 property listings for sale in Welford.
What streets have the most expensive properties for sale in Welford?
The streets with the most expensive properties for sale in Welford are Clipston Road at an average of £3,600,000, Berkeley Street at an average of £885,000 and Main Street at an average of £587,178.
What streets have the most affordable properties for sale in Welford?
The streets with the most affordable properties for sale in Welford are High Street at an average of £292,500, Oxendon Road at an average of £339,000 and Church Street at an average of £375,000.
Which train stations are available in or near Welford?
Some of the train stations available in or near Welford are Market Harborough, Kettering and Long Buckby.
Property Price Paid in Welford by Year
The average sold property price by year was:
| Year | Average Sold Price | Price Change |
Sold Properties
|
|---|---|---|---|
| 2025 | £722,500 | 33% |
17 Properties |
| 2024 | £485,605 | 1% |
20 Properties |
| 2023 | £481,500 | -2% |
25 Properties |
| 2022 | £490,128 | -10% |
20 Properties |
| 2021 | £537,294 | 12% |
46 Properties |
| 2020 | £471,252 | 2% |
18 Properties |
| 2019 | £463,517 | 6% |
29 Properties |
| 2018 | £435,565 | 6% |
22 Properties |
| 2017 | £409,600 | -1% |
29 Properties |
| 2016 | £414,064 | 1% |
31 Properties |
| 2015 | £410,621 | 17% |
33 Properties |
| 2014 | £338,820 | 15% |
41 Properties |
| 2013 | £286,901 | -18% |
26 Properties |
| 2012 | £337,333 | -17% |
24 Properties |
| 2011 | £394,867 | 26% |
25 Properties |
| 2010 | £290,453 | 0,2% |
30 Properties |
| 2009 | £289,802 | -14% |
19 Properties |
| 2008 | £330,055 | -5% |
18 Properties |
| 2007 | £344,908 | 9% |
57 Properties |
| 2006 | £313,772 | 11% |
37 Properties |
| 2005 | £280,232 | -10% |
25 Properties |
| 2004 | £308,013 | 3% |
33 Properties |
| 2003 | £298,687 | 20% |
36 Properties |
| 2002 | £240,427 | 14% |
35 Properties |
| 2001 | £205,695 | 27% |
24 Properties |
| 2000 | £150,642 | -13% |
34 Properties |
| 1999 | £169,718 | 20% |
30 Properties |
| 1998 | £135,171 | -10% |
45 Properties |
| 1997 | £148,759 | 25% |
37 Properties |
| 1996 | £111,889 | 9% |
50 Properties |
| 1995 | £101,437 | - |
28 Properties |
Property Price per Property Type in Welford
Here you can find historic sold price data in order to help with your property search.
The average Property Paid Price for specific property types in the last three years are:
| Property Type | Average Sold Price | Sold Properties |
|---|---|---|
| Semi Detached House | £354,807.00 | 13 Semi Detached Houses |
| Detached House | £731,437.00 | 32 Detached Houses |
| Terraced House | £356,983.00 | 15 Terraced Houses |
| Flat | £329,430.00 | 2 Flats |