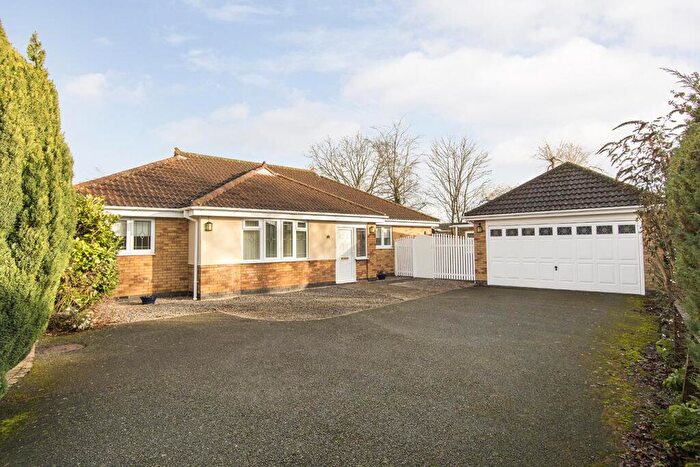
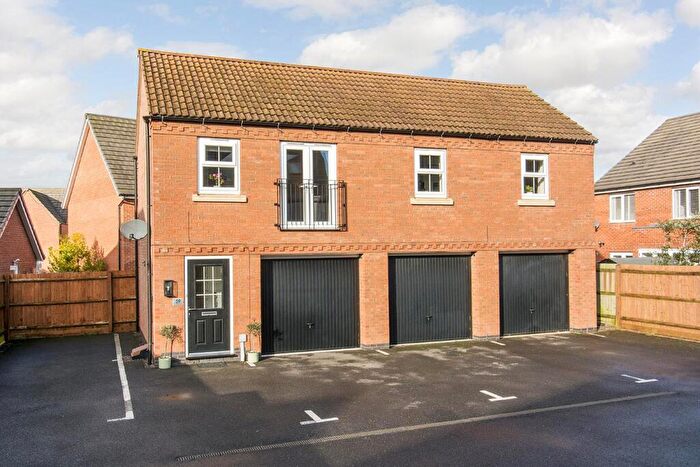
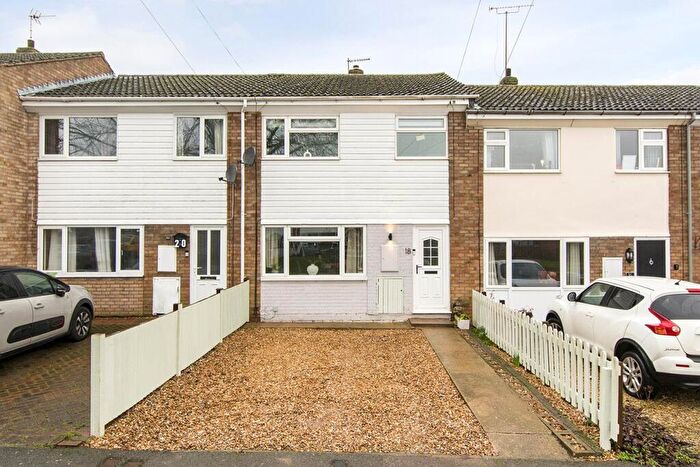
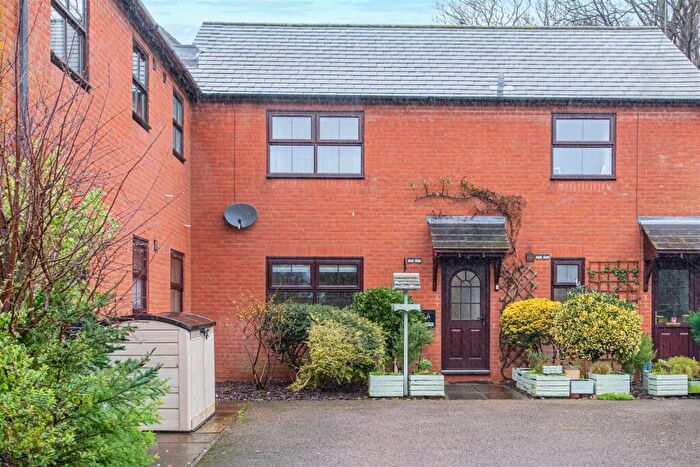
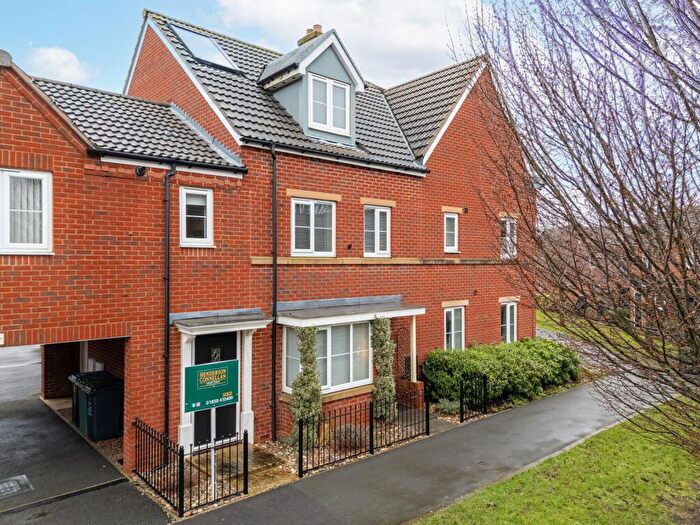
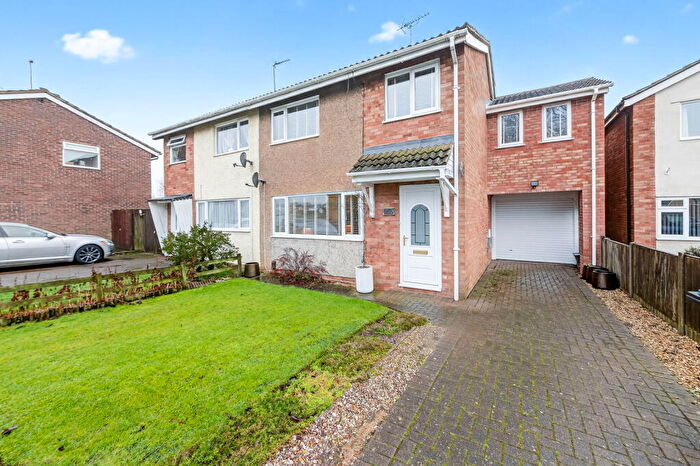
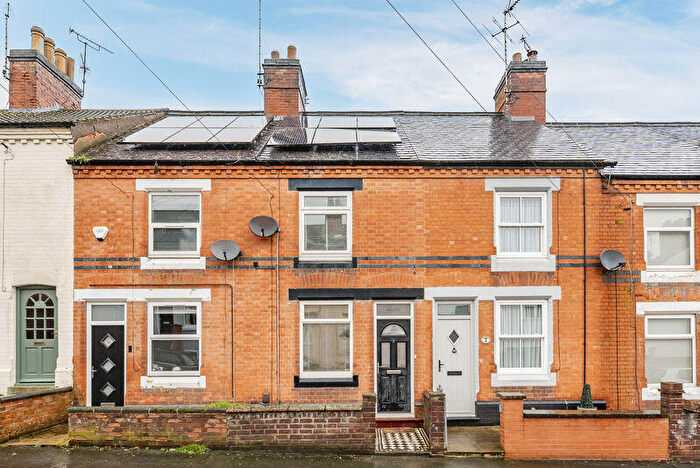
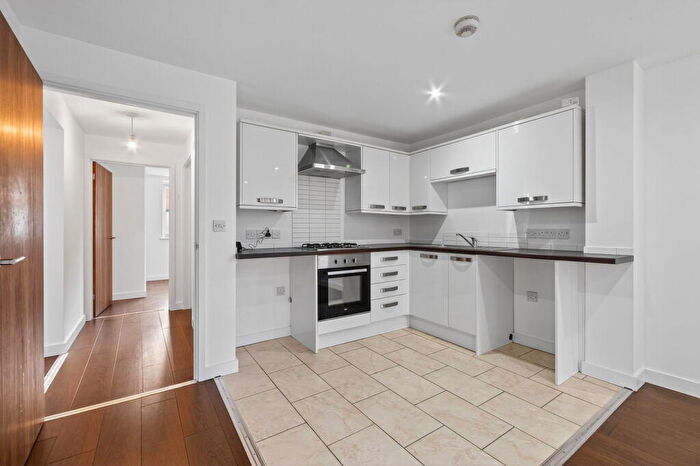
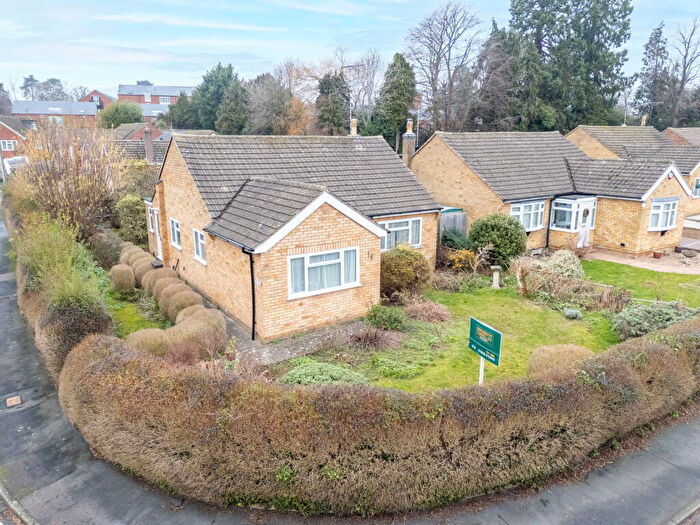
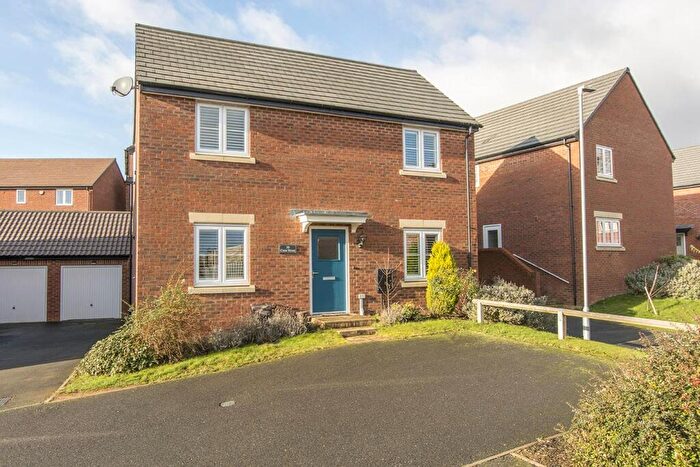
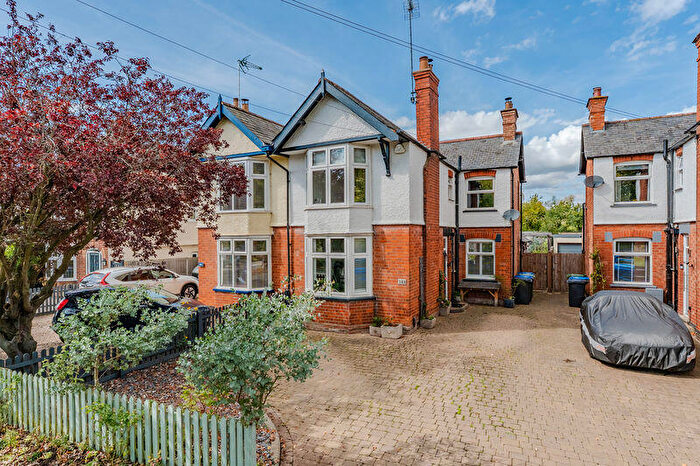
Houses for sale & to rent in Market Harborough-logan, Market Harborough
House Prices in Market Harborough-logan
Properties in Market Harborough-logan have an average house price of £358,347.00 and had 169 Property Transactions within the last 3 years¹.
Market Harborough-logan is an area in Market Harborough, Leicestershire with 1,864 households², where the most expensive property was sold for £1,250,000.00.
Properties for sale in Market Harborough-logan
Roads and Postcodes in Market Harborough-logan
Navigate through our locations to find the location of your next house in Market Harborough-logan, Market Harborough for sale or to rent.
| Streets | Postcodes |
|---|---|
| Abbey Mews | LE16 9AT |
| Abbey Street | LE16 9AA |
| Adamswood Close | LE16 9QD |
| Admiral Court | LE16 9AZ |
| Angel Street | LE16 9QG |
| Austins Close | LE16 9BJ |
| Beech Avenue | LE16 7GX |
| Bindley Court | LE16 9EZ |
| Brookfield Road | LE16 9DU |
| Brooklands Gardens | LE16 9HS LE16 9BU |
| Charles Street | LE16 9AB |
| Cherry Tree Drive | LE16 7GW |
| Clarke Street | LE16 9AD |
| Coventry Road | LE16 9BX LE16 9BY LE16 9BZ LE16 9DA LE16 9BT LE16 9DB |
| Dell Park Place | LE16 7GT |
| Dogwood Drive | LE16 7BP |
| East Street | LE16 9AE |
| Fairfield Road | LE16 9QH LE16 9QJ LE16 9QQ LE16 9RA |
| Fairway | LE16 9QL |
| Farndale View | LE16 9FA |
| Fieldhead Close | LE16 9DZ |
| Gardiner Street | LE16 9QN LE16 9QW |
| Goddard Court | LE16 7JN |
| Goward Street | LE16 9AF |
| Harcourt Street | LE16 9AG |
| Hearth Street | LE16 9AH LE16 9AQ LE16 9FU |
| High Street | LE16 7NL LE16 7NJ LE16 7NN LE16 7NR LE16 7NX |
| Highcross Street | LE16 9AJ |
| Highfield Street | LE16 9AL LE16 9AN |
| Hill Gardens | LE16 9EB |
| Hill Top Close | LE16 9DE |
| Hillcrest Avenue | LE16 7AR |
| Horsefair Close | LE16 9QP |
| Knoll Street | LE16 9QR |
| Leicester Road | LE16 7AP LE16 7AZ LE16 7AY LE16 7BN |
| Logan Court | LE16 9QS |
| Logan Crescent | LE16 9QT |
| Logan Street | LE16 9AP LE16 9AR LE16 9AS LE16 9AW |
| Lubenham Hill | LE16 9DG LE16 9DQ |
| Manor Walk | LE16 9BP |
| Millers Gardens | LE16 9FE |
| Morley Street | LE16 9AU |
| Nelson Street | LE16 9AX LE16 9AY |
| Norbury Close | LE16 9BH |
| Northampton Road | LE16 9HB |
| Northleigh Grove | LE16 9QU LE16 9QX |
| Old School Mews | LE16 9PZ |
| Rhodes Close | LE16 9FB |
| Riley Close | LE16 9FF |
| School Lane | LE16 9DJ |
| Southleigh Grove | LE16 9QY |
| Spencer Street | LE16 9BA |
| Spinney Close | LE16 9DY |
| Springhill Gardens | LE16 9FD |
| Stevens Street | LE16 9BB |
| Sturgis Road | LE16 7BE |
| Sycamore Road | LE16 7GU |
| Talbot Yard | LE16 7NP |
| The Commons | LE16 7QL |
| The Firs | LE16 9BW |
| The Pastures | LE16 9EA |
| The Square | LE16 7PD LE16 7PE |
| The Wharf | LE16 7BH |
| The Woodlands | LE16 7BW |
| Union Wharf | LE16 7UW LE16 7UY |
| Victoria Avenue | LE16 7AN |
| Wartnaby Street | LE16 9BD LE16 9BE |
| Westfield Close | LE16 9DX |
| Windmill Road | LE16 7QW |
| Yeomanry Court | LE16 9BL |
| LE16 7QS |
Transport near Market Harborough-logan
-
Market Harborough Station
-
Corby Station
-
Kettering Station
-
South Wigston Station
-
Narborough Station
-
Leicester Station
-
Long Buckby Station
- FAQ
- Price Paid By Year
- Property Type Price
Frequently asked questions about Market Harborough-logan
What is the average price for a property for sale in Market Harborough-logan?
The average price for a property for sale in Market Harborough-logan is £358,347. This amount is 5% lower than the average price in Market Harborough. There are 1,056 property listings for sale in Market Harborough-logan.
What streets have the most expensive properties for sale in Market Harborough-logan?
The streets with the most expensive properties for sale in Market Harborough-logan are The Woodlands at an average of £975,333, Millers Gardens at an average of £603,333 and Farndale View at an average of £575,000.
What streets have the most affordable properties for sale in Market Harborough-logan?
The streets with the most affordable properties for sale in Market Harborough-logan are East Street at an average of £177,500, Stevens Street at an average of £197,588 and Hearth Street at an average of £198,600.
Which train stations are available in or near Market Harborough-logan?
Some of the train stations available in or near Market Harborough-logan are Market Harborough, Corby and Kettering.
Property Price Paid in Market Harborough-logan by Year
The average sold property price by year was:
| Year | Average Sold Price | Price Change |
Sold Properties
|
|---|---|---|---|
| 2025 | £321,327 | -12% |
39 Properties |
| 2024 | £358,591 | -7% |
70 Properties |
| 2023 | £382,125 | 15% |
60 Properties |
| 2022 | £323,607 | -5% |
82 Properties |
| 2021 | £339,880 | 4% |
104 Properties |
| 2020 | £325,753 | 7% |
59 Properties |
| 2019 | £302,873 | -11% |
67 Properties |
| 2018 | £336,102 | 12% |
75 Properties |
| 2017 | £296,013 | 4% |
74 Properties |
| 2016 | £285,496 | 9% |
68 Properties |
| 2015 | £259,911 | -4% |
76 Properties |
| 2014 | £269,939 | 16% |
103 Properties |
| 2013 | £226,244 | -2% |
69 Properties |
| 2012 | £231,775 | -7% |
64 Properties |
| 2011 | £247,068 | 1% |
75 Properties |
| 2010 | £245,788 | 21% |
92 Properties |
| 2009 | £193,318 | -16% |
87 Properties |
| 2008 | £224,597 | 7% |
62 Properties |
| 2007 | £209,563 | 3% |
106 Properties |
| 2006 | £202,622 | 2% |
128 Properties |
| 2005 | £199,146 | 4% |
90 Properties |
| 2004 | £191,128 | 6% |
89 Properties |
| 2003 | £179,377 | 28% |
116 Properties |
| 2002 | £129,536 | 20% |
126 Properties |
| 2001 | £103,860 | -17% |
129 Properties |
| 2000 | £121,102 | 24% |
152 Properties |
| 1999 | £91,452 | 10% |
176 Properties |
| 1998 | £82,578 | 18% |
100 Properties |
| 1997 | £67,941 | -5% |
103 Properties |
| 1996 | £71,376 | 14% |
105 Properties |
| 1995 | £61,532 | - |
85 Properties |
Property Price per Property Type in Market Harborough-logan
Here you can find historic sold price data in order to help with your property search.
The average Property Paid Price for specific property types in the last three years are:
| Property Type | Average Sold Price | Sold Properties |
|---|---|---|
| Semi Detached House | £357,091.00 | 51 Semi Detached Houses |
| Detached House | £538,193.00 | 49 Detached Houses |
| Terraced House | £252,850.00 | 56 Terraced Houses |
| Flat | £139,840.00 | 13 Flats |

