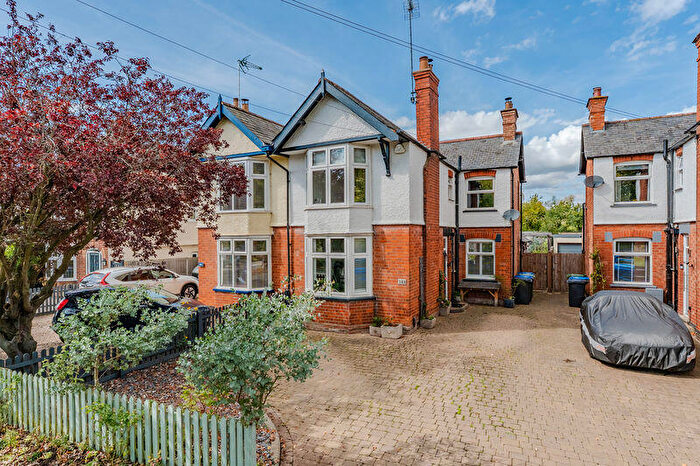
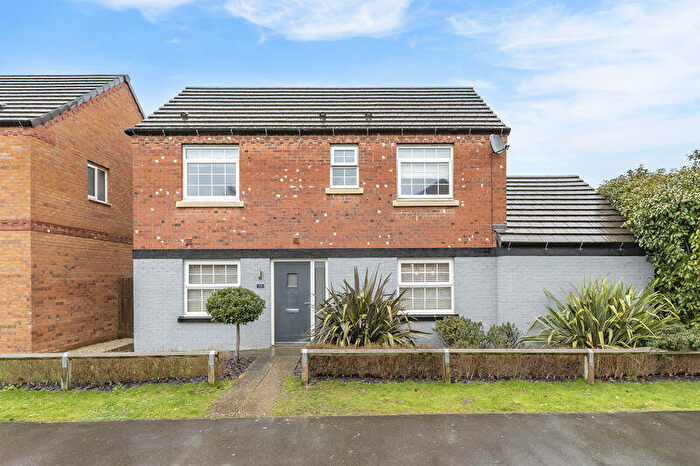
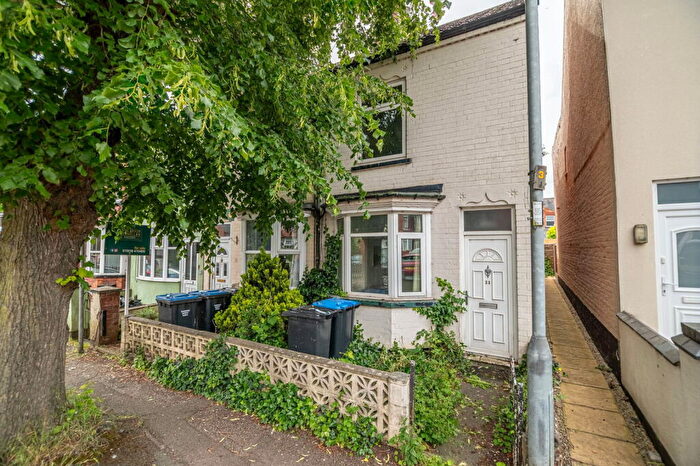
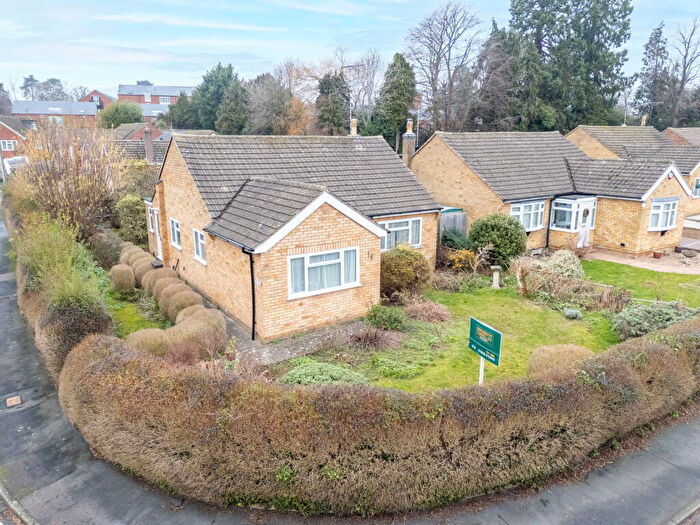
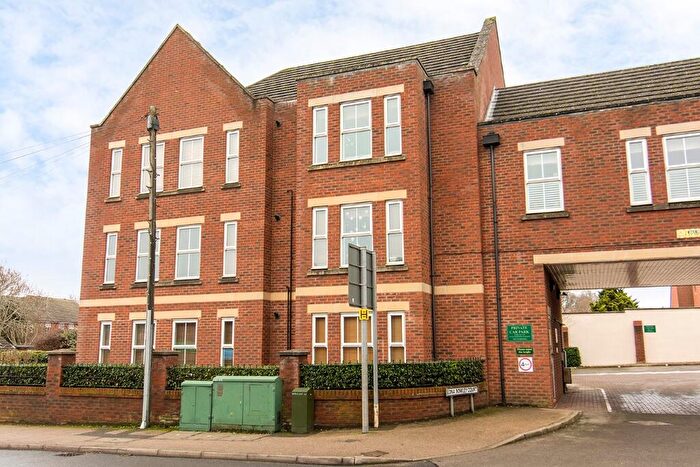
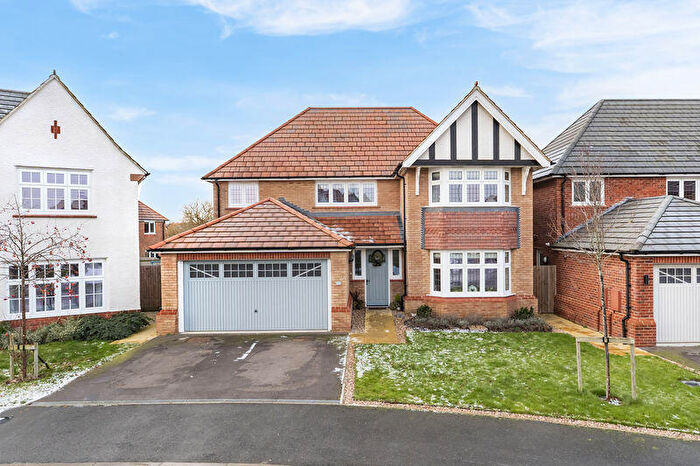
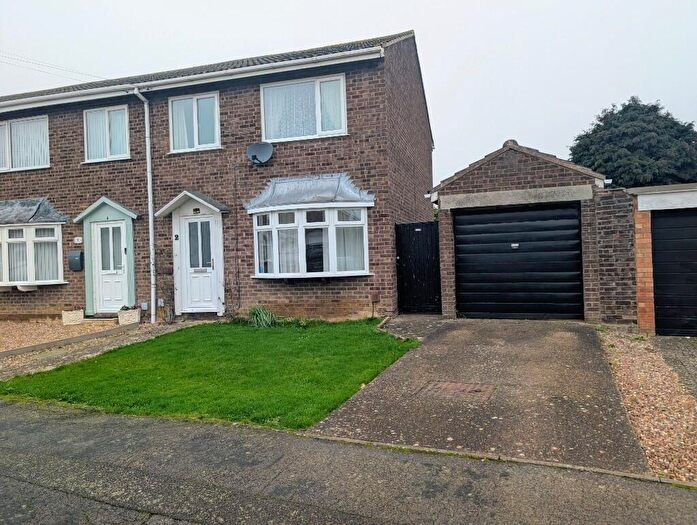
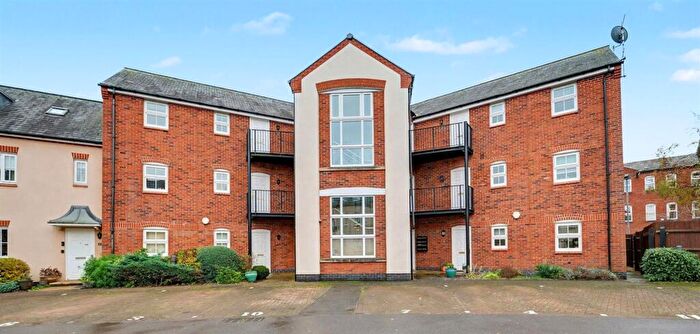
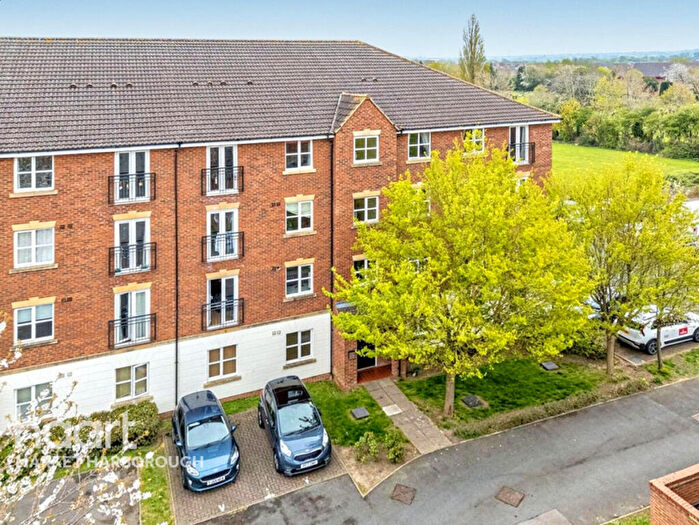
Houses for sale & to rent in Market Harborough-welland, Market Harborough
House Prices in Market Harborough-welland
Properties in Market Harborough-welland have an average house price of £322,491.00 and had 695 Property Transactions within the last 3 years¹.
Market Harborough-welland is an area in Market Harborough, Leicestershire with 2,743 households², where the most expensive property was sold for £764,995.00.
Properties for sale in Market Harborough-welland
Roads and Postcodes in Market Harborough-welland
Navigate through our locations to find the location of your next house in Market Harborough-welland, Market Harborough for sale or to rent.
| Streets | Postcodes |
|---|---|
| Bath Street | LE16 9EW LE16 9EJ LE16 9EL LE16 9JL |
| Advent Walk | LE16 9GX |
| Angell Drive | LE16 9GJ LE16 9JE |
| Argyle Park | LE16 9JH |
| Astley Close | LE16 9NL |
| Auriga Street | LE16 9EH |
| Balfour Gardens | LE16 9JJ |
| Bantry Close | LE16 9HJ |
| Barley Way | LE16 9FQ |
| Barnard Gardens | LE16 9JQ |
| Bishop Close | LE16 9NE |
| Blackhorse Drive | LE16 9NS |
| Bradford Street | LE16 9FJ |
| Bridegroom Street | LE16 9GL LE16 9GZ |
| Brington Close | LE16 9GT |
| Brulow Close | LE16 9GQ |
| Burford Close | LE16 9LF |
| Burton Street | LE16 9GH LE16 9GY |
| Butler Gardens | LE16 9LY |
| Caxton Street | LE16 9EP LE16 9ER |
| Charley Close | LE16 9GW |
| Cherry Avenue | LE16 9NQ |
| Cheviot Close | LE16 9JD |
| Clipston Street | LE16 9FH |
| Corn Street | LE16 9FR |
| Cromwell Crescent | LE16 9JN LE16 9JP LE16 9JR LE16 9JW |
| Crosby Road | LE16 9EE |
| Cross Street | LE16 9ES |
| Dallison Close | LE16 9LA |
| Dandy Drive | LE16 9PX |
| Delisle Close | LE16 9NN |
| Edmund Close | LE16 9LH |
| Elm Drive | LE16 9DS |
| Essex Gardens | LE16 9JS |
| Fairfax Road | LE16 9JT LE16 9JU |
| Farndon Court | LE16 9BN |
| Farndon Road | LE16 9NP LE16 9NW LE16 9NR |
| Fleetwood Close | LE16 9JX |
| Fleetwood Gardens | LE16 9LX |
| Florence Grove | LE16 9NY |
| Forester Close | LE16 9JA |
| Fount Court | LE16 9GF |
| Freshman Way | LE16 9GN |
| Gerrard Gardens | LE16 9JG |
| Gladstone Street | LE16 9ET |
| Granville Street | LE16 9EU LE16 9EX |
| Green Lane | LE16 9JZ |
| Grenville Gardens | LE16 9PT |
| Haddonian Road | LE16 9GD |
| Harrison Close | LE16 9LZ |
| Harvest Road | LE16 9FL LE16 9FN |
| Henry Road | LE16 9PY |
| Hops Close | LE16 9FS |
| Hopton Fields | LE16 9LB |
| Howard Way | LE16 9LD |
| Huntingdon Gardens | LE16 9LE |
| Hurlingham Road | LE16 9GB |
| Ireton Road | LE16 9NT LE16 9NU |
| Jackson Close | LE16 9ND |
| Kildare Close | LE16 9JB |
| Langdale Walk | LE16 9LG |
| Lathkill Street | LE16 9EN LE16 9EY |
| Lenthall Square | LE16 9LQ |
| Liberator Drive | LE16 9FZ |
| Limner Street | LE16 9HN LE16 9HQ |
| Lindsey Gardens | LE16 9JF |
| Marmion Close | LE16 9GS |
| Maurice Road | LE16 9NB |
| Measham Close | LE16 9HH |
| Medora Close | LE16 9GR |
| Montrose Close | LE16 9LJ |
| Naseby Close | LE16 9NX |
| Naseby Square | LE16 9PA |
| Newcombe Street | LE16 9PB |
| Nithsdale Avenue | LE16 9PD LE16 9PE |
| Nithsdale Crescent | LE16 9HA |
| Northampton Road | LE16 9HE LE16 9HF |
| Patrick Street | LE16 9HP |
| Pear Tree Gardens | LE16 9QA |
| Pride Place | LE16 9PF |
| Rainsborough Gardens | LE16 9LN LE16 9LW |
| Ritchie Park | LE16 9LP |
| Rochester Gardens | LE16 9LR |
| Rowan Avenue | LE16 9LS |
| Rugby Close | LE16 9QZ |
| Rupert Road | LE16 9LT LE16 9LU |
| Selby Close | LE16 9NF |
| Selby Place | LE16 9GP |
| Skippon Close | LE16 9PG |
| Southwold Close | LE16 9GU |
| Sovereign Park | LE16 9EF |
| Sovereign Park Industrial Estate | LE16 9EG |
| Stamford Close | LE16 9ED |
| Steeplechase Way | LE16 9FX LE16 9FY |
| Stratton Close | LE16 9LL |
| Stuart Road | LE16 9PH LE16 9PJ LE16 9PQ |
| Summers Way | LE16 9QE |
| Sutton Court | LE16 9EQ |
| The Furrow | LE16 9FT |
| The Print Works | LE16 9FG |
| Torch Way | LE16 9HL |
| Tungstone Way | LE16 9GA LE16 9GG |
| Vaughan Close | LE16 9NG |
| Vislok Close | LE16 9GE |
| Walcot Road | LE16 9DL |
| Watson Avenue | LE16 9NA |
| Welland Park Road | LE16 9DN LE16 9DP LE16 9DR LE16 9DW |
| Western Avenue | LE16 9PL LE16 9PN LE16 9PW |
| Wheat Close | LE16 9FP |
| Willow Crescent | LE16 9DT |
| LE16 9JY LE16 9NZ LE16 9RB |
Transport near Market Harborough-welland
-
Market Harborough Station
-
Kettering Station
-
Corby Station
-
South Wigston Station
-
Narborough Station
-
Leicester Station
-
Long Buckby Station
- FAQ
- Price Paid By Year
- Property Type Price
Frequently asked questions about Market Harborough-welland
What is the average price for a property for sale in Market Harborough-welland?
The average price for a property for sale in Market Harborough-welland is £322,491. This amount is 12% lower than the average price in Market Harborough. There are 741 property listings for sale in Market Harborough-welland.
What streets have the most expensive properties for sale in Market Harborough-welland?
The streets with the most expensive properties for sale in Market Harborough-welland are Blackhorse Drive at an average of £485,215, Bantry Close at an average of £472,980 and Nithsdale Crescent at an average of £430,000.
What streets have the most affordable properties for sale in Market Harborough-welland?
The streets with the most affordable properties for sale in Market Harborough-welland are Stamford Close at an average of £85,928, The Print Works at an average of £171,312 and Fount Court at an average of £172,000.
Which train stations are available in or near Market Harborough-welland?
Some of the train stations available in or near Market Harborough-welland are Market Harborough, Kettering and Corby.
Property Price Paid in Market Harborough-welland by Year
The average sold property price by year was:
| Year | Average Sold Price | Price Change |
Sold Properties
|
|---|---|---|---|
| 2025 | £310,707 | -2% |
120 Properties |
| 2024 | £315,575 | -9% |
171 Properties |
| 2023 | £345,080 | 9% |
200 Properties |
| 2022 | £313,074 | 8% |
204 Properties |
| 2021 | £287,886 | -3% |
248 Properties |
| 2020 | £295,142 | 1% |
228 Properties |
| 2019 | £292,768 | 7% |
187 Properties |
| 2018 | £270,930 | 9% |
218 Properties |
| 2017 | £246,618 | 9% |
207 Properties |
| 2016 | £223,449 | 3% |
204 Properties |
| 2015 | £217,443 | -0,3% |
246 Properties |
| 2014 | £218,092 | 17% |
247 Properties |
| 2013 | £181,132 | -7% |
228 Properties |
| 2012 | £193,979 | 11% |
156 Properties |
| 2011 | £171,748 | -3% |
128 Properties |
| 2010 | £177,492 | 10% |
115 Properties |
| 2009 | £159,188 | -7% |
134 Properties |
| 2008 | £169,762 | -2% |
118 Properties |
| 2007 | £173,108 | 9% |
201 Properties |
| 2006 | £157,359 | 4% |
202 Properties |
| 2005 | £151,278 | 9% |
130 Properties |
| 2004 | £138,381 | 6% |
131 Properties |
| 2003 | £129,972 | 17% |
145 Properties |
| 2002 | £107,321 | 21% |
153 Properties |
| 2001 | £84,640 | 19% |
176 Properties |
| 2000 | £68,437 | 8% |
122 Properties |
| 1999 | £62,951 | 3% |
157 Properties |
| 1998 | £61,212 | 12% |
124 Properties |
| 1997 | £53,726 | 10% |
155 Properties |
| 1996 | £48,117 | 2% |
137 Properties |
| 1995 | £47,176 | - |
94 Properties |
Property Price per Property Type in Market Harborough-welland
Here you can find historic sold price data in order to help with your property search.
The average Property Paid Price for specific property types in the last three years are:
| Property Type | Average Sold Price | Sold Properties |
|---|---|---|
| Semi Detached House | £305,967.00 | 172 Semi Detached Houses |
| Detached House | £412,733.00 | 284 Detached Houses |
| Terraced House | £247,362.00 | 176 Terraced Houses |
| Flat | £170,686.00 | 63 Flats |

