
Houses for sale & to rent in Walgrave, Northampton
House Prices in Walgrave
Properties in Walgrave have an average house price of £524k and had 61 Property Transactions within the last 3 years¹.
Walgrave is an area in Northampton, Warwickshire with 793 households², where the most expensive property was sold for £1.51M.
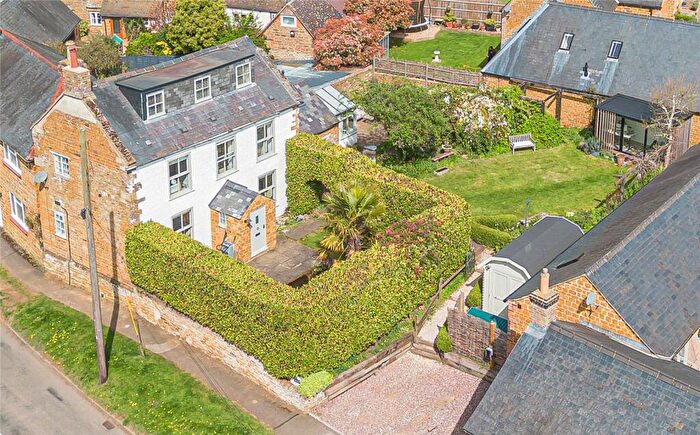
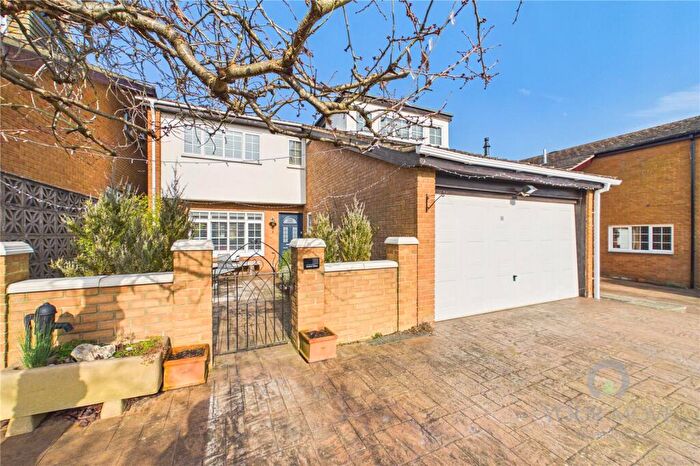
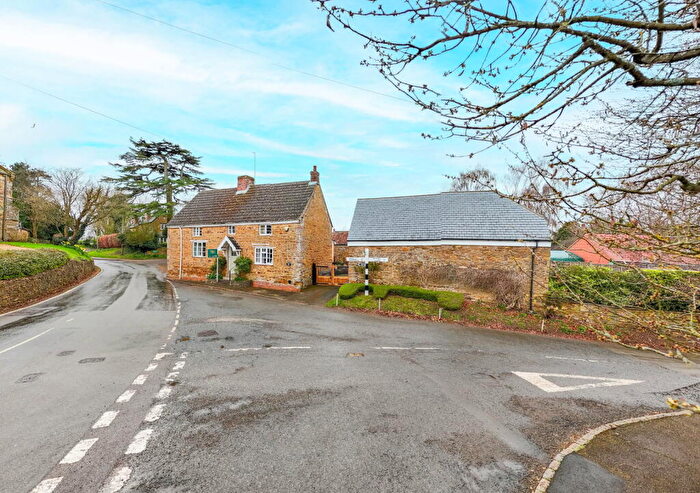
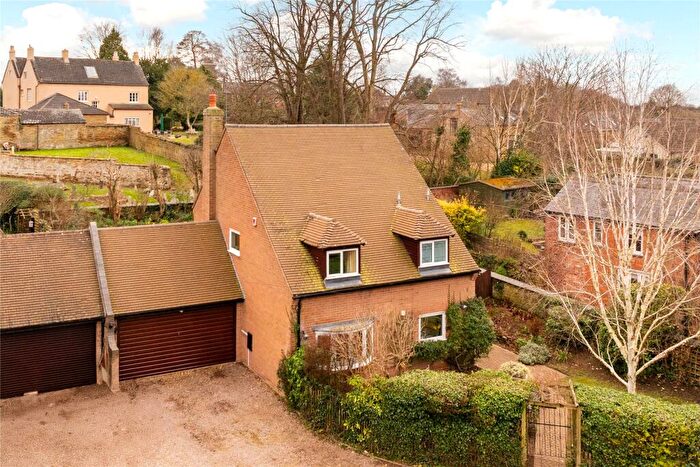
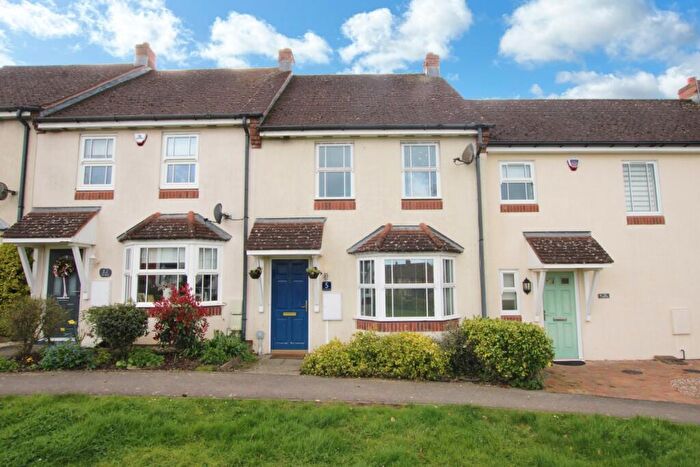
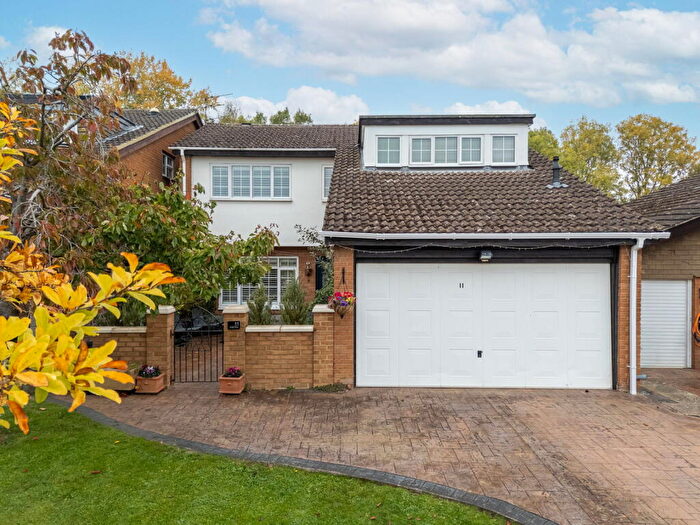
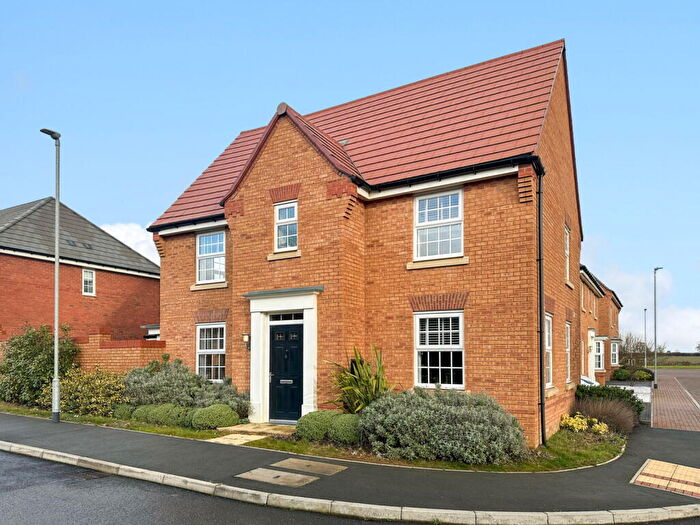
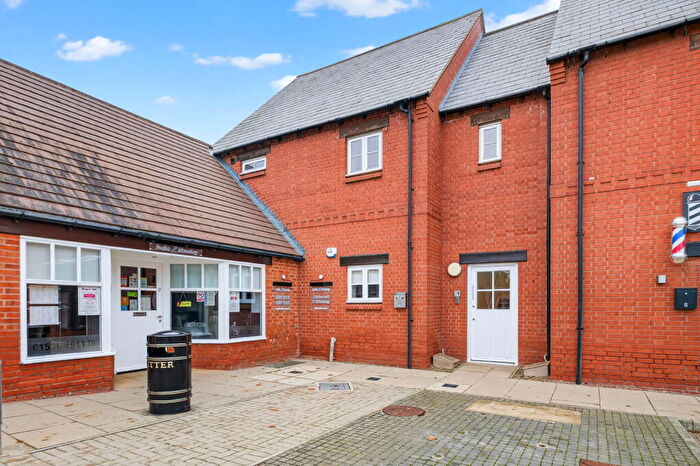
Properties for sale in Walgrave
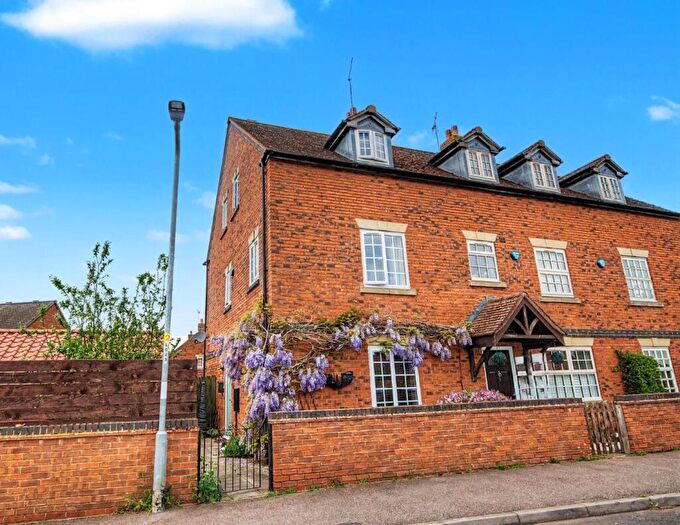
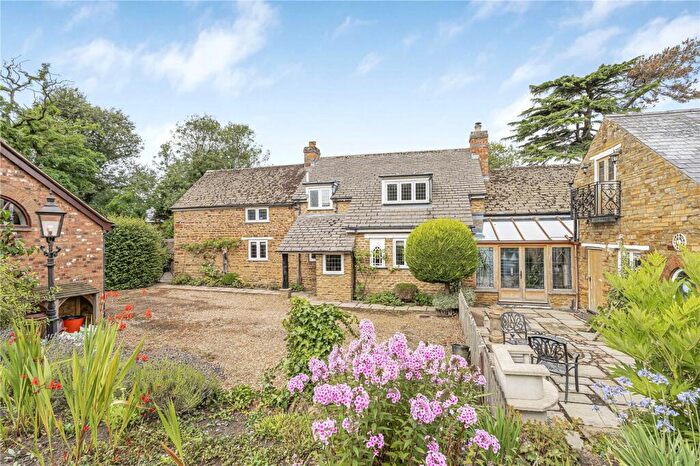
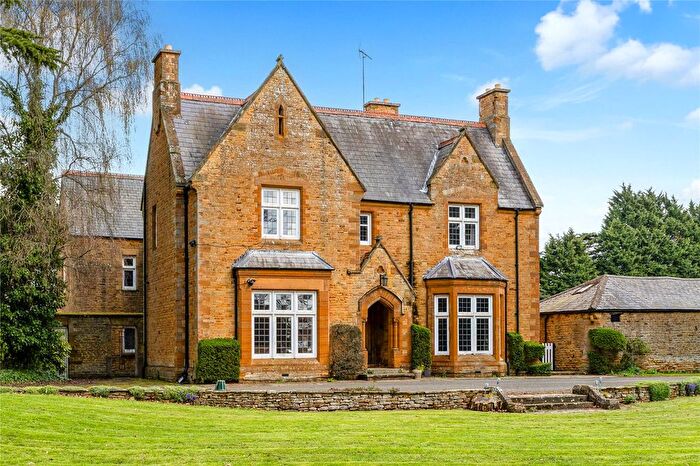
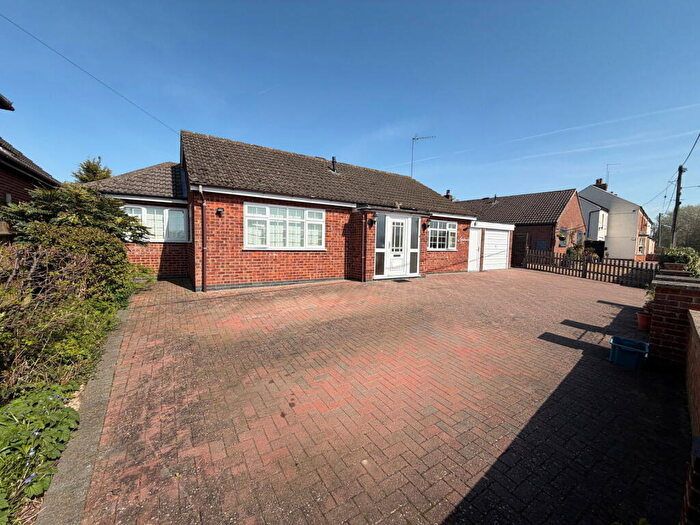
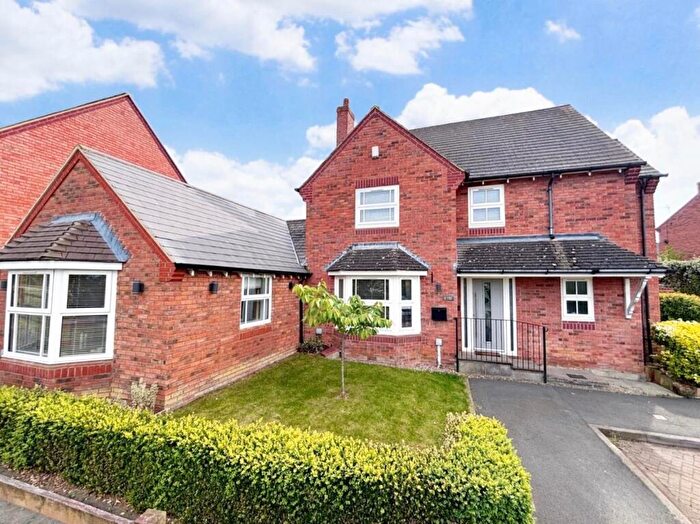
![]()
If you are looking to sell your house, let it out, or receive a property valuation, an expert can help you.
Click the button below to get started.
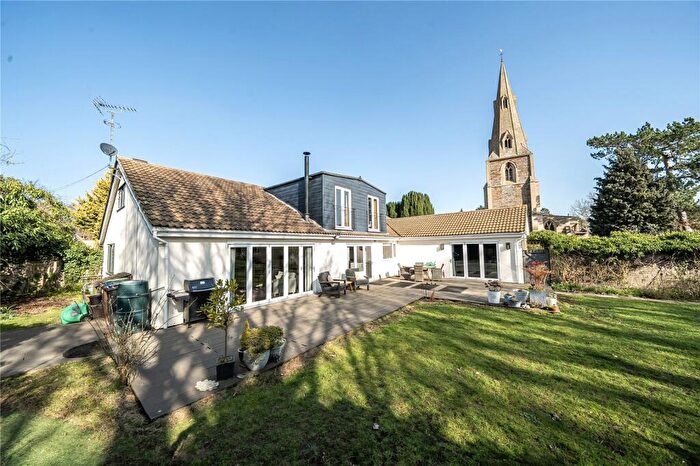
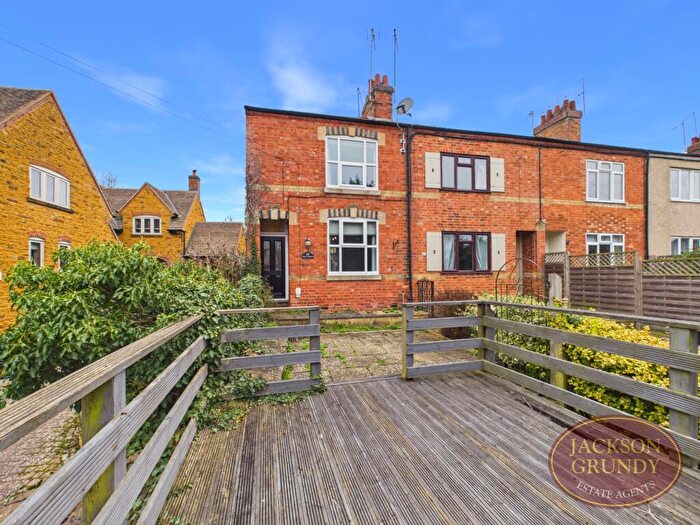

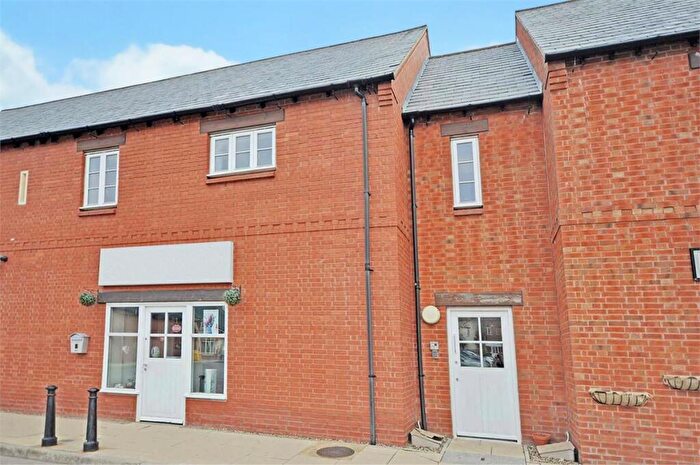

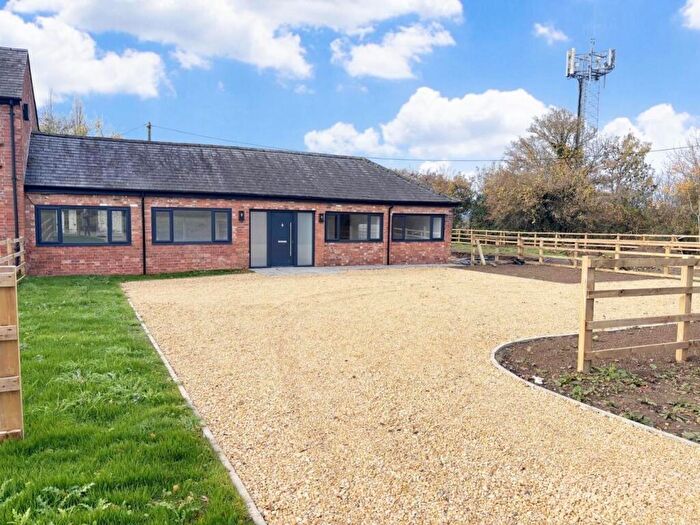
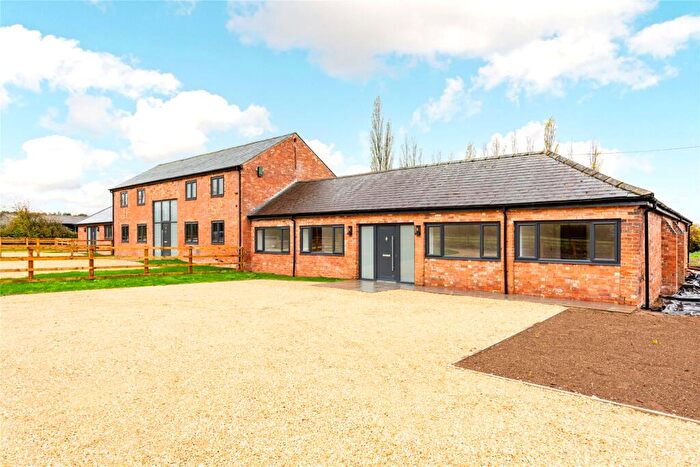
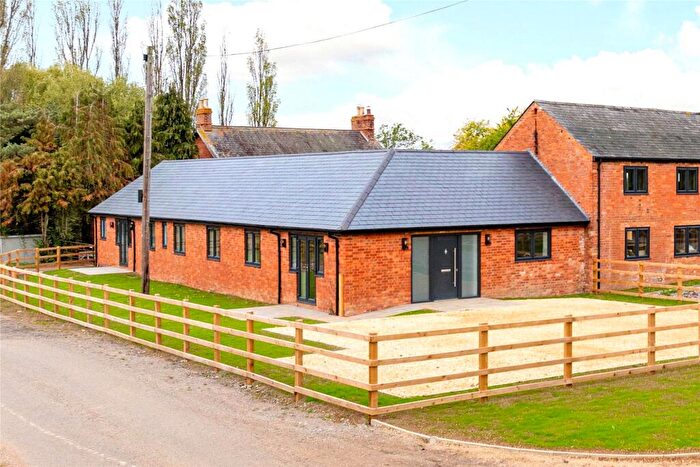
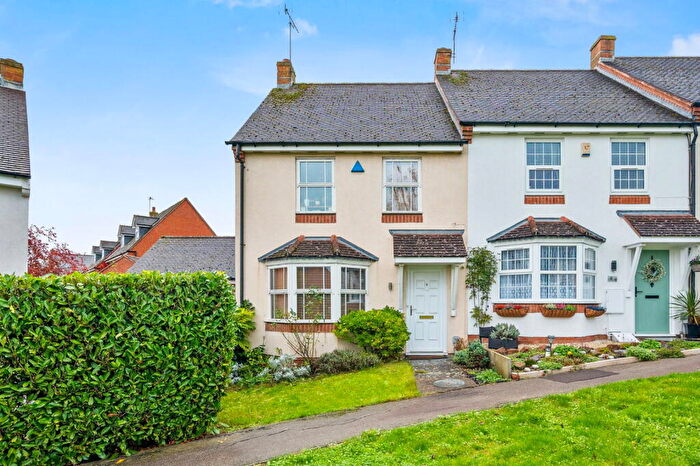
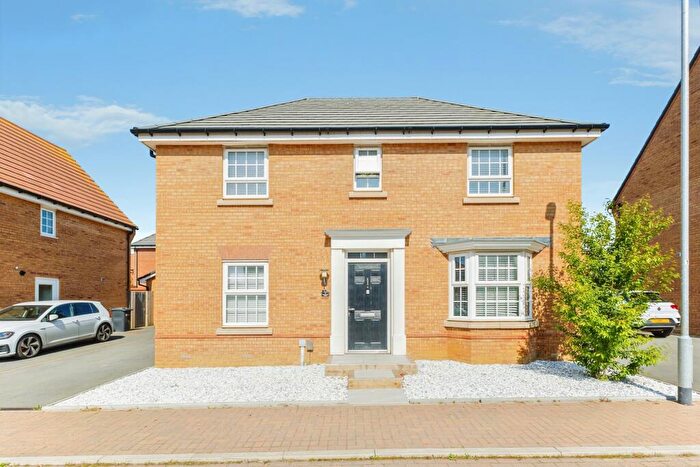
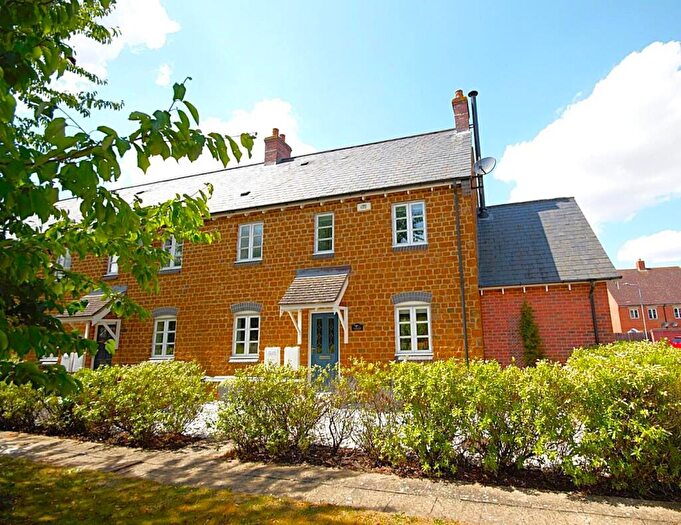
Previously listed properties in Walgrave
Roads and Postcodes in Walgrave
Navigate through our locations to find the location of your next house in Walgrave, Northampton for sale or to rent.
| Streets | Postcodes |
|---|---|
| Amber Drive | NN6 9RW |
| Back Lane | NN6 9SL |
| Bakers Lane | NN6 9QL |
| Barnes Close | NN6 9HR |
| Bridle Road | NN6 9QY NN6 9SY |
| Brittens View | NN6 9SF |
| Brixworth Road | NN6 9SJ |
| Broomecroft | NN6 9FH |
| Broughton Road | NN6 9RH |
| Chapel Lane | NN6 9RD |
| Charles Close | NN6 9RQ |
| Cherry Hill | NN6 9EN |
| Church Lane | NN6 9QH NN6 9QZ |
| Church View | NN6 9PQ |
| Cleavers Lane | NN6 9RG |
| Farm Close | NN6 9SG |
| Faxton End | NN6 9RF |
| Glebe Close | NN6 9TF |
| Gold Street | NN6 9QE |
| Hannington Lane | NN6 9QG |
| Harrington Road | NN6 9RJ |
| Hill Close | NN6 9QT |
| Holcot Road | NN6 9QN NN6 9QP |
| Jubilee Drive | NN6 9PR |
| Kettering Road | NN6 9PH NN6 9TD NN6 9TE |
| Lamport Road | NN6 9RA |
| Langham Place | NN6 9PP |
| Lower Green | NN6 9QF |
| Main Street | NN6 9SP NN6 9SU |
| Manor Farm Close | NN6 9XD |
| Mill Lane | NN6 9YA |
| Moulton Road | NN6 9SH |
| Newland Road | NN6 9PZ |
| Northall | NN6 9QD |
| Old Road | NN6 9QW |
| Orchard Close | NN6 9HH |
| Paddocks Close | NN6 9XJ |
| Poplars Farm Close | NN6 9GL |
| Poplars Lane | NN6 9SW |
| Rectory Lane | NN6 9QJ NN6 9SR |
| Red Hill Court | NN6 9QR |
| Redhouse Lane | NN6 9SZ |
| Scaldwell Road | NN6 9RB |
| School Lane | NN6 9ST |
| Sheldons Lane | NN6 9PW |
| Silver Street | NN6 9QB |
| Springfield Road | NN6 9QS |
| Sywell Road | NN6 9SN |
| Top Green | NN6 9PL |
| Townsend Road | NN6 9QU |
| Turners Farm Close | NN6 9SD |
| Walgarth Court | NN6 9TL |
| Walgrave Road | NN6 9QX NN6 9SS NN6 9SX |
| Walkers Acre | NN6 9TP |
| Walkers Works | NN6 9TQ |
| West Farm Close | NN6 9SE |
| Winsland Court | NN6 9SA |
| Zion Hill | NN6 9PN |
| NN6 9PY NN6 9RL |
Transport near Walgrave

- FAQ
- Price Paid By Year
- Property Type Price
Frequently asked questions about Walgrave
What is the average price for a property for sale in Walgrave?
The average price for a property for sale in Walgrave is £524,381. This amount is 26% higher than the average price in Northampton. There are 308 property listings for sale in Walgrave.
What streets have the most expensive properties for sale in Walgrave?
The streets with the most expensive properties for sale in Walgrave are Sheldons Lane at an average of £961,250, Gold Street at an average of £919,000 and Holcot Road at an average of £901,000.
What streets have the most affordable properties for sale in Walgrave?
The streets with the most affordable properties for sale in Walgrave are Back Lane at an average of £196,000, Northall at an average of £235,000 and Hill Close at an average of £260,000.
Which train stations are available in or near Walgrave?
Some of the train stations available in or near Walgrave are Kettering, Wellingborough and Northampton.
Property Price Paid in Walgrave by Year
The average sold property price by year was:
| Year | Average Sold Price | Price Change |
Sold Properties
|
|---|---|---|---|
| 2026 | £235,000 | -105% |
1 Property |
| 2025 | £482,650 | -22% |
20 Properties |
| 2024 | £590,775 | 13% |
20 Properties |
| 2023 | £514,187 | -3% |
20 Properties |
| 2022 | £530,714 | 17% |
28 Properties |
| 2021 | £441,083 | 11% |
36 Properties |
| 2020 | £390,703 | -8% |
27 Properties |
| 2019 | £420,916 | 11% |
30 Properties |
| 2018 | £373,280 | -8% |
28 Properties |
| 2017 | £402,060 | 27% |
34 Properties |
| 2016 | £292,605 | -16% |
18 Properties |
| 2015 | £339,482 | 2% |
31 Properties |
| 2014 | £334,150 | -11% |
40 Properties |
| 2013 | £372,187 | 18% |
36 Properties |
| 2012 | £303,884 | -9% |
26 Properties |
| 2011 | £331,869 | -3% |
23 Properties |
| 2010 | £342,470 | -5% |
26 Properties |
| 2009 | £359,425 | 13% |
27 Properties |
| 2008 | £310,985 | -17% |
22 Properties |
| 2007 | £362,942 | 13% |
35 Properties |
| 2006 | £315,487 | 1% |
41 Properties |
| 2005 | £312,345 | 11% |
35 Properties |
| 2004 | £279,315 | 17% |
29 Properties |
| 2003 | £231,895 | -7% |
35 Properties |
| 2002 | £248,055 | 4% |
59 Properties |
| 2001 | £238,494 | 33% |
61 Properties |
| 2000 | £160,695 | 4% |
25 Properties |
| 1999 | £154,028 | 15% |
38 Properties |
| 1998 | £131,480 | 25% |
29 Properties |
| 1997 | £99,249 | -16% |
25 Properties |
| 1996 | £115,091 | -6% |
23 Properties |
| 1995 | £122,075 | - |
20 Properties |
Property Price per Property Type in Walgrave
Here you can find historic sold price data in order to help with your property search.
The average Property Paid Price for specific property types in the last three years are:
| Property Type | Average Sold Price | Sold Properties |
|---|---|---|
| Semi Detached House | £358,716.00 | 15 Semi Detached Houses |
| Detached House | £669,128.00 | 35 Detached Houses |
| Terraced House | £289,727.00 | 11 Terraced Houses |