
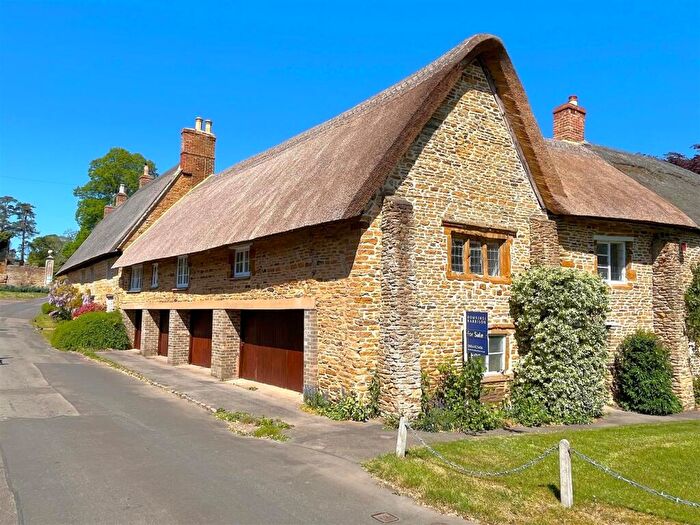
Houses for sale in Brixworth, Northampton
House Prices in Brixworth
Properties in Brixworth have an average house price of £347k and had 42 Property Transactions within the last 3 years¹.
Brixworth is an area in Northampton, Northamptonshire with 381 households², where the most expensive property was sold for £1.16M.
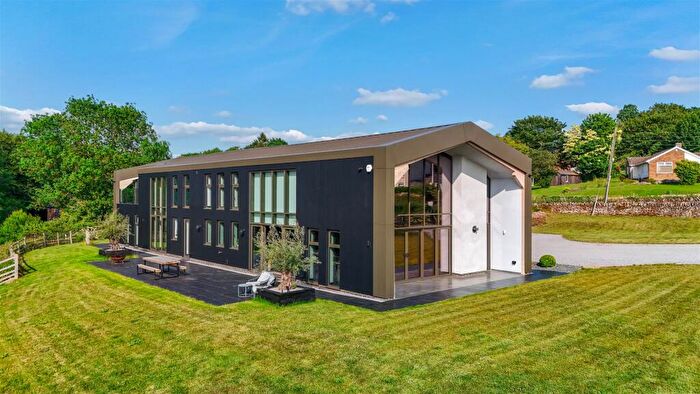
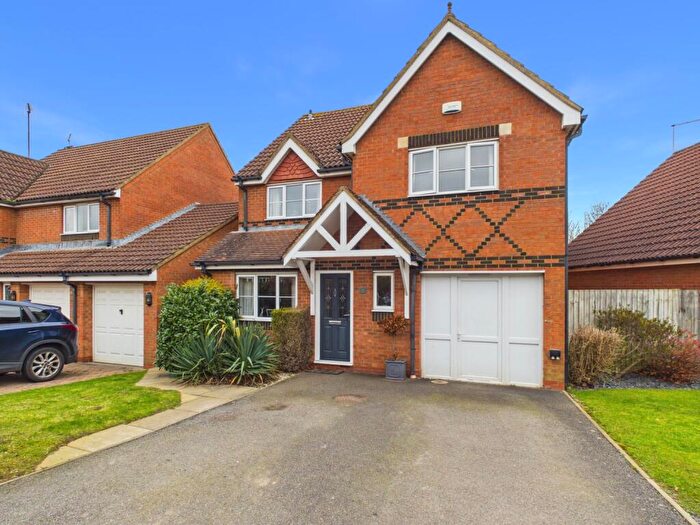
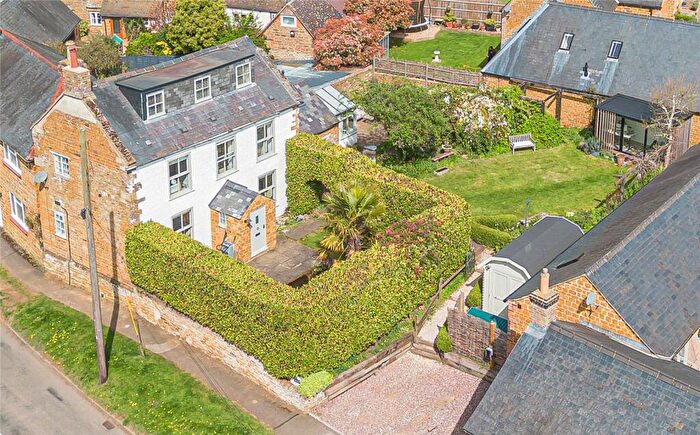
Properties for sale in Brixworth
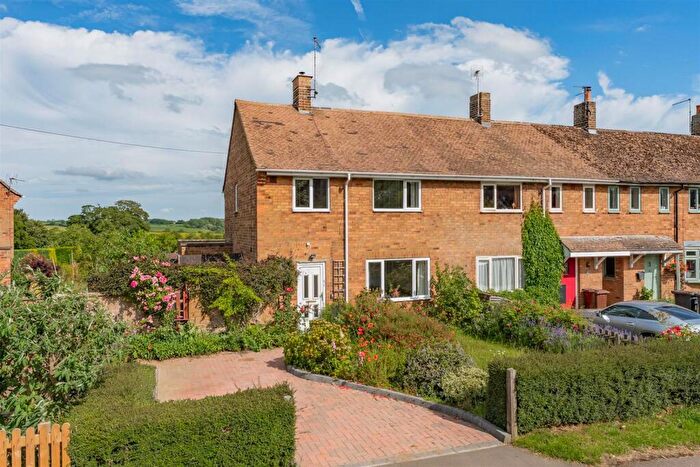
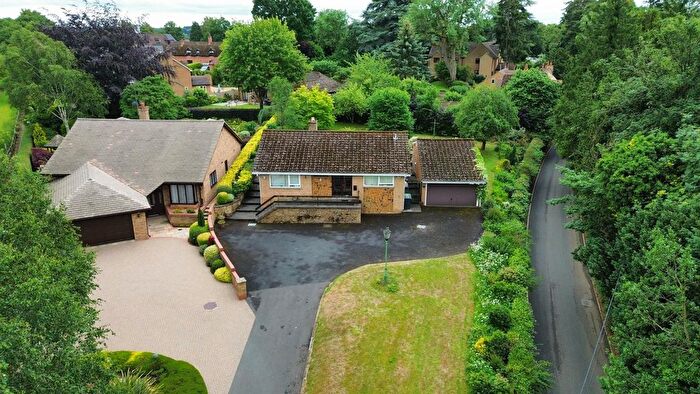
![]()
If you are looking to sell your house, let it out, or receive a property valuation, an expert can help you.
Click the button below to get started.

Roads and Postcodes in Brixworth
Navigate through our locations to find the location of your next house in Brixworth, Northampton for sale or to rent.
| Streets | Postcodes |
|---|---|
| A508 Brixworth Bypass | NN6 9WT |
| Andrews Court | NN6 9UF |
| Aspen Road | NN6 9WL |
| Bartlets Well | NN6 9FQ |
| Blackthorn Crescent | NN6 9WD |
| Blueberry Lane | NN6 9LS NN6 9XN |
| Brampton Way | NN6 9NJ |
| Elder Drive | NN6 9WR |
| Ferro Fields | NN6 9UA |
| Harborough Road | NN6 9ER |
| Harpers Mews | NN6 9FA |
| Hawthorn Road | NN6 9WP |
| Hazel Drive | NN6 9WN |
| Highfield Close | NN6 9FF |
| Highfield Mews | NN6 9LR |
| Holly Drive | NN6 9WJ |
| Hornbeam Row | NN6 9WG |
| Ironstone Close | NN6 9PD |
| Ironstone Way Industrial Estate | NN6 9UD |
| Kelmarsh Road | NN6 6BQ |
| Kennel Terrace | NN6 9AS |
| Merry Tom Lane | NN6 9GA |
| Mill Lane | NN6 9JT |
| Morgan Drive | NN6 9GZ |
| Naseby Road | NN6 6AR |
| Northampton Road | NN6 9WU NN6 9DG NN6 9DQ |
| Oak Row | NN6 9WQ |
| Old Road | NN6 9HF NN6 9HG NN6 9HQ |
| Quarry Road | NN6 9UB |
| Rothwell Road | NN6 9HJ NN6 9HL |
| Scaldwell Road | NN6 9YE |
| Swansnest | NN6 9FE |
| Vineyard Gardens | NN6 9FR |
| Willow Gardens | NN6 9WF |
| NN6 9HN NN6 9JG NN6 9EY NN6 9EZ NN6 9HD NN6 9HE NN6 9JD NN6 9JJ NN6 9JL NN6 9LU |
Property price trends in Brixworth
According to the latest Land Registry data, the average home in Brixworth sold for £472,000 in 2026. That figure comes from 290 sales logged over the past 21 years.
Prices have continued to climb over the last three years. Compared with 2023, when the typical sale came in around £400,749, that's a rise of roughly 17.8%.
Looking back five years, average prices are up about 48.9% since 2021, a gain of around £154,959 in cash terms.
Zoom out to the past decade for the fuller picture. Back in 2016, homes here averaged £299,979, so the typical sold price has climbed about 57.3% since then, roughly 4.6% a year.
Frequently asked questions about Brixworth
What is the average price for a property for sale in Brixworth?
The average price for a property for sale in Brixworth is £346,768. This amount is 22% higher than the average price in Northampton. There are 359 property listings for sale in Brixworth.
What streets have the most expensive properties for sale in Brixworth?
The streets with the most expensive properties for sale in Brixworth are Blackthorn Crescent at an average of £410,000, Hornbeam Row at an average of £392,166 and Willow Gardens at an average of £380,250.
What streets have the most affordable properties for sale in Brixworth?
The streets with the most affordable properties for sale in Brixworth are Highfield Mews at an average of £67,666, Highfield Close at an average of £68,666 and Holly Drive at an average of £276,500.
Which train stations are available in or near Brixworth?
Some of the train stations available in or near Brixworth are Northampton, Kettering and Long Buckby.
Property Price Paid in Brixworth by Year
The average sold property price by year was:
| Year | Average Sold Price | Price Change |
Sold Properties
|
|---|---|---|---|
| 2026 | £472,000 | 31% |
2 Properties |
| 2025 | £323,605 | 2% |
17 Properties |
| 2024 | £316,269 | -27% |
13 Properties |
| 2023 | £400,749 | 18% |
10 Properties |
| 2022 | £329,076 | 4% |
13 Properties |
| 2021 | £317,041 | -5% |
12 Properties |
| 2020 | £334,000 | 1% |
9 Properties |
| 2019 | £329,708 | -7% |
19 Properties |
| 2018 | £351,843 | 17% |
44 Properties |
| 2017 | £291,962 | -3% |
45 Properties |
Property Price per Property Type in Brixworth
Here you can find historic sold price data in order to help with your property search.
The average Property Paid Price for specific property types in the last three years are:
| Property Type | Average Sold Price | Sold Properties |
|---|---|---|
| Semi Detached House | £288,977.00 | 9 Semi Detached Houses |
| Detached House | £459,454.00 | 22 Detached Houses |
| Terraced House | £233,785.00 | 7 Terraced Houses |
| Flat | £54,750.00 | 4 Flats |
