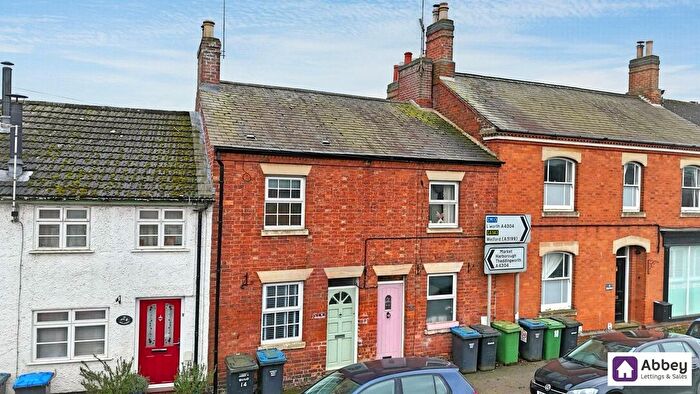
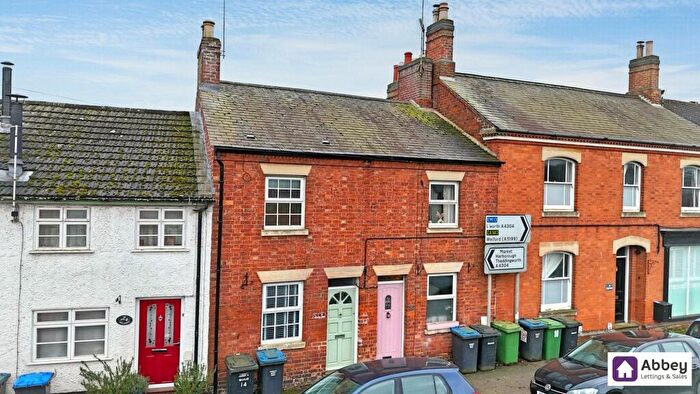
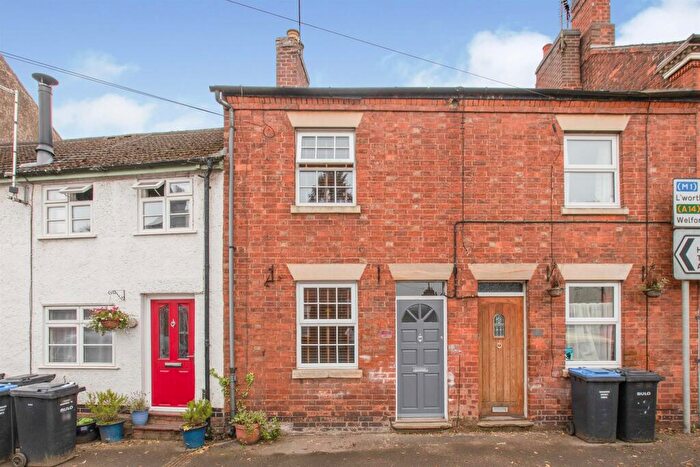
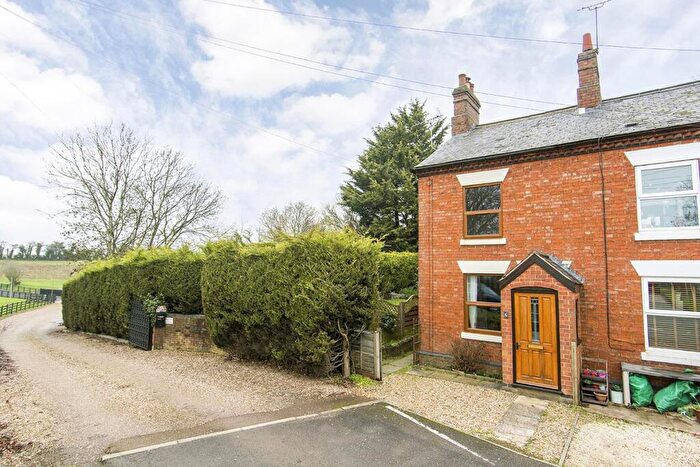
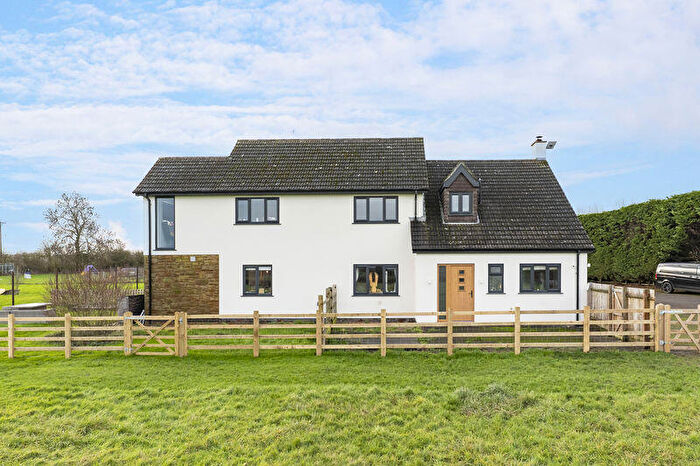
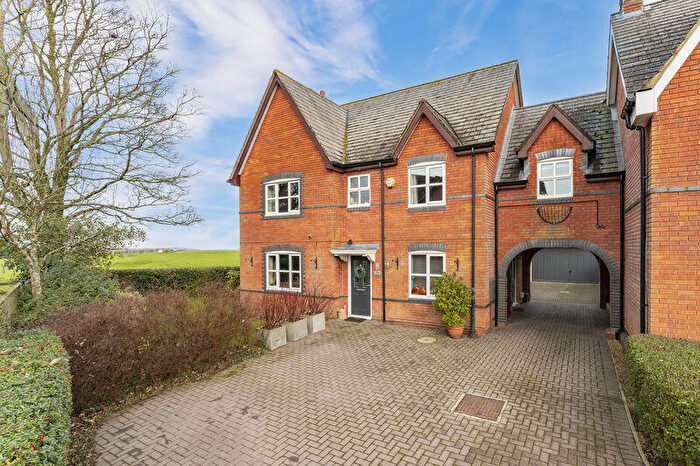
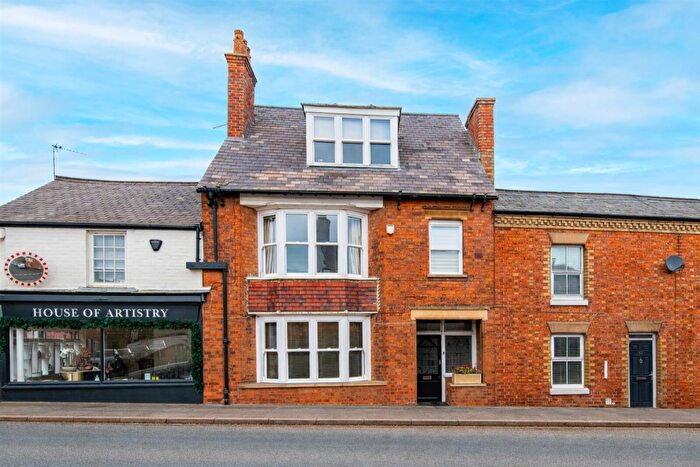
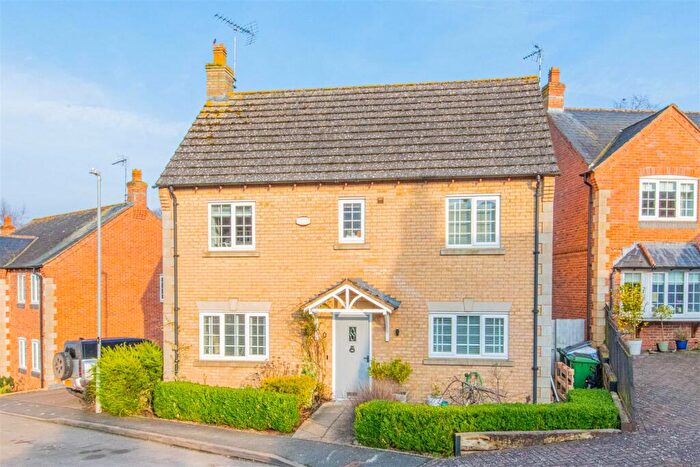
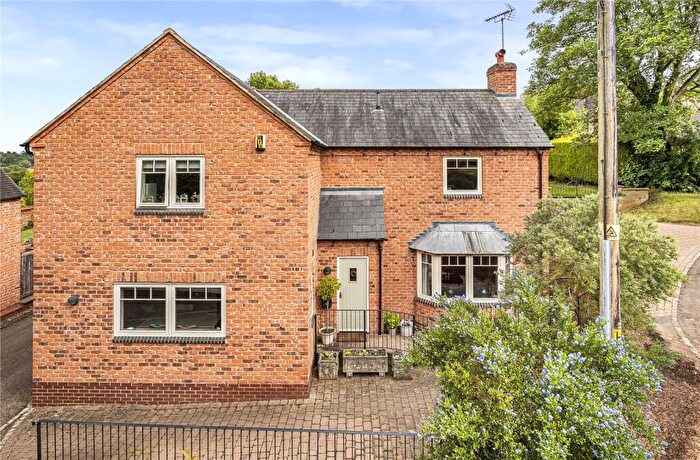
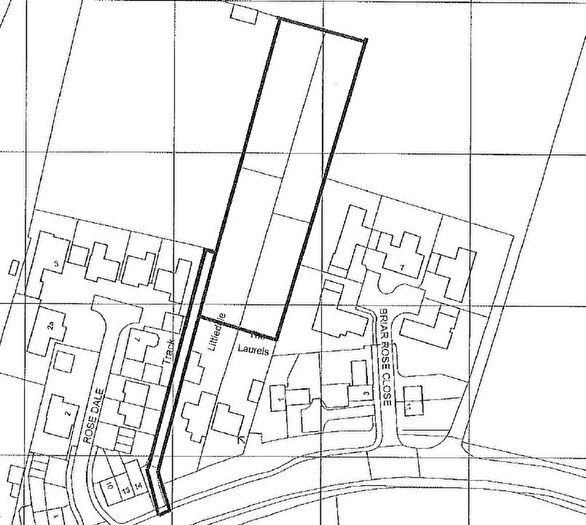
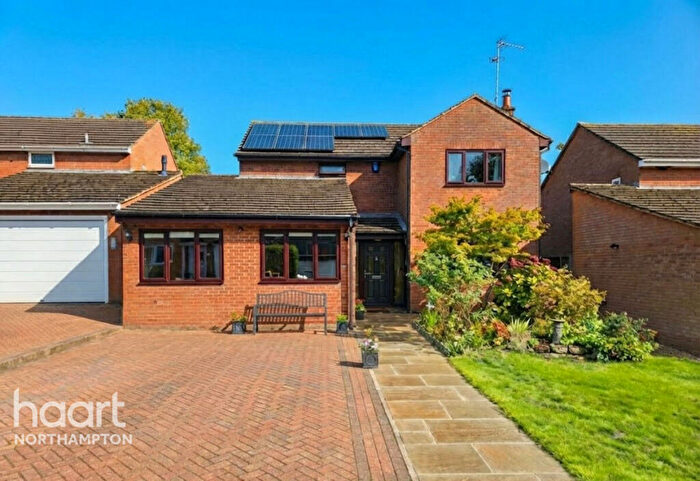
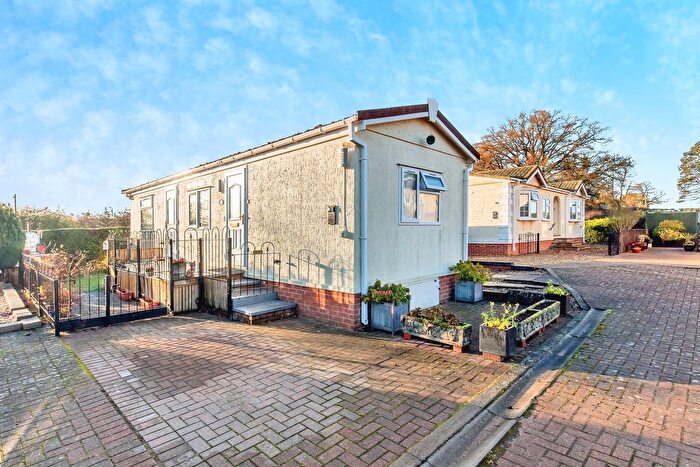
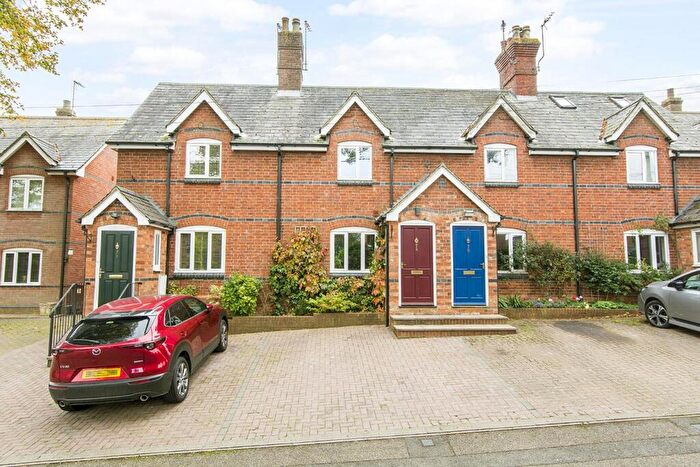
Houses for sale & to rent in Welford, Northampton
House Prices in Welford
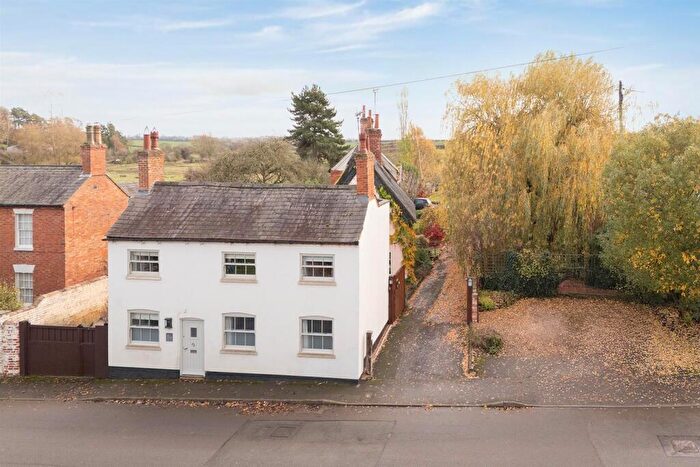
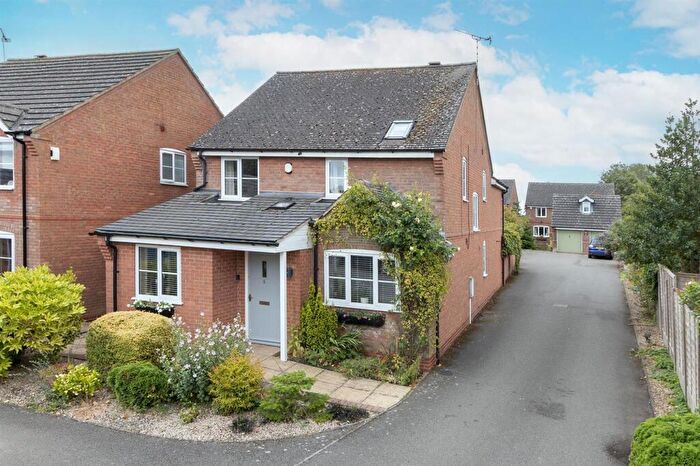
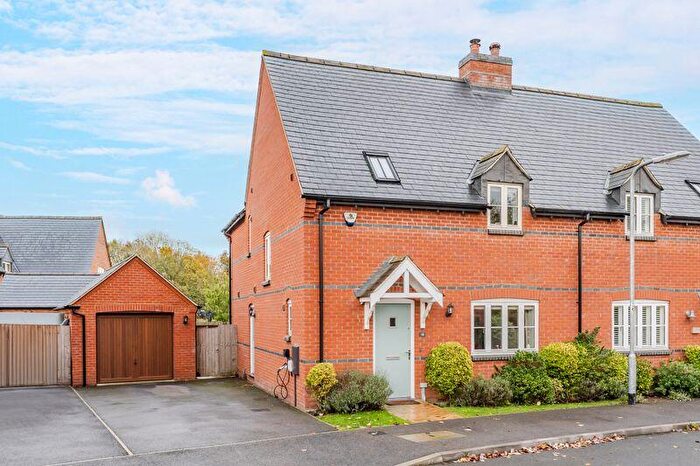
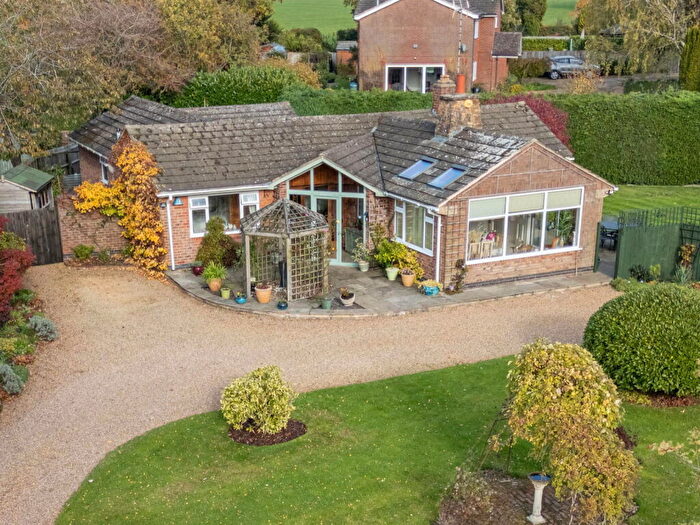
Properties in Welford have an average house price of £466,383.00 and had 106 Property Transactions within the last 3 years¹.
Welford is an area in Northampton, Warwickshire with 792 households², where the most expensive property was sold for £4,000,000.00.
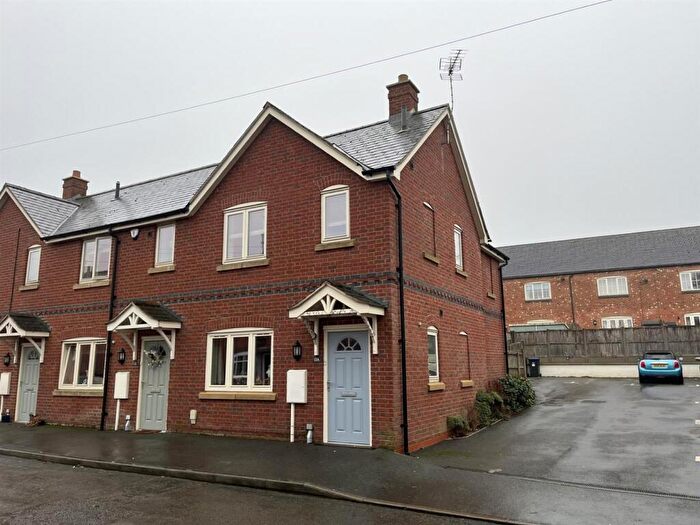
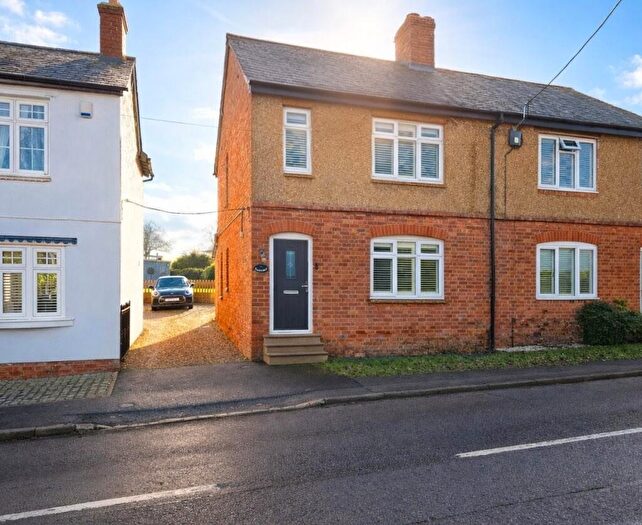
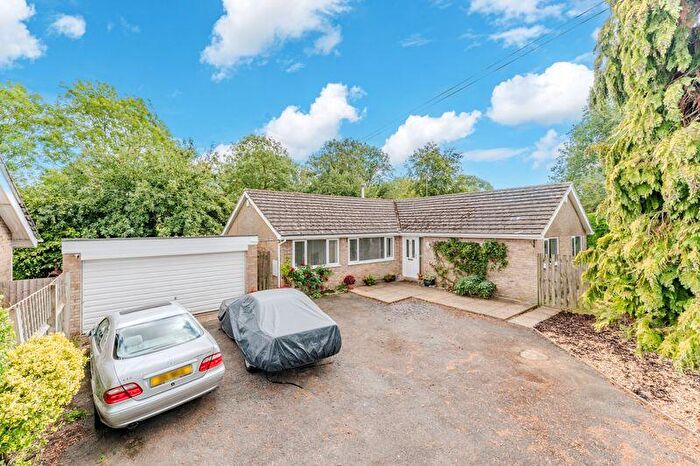
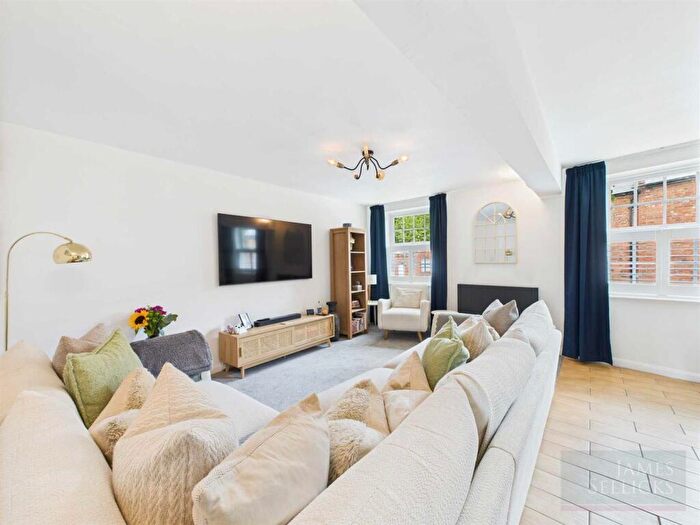
Properties for sale in Welford
Roads and Postcodes in Welford
Navigate through our locations to find the location of your next house in Welford, Northampton for sale or to rent.
| Streets | Postcodes |
|---|---|
| Abbey View | NN6 6JZ |
| Avon Fields | NN6 6JL |
| Bakehouse Rise | NN6 6DQ |
| Browns Meadow | NN6 6NR |
| Carvells Lane | NN6 6DH |
| Catton Close | NN6 6DS |
| Chambers Row | NN6 6HA |
| Christopher Court | NN6 6JN |
| Church Lane | NN6 6HB |
| Church Street | NN6 6DA |
| Cold Ashby Road | NN6 6DW NN6 6DN |
| Cottesbrooke Road | NN6 6DR NN6 9LJ |
| Dovehouse Close | NN6 6JW |
| Elkington Road | NN6 6HD |
| Fairfax Rise | NN6 6BP |
| Gynwell | NN6 6DB |
| Hall Close | NN6 6AJ |
| Hall Lane | NN6 6HL NN6 6JB |
| Hammonds Mews | NN6 6AP |
| Harrington Road | NN6 9LX |
| Haselbech Hill | NN6 9LL |
| Haselbech Road | NN6 6BT |
| Hemploe Road | NN6 6HF |
| High Street | NN6 6DD NN6 6HT |
| Ivydene Court | NN6 6DU |
| Knights Hill | NN6 6AH |
| Maidwell Road | NN6 9LG |
| Millers Road | NN6 6NE |
| Naseby Road | NN6 6EY NN6 6HZ NN6 9LH NN6 9LQ NN6 6JA |
| Newlands | NN6 6DE |
| Newlands Road | NN6 6HR |
| Northampton Road | NN6 6HP NN6 6JD |
| Nutcote | NN6 6DG |
| Orchard Terrace | NN6 6AE |
| Purlieu Court | NN6 6AN |
| Purlieu Mews | NN6 6DL |
| Roundhouse Close | NN6 6NN |
| Salford Close | NN6 6JJ |
| School Lane | NN6 6BZ |
| Skippons Court | NN6 6DT |
| South Kilworth Road | NN6 6HH NN6 6JH |
| Sulby Hall Old Drive | NN6 6EZ NN6 6FA |
| The Leys | NN6 6HS |
| The Paddocks | NN6 6JY |
| The Square | NN6 6HW |
| Thornby Road | NN6 6BY |
| Wakefield Drive | NN6 6HN |
| Welford Road | NN6 6DF |
| West Court | NN6 6GY |
| West End | NN6 6HJ |
| West Street | NN6 6HU NN6 6HX |
| Westfield Crescent | NN6 6HY |
| Woodford Glebe | NN6 6AF |
| NN6 6BU NN6 6DP NN6 6BS NN6 6BX NN6 6DJ |
Transport near Welford
- FAQ
- Price Paid By Year
- Property Type Price
Frequently asked questions about Welford
What is the average price for a property for sale in Welford?
The average price for a property for sale in Welford is £466,383. This amount is 13% higher than the average price in Northampton. There are 621 property listings for sale in Welford.
What streets have the most expensive properties for sale in Welford?
The streets with the most expensive properties for sale in Welford are Hemploe Road at an average of £4,000,000, Naseby Road at an average of £1,200,000 and South Kilworth Road at an average of £1,010,000.
What streets have the most affordable properties for sale in Welford?
The streets with the most affordable properties for sale in Welford are Catton Close at an average of £110,000, Woodford Glebe at an average of £176,716 and Northampton Road at an average of £235,000.
Which train stations are available in or near Welford?
Some of the train stations available in or near Welford are Market Harborough, Long Buckby and Rugby.
Property Price Paid in Welford by Year
The average sold property price by year was:
| Year | Average Sold Price | Price Change |
Sold Properties
|
|---|---|---|---|
| 2025 | £482,383 | 6% |
39 Properties |
| 2024 | £451,466 | -2% |
30 Properties |
| 2023 | £461,614 | 15% |
37 Properties |
| 2022 | £390,384 | -1% |
26 Properties |
| 2021 | £394,261 | 13% |
44 Properties |
| 2020 | £341,716 | 1% |
37 Properties |
| 2019 | £339,155 | -13% |
42 Properties |
| 2018 | £383,580 | 14% |
56 Properties |
| 2017 | £331,104 | -9% |
52 Properties |
| 2016 | £362,301 | 17% |
28 Properties |
| 2015 | £300,524 | -23% |
35 Properties |
| 2014 | £369,543 | 21% |
34 Properties |
| 2013 | £293,589 | 15% |
44 Properties |
| 2012 | £249,262 | -21% |
19 Properties |
| 2011 | £302,795 | 7% |
26 Properties |
| 2010 | £280,925 | 5% |
37 Properties |
| 2009 | £266,118 | -23% |
29 Properties |
| 2008 | £328,441 | 7% |
31 Properties |
| 2007 | £306,803 | 20% |
43 Properties |
| 2006 | £246,086 | 6% |
56 Properties |
| 2005 | £232,311 | -3% |
33 Properties |
| 2004 | £240,272 | 7% |
33 Properties |
| 2003 | £223,177 | -4% |
44 Properties |
| 2002 | £231,225 | 34% |
46 Properties |
| 2001 | £151,534 | 9% |
36 Properties |
| 2000 | £138,360 | 20% |
47 Properties |
| 1999 | £110,991 | -13% |
39 Properties |
| 1998 | £125,250 | 27% |
43 Properties |
| 1997 | £91,869 | -8% |
48 Properties |
| 1996 | £99,152 | 22% |
70 Properties |
| 1995 | £77,334 | - |
36 Properties |
Property Price per Property Type in Welford
Here you can find historic sold price data in order to help with your property search.
The average Property Paid Price for specific property types in the last three years are:
| Property Type | Average Sold Price | Sold Properties |
|---|---|---|
| Semi Detached House | £326,577.00 | 22 Semi Detached Houses |
| Detached House | £611,928.00 | 58 Detached Houses |
| Terraced House | £260,005.00 | 26 Terraced Houses |

