
Houses for sale in Bosworth, Lutterworth
House Prices in Bosworth
Properties in Bosworth have an average house price of £425k and had 131 Property Transactions within the last 3 years¹.
Bosworth is an area in Lutterworth, Leicestershire with 1,217 households², where the most expensive property was sold for £1.7M.
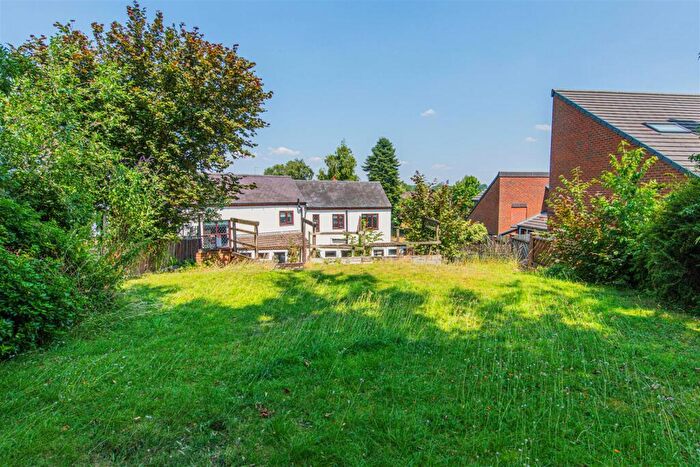
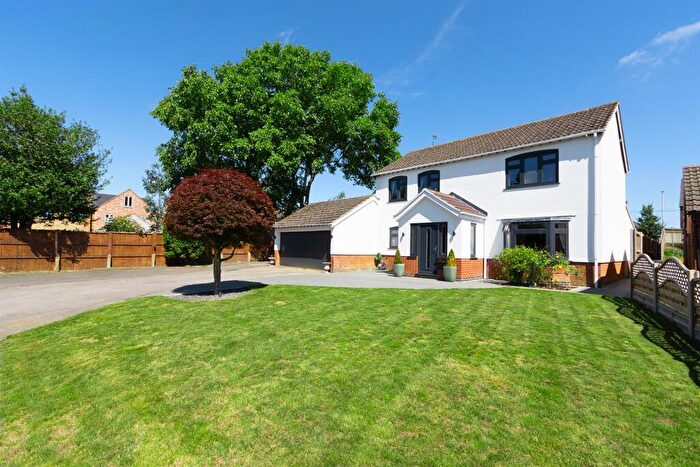
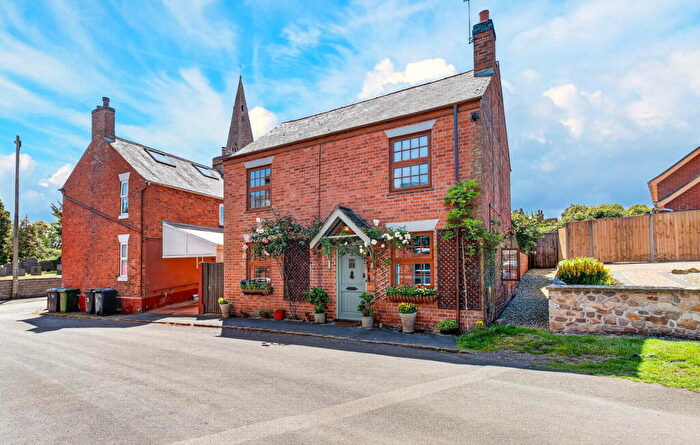
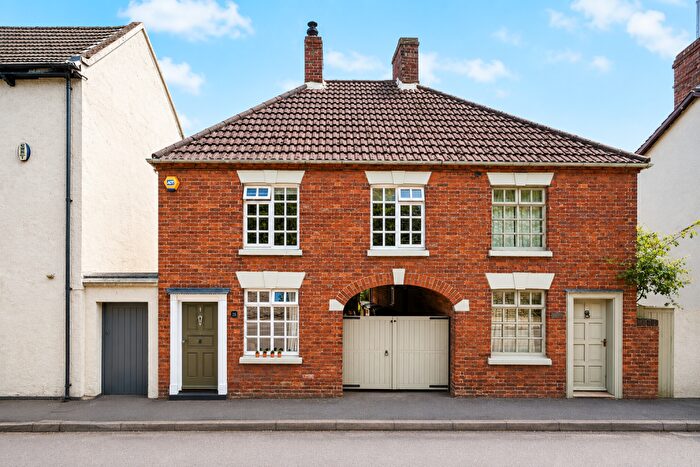
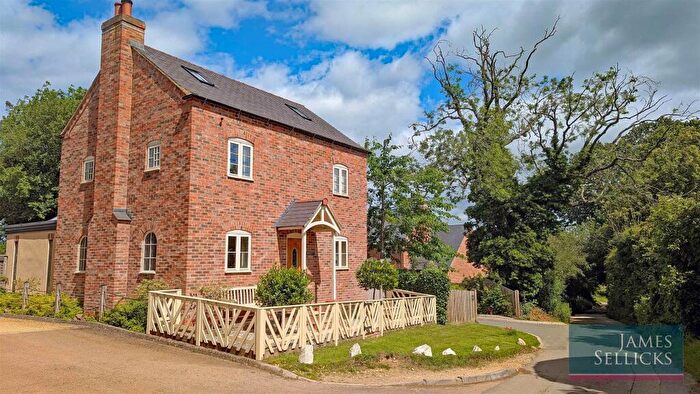
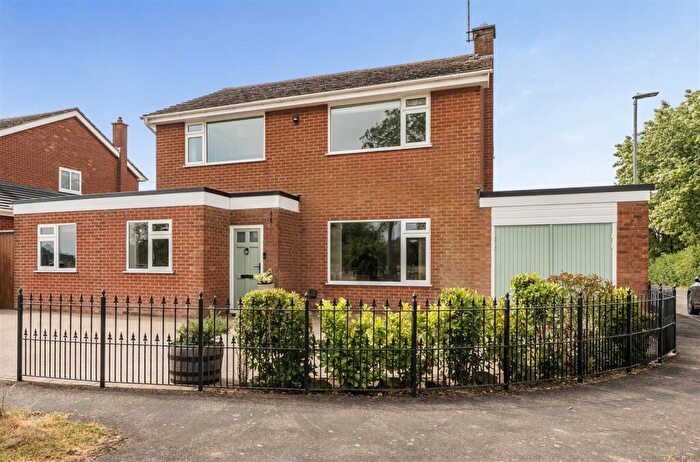
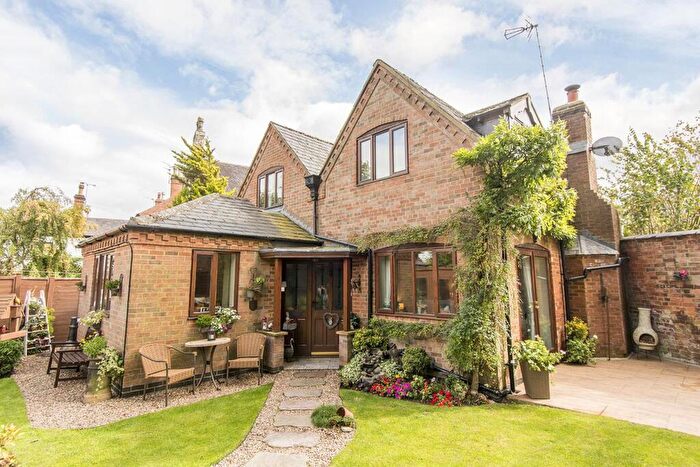
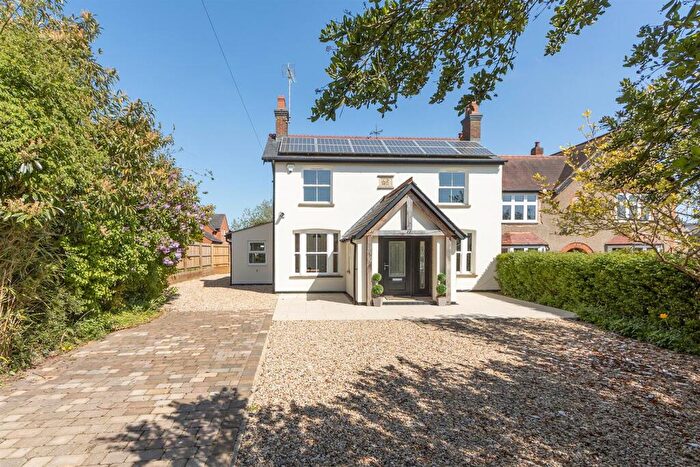
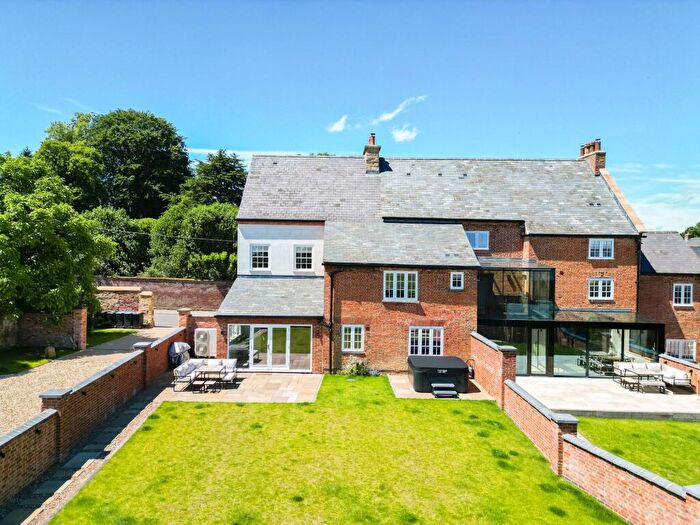
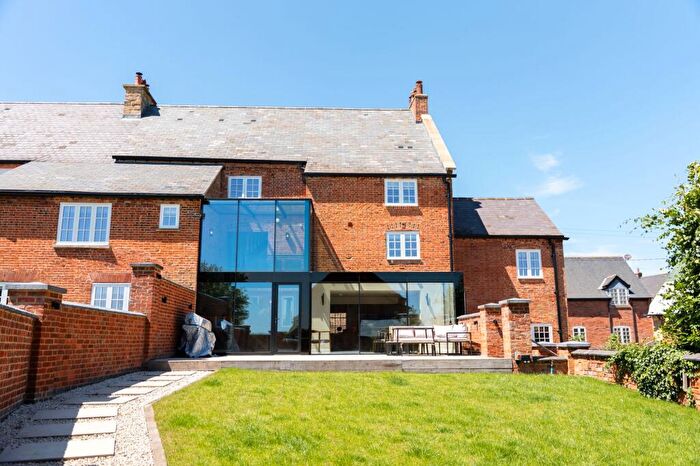
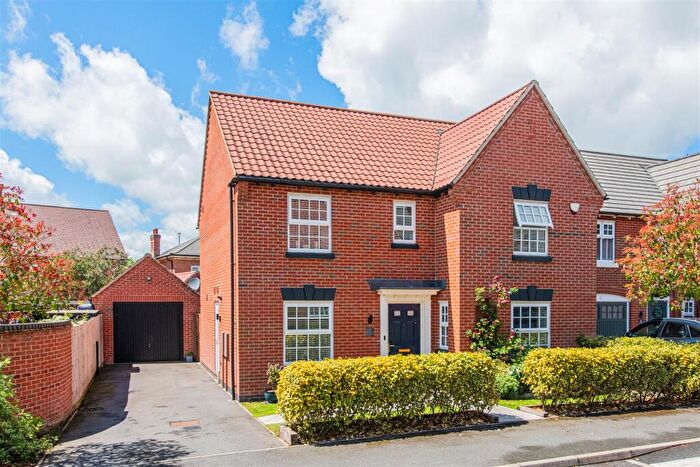
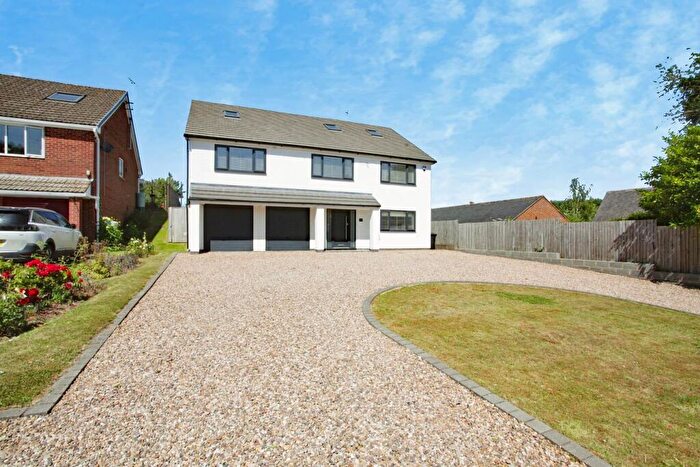
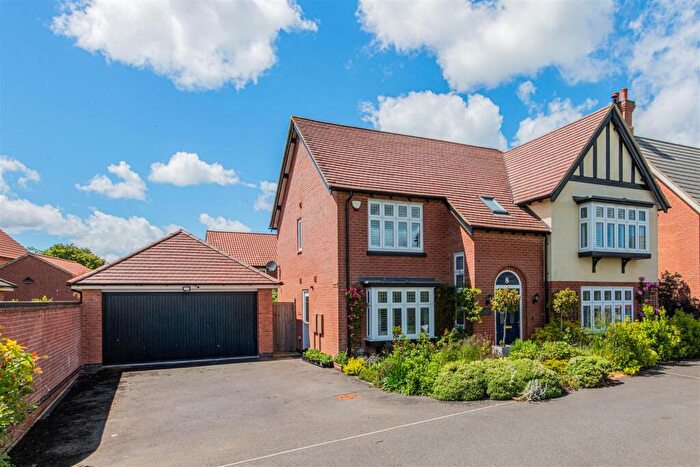
Properties for sale in Bosworth
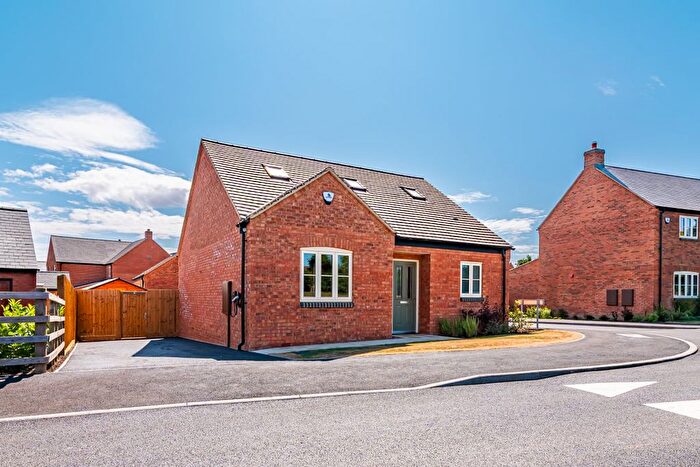
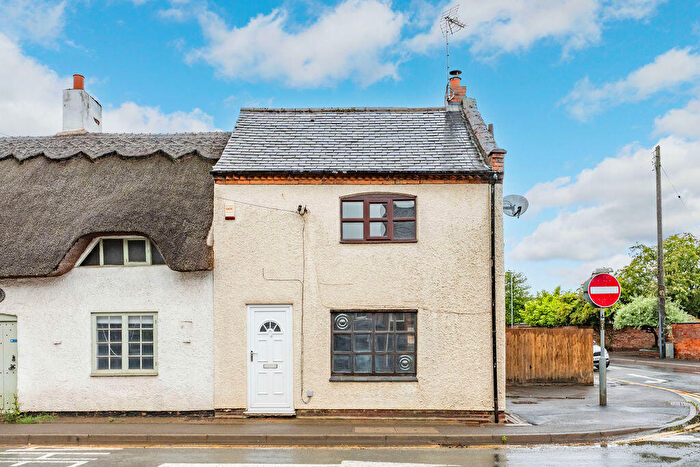
![]()
If you are looking to sell your house, let it out, or receive a property valuation, an expert can help you.
Click the button below to get started.
Roads and Postcodes in Bosworth
Navigate through our locations to find the location of your next house in Bosworth, Lutterworth for sale or to rent.
| Streets | Postcodes |
|---|---|
| Ashacre Close | LE17 6FL |
| Back Lane | LE17 6HB |
| Back Street | LE17 6HG |
| Bell Lane | LE17 6LA |
| Berridges Lane | LE17 6LE LE17 6LQ |
| Briar Rose Close | LE17 6JP |
| Broad Lane | LE17 6FD |
| Bromell Grove | LE17 6RD |
| Butt Lane | LE17 6LN |
| Chapel Lane | LE17 6NX |
| Cheney Court | LE17 6LX |
| Cherry Tree Close | LE17 6NB |
| Church Lane | LE17 6ED LE17 6LS |
| Church Street | LE17 6EZ LE17 6LT LE17 6LU |
| Cranmer Lane | LE17 6EX |
| Dag Lane | LE17 6HD |
| Dog Lane | LE17 6FP |
| Elmcroft Road | LE17 6HX |
| Fernie Court | LE17 6LW |
| Furrow Lane | LE17 6FJ |
| Gilby Close | LE17 6NH |
| Green Lane | LE17 6EY LE17 6HQ LE17 6LD |
| Green Lane Hill | LE17 6FB |
| Hawthorne Road | LE17 6EU |
| High Street | LE17 6ET LE17 6LH LE17 6LJ LE17 6LP |
| Highcroft | LE17 6LF |
| Hillcrest Lane | LE17 6LB |
| Holly Mews | LE17 6PT |
| Honeypot Lane | LE17 6LY |
| Hunters Close | LE17 6LG |
| Kemp Drive | LE17 6RE |
| Kilworth Road | LE17 6JW LE17 6JY LE17 6JZ |
| Knighton Yard | LE17 6BZ |
| Knights Close | LE17 6PS |
| Lammas Close | LE17 6LL |
| Laughton Lane | LE17 6NS |
| Leicester Road | LE17 6NW |
| Leys Crescent | LE17 6DS |
| Lutterworth Road | LE17 6EP LE17 6HN LE17 6JE |
| Main Street | LE17 6NT LE17 6NU |
| Marsh Drive | LE17 6PU |
| Mill Field Close | LE17 6FE |
| Millennium Close | LE17 6DL |
| Mowsley Lane | LE17 5RE |
| Mowsley Road | LE17 6LR |
| North Road | LE17 6DR LE17 6DT LE17 6DU LE17 6DZ |
| Old Clock Court | LE17 6FA |
| Old School Close | LE17 5RS |
| Pieces Place | LE17 6FG |
| Pincet Lane | LE17 6NE |
| Ridge Way | LE17 6FH |
| Rose Dale | LE17 6HT |
| Rugby Road | LE17 6DN LE17 6DW |
| Saddington Road | LE17 6NY |
| School Lane | LE17 6JU |
| Sibbertoft Road | LE17 6JA |
| South Kilworth Road | LE17 6HE LE17 6HF LE17 6HJ |
| Stablefields Drive | LE17 6HR |
| Stanford Road | LE17 6DP |
| Station Road | LE17 6ER LE17 6ES LE17 6HY |
| Stoney Close | LE17 6HL |
| The Belt | LE17 6DX |
| The Green | LE17 6JT |
| The Sycamores | LE17 6EW |
| Theddingworth Road | LE17 6NL LE17 6NR |
| Townend Close | LE17 6RA |
| Trolley Close | LE17 6RF |
| Walcote Road | LE17 6EE LE17 6EF LE17 6EG LE17 6EQ |
| Walton Lane | LE17 6NN |
| Waterworks Way | LE17 6HU |
| Welford Road | LE17 6JH LE17 6DY LE17 6EA LE17 6JL LE17 6JX LE17 6NQ |
| Wells Close | LE17 6NA |
| Western Cottages | LE17 6HW |
| Wheelwright Close | LE17 6EL |
| LE17 5RT LE17 6HH LE17 6JB LE17 6JD LE17 6JJ LE17 6JN LE17 6LZ LE17 6NF |
Property price trends in Bosworth
According to the latest Land Registry data, the average home in Bosworth sold for £249,999 in 2026. That figure comes from 1,510 sales logged over the past 31 years.
Prices have fallen back over the last three years. Compared with 2023, when the typical sale came in around £437,548, that's a fall of roughly 42.9%.
Looking back five years, average prices are down about 36.9% since 2021, a drop of around £146,028 in cash terms.
Zoom out to the past decade for the fuller picture. Back in 2016, homes here averaged £324,478, so the typical sold price has fallen about 23% since then, around 2.6% a year lower. Stretch the view to fifteen years and that annual pace edges up closer to -0.1%.
Frequently asked questions about Bosworth
What is the average price for a property for sale in Bosworth?
The average price for a property for sale in Bosworth is £425,231. This amount is 10% higher than the average price in Lutterworth. There are 415 property listings for sale in Bosworth.
What streets have the most expensive properties for sale in Bosworth?
The streets with the most expensive properties for sale in Bosworth are Rugby Road at an average of £1,700,000, The Belt at an average of £1,025,000 and Cranmer Lane at an average of £850,000.
What streets have the most affordable properties for sale in Bosworth?
The streets with the most affordable properties for sale in Bosworth are Cheney Court at an average of £121,500, Wells Close at an average of £125,333 and Western Cottages at an average of £182,500.
Which train stations are available in or near Bosworth?
Some of the train stations available in or near Bosworth are Market Harborough, Rugby and South Wigston.
Property Price Paid in Bosworth by Year
The average sold property price by year was:
| Year | Average Sold Price | Price Change |
Sold Properties
|
|---|---|---|---|
| 2026 | £249,999 | -71% |
3 Properties |
| 2025 | £428,475 | 2% |
40 Properties |
| 2024 | £420,350 | -4% |
40 Properties |
| 2023 | £437,548 | 3% |
48 Properties |
| 2022 | £422,467 | 6% |
39 Properties |
| 2021 | £396,027 | -6% |
87 Properties |
| 2020 | £418,977 | 11% |
53 Properties |
| 2019 | £373,109 | 15% |
70 Properties |
| 2018 | £316,422 | 8% |
75 Properties |
| 2017 | £290,141 | -12% |
40 Properties |
Property Price per Property Type in Bosworth
Here you can find historic sold price data in order to help with your property search.
The average Property Paid Price for specific property types in the last three years are:
| Property Type | Average Sold Price | Sold Properties |
|---|---|---|
| Semi Detached House | £314,307.00 | 39 Semi Detached Houses |
| Detached House | £618,908.00 | 55 Detached Houses |
| Terraced House | £255,774.00 | 31 Terraced Houses |
| Flat | £246,390.00 | 6 Flats |
