
Houses for sale in Rugby, Warwickshire
House Prices in Rugby
Properties in Rugby have an average house price of £299k and had 4,366 Property Transactions within the last 3 years.¹
Rugby is an area in Warwickshire with 43,908 households², where the most expensive property was sold for £1.72M.
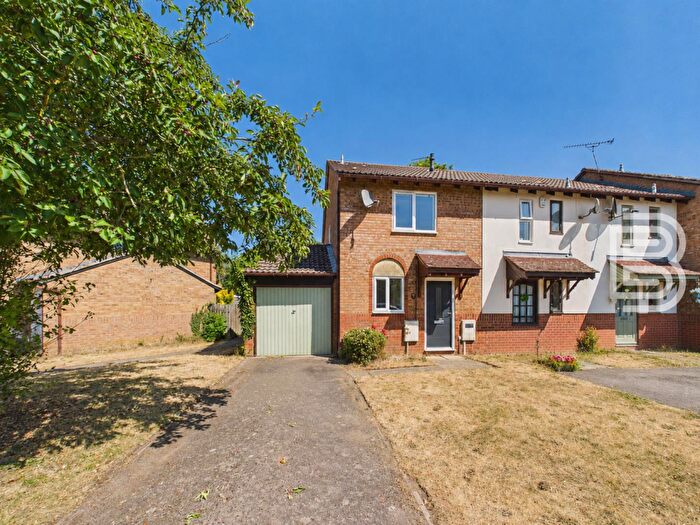
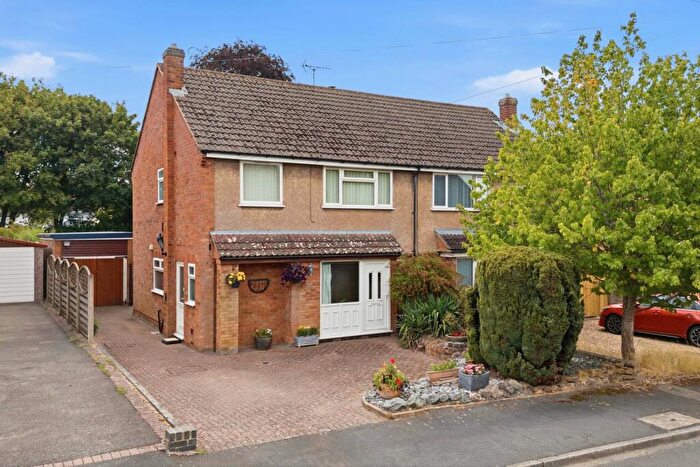
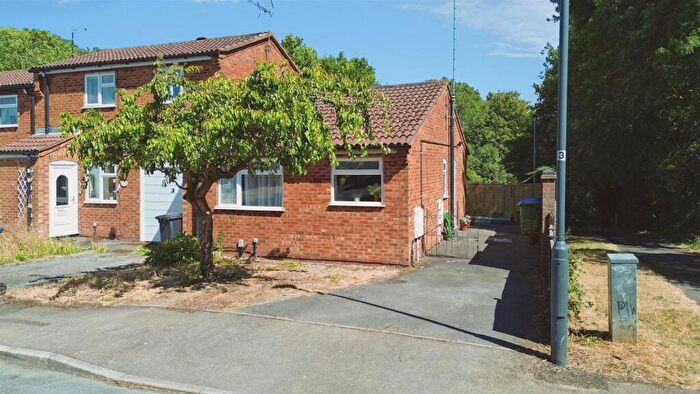
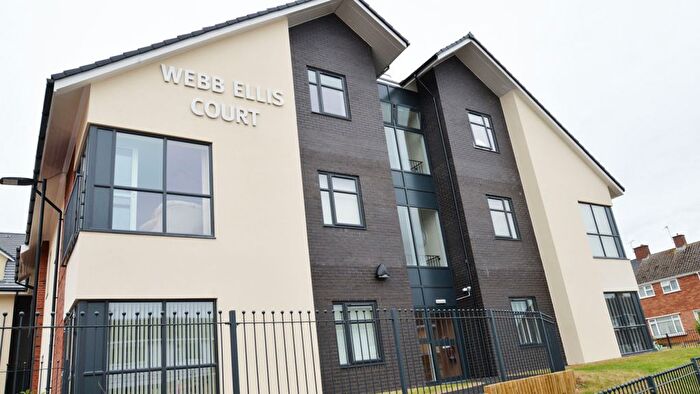
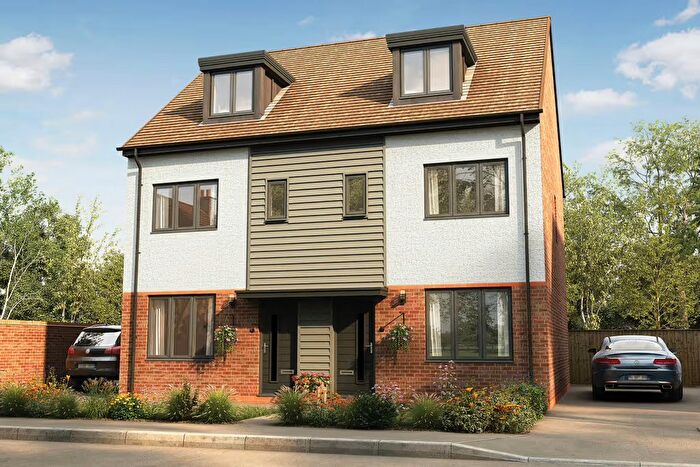
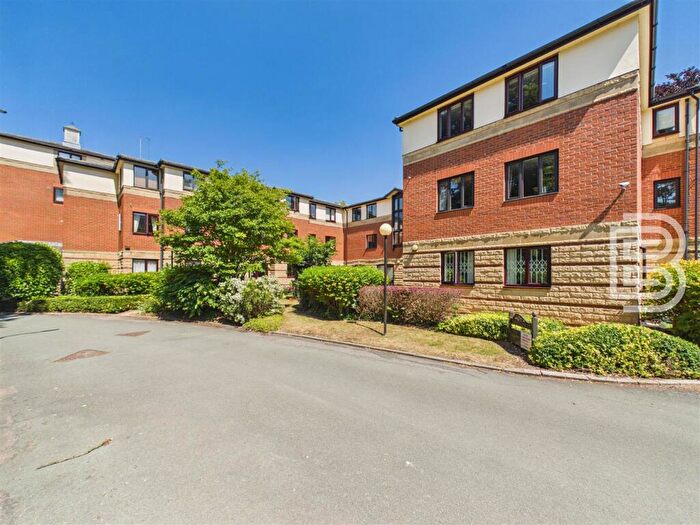
Properties for sale in Rugby
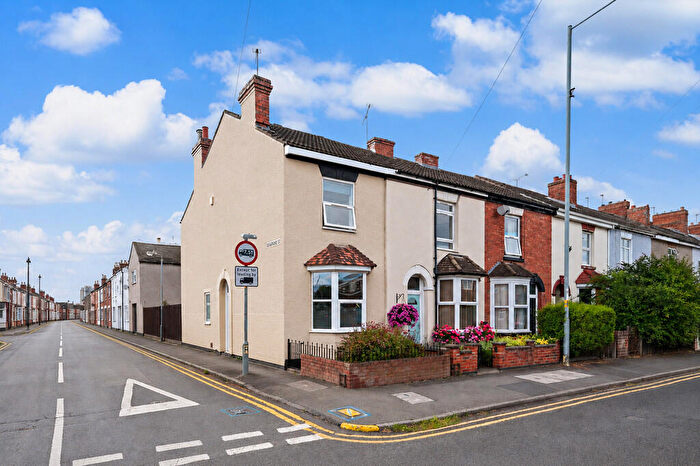

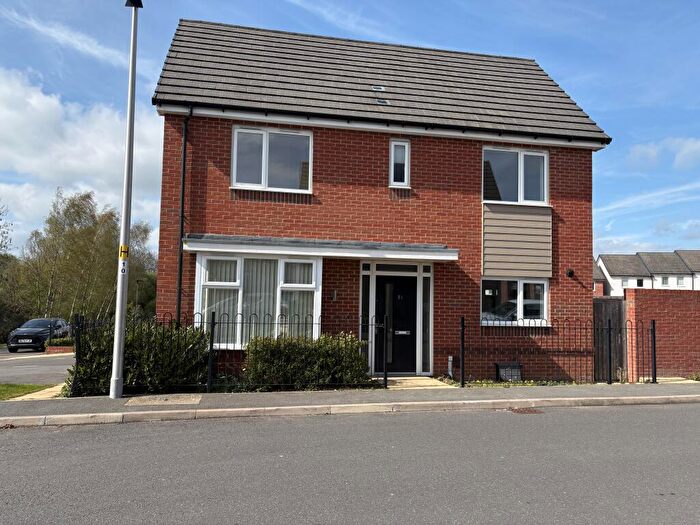
![]()
If you are looking to sell your house, let it out, or receive a property valuation, an expert can help you.
Click the button below to get started.


Neighbourhoods in Rugby
Navigate through our locations to find the location of your next house in Rugby, Warwickshire for sale or to rent.
Property price trends in Rugby
According to the latest Land Registry data, the average home in Rugby sold for £305,281 in 2026. That figure comes from a substantial record of 56,275 sales logged over the past 31 years.
Prices have moved up over the last three years. Compared with 2023, when the typical sale came in around £294,599, that's a rise of roughly 3.6%.
Looking back five years, average prices are up about 5% since 2021, a gain of around £14,672 in cash terms.
Zoom out to the past decade for the fuller picture. Back in 2016, homes here averaged £229,266, so the typical sold price has climbed about 33.2% since then, roughly 2.9% a year. Stretch the view to fifteen years and that annual pace edges up closer to 3.5%.
Frequently asked questions about Rugby
What is the average price for a property for sale in Rugby?
The average price for a property for sale in Rugby is £298,856. This amount is 13% lower than the average price in Warwickshire. There are more than 10,000 property listings for sale in Rugby.
What locations have the most expensive properties for sale in Rugby?
The locations with the most expensive properties for sale in Rugby are Leam Valley at an average of £521,454, Dunsmore at an average of £422,876 and Revel And Binley Woods at an average of £416,614.
What locations have the most affordable properties for sale in Rugby?
The locations with the most affordable properties for sale in Rugby are New Bilton at an average of £194,817, Benn at an average of £202,886 and Newbold And Brownsover at an average of £244,286.
Which train stations are available in or near Rugby?
Some of the train stations available in or near Rugby are Rugby, Long Buckby and Coventry.
Property Price Paid in Rugby by Year
The average sold property price by year was:
| Year | Average Sold Price | Price Change |
Sold Properties
|
|---|---|---|---|
| 2026 | £305,281 | 0,2% |
94 Properties |
| 2025 | £304,633 | 2% |
1,375 Properties |
| 2024 | £297,060 | 1% |
1,538 Properties |
| 2023 | £294,599 | -3% |
1,359 Properties |
| 2022 | £302,062 | 4% |
1,659 Properties |
| 2021 | £290,609 | 7% |
2,124 Properties |
| 2020 | £271,216 | 1% |
1,830 Properties |
| 2019 | £269,080 | 1% |
2,271 Properties |
| 2018 | £265,766 | 8% |
2,187 Properties |
| 2017 | £243,237 | 6% |
1,870 Properties |
Property Price per Property Type in Rugby
Here you can find historic sold price data in order to help with your property search.
The average Property Paid Price for specific property types in the last three years are:
| Property Type | Average Sold Price | Sold Properties |
|---|---|---|
| Semi Detached House | £277,517.00 | 1,481 Semi Detached Houses |
| Terraced House | £224,152.00 | 1,187 Terraced Houses |
| Detached House | £449,339.00 | 1,256 Detached Houses |
| Flat | £143,360.00 | 442 Flats |
Transport in Rugby
Please see below transportation links in this area:
