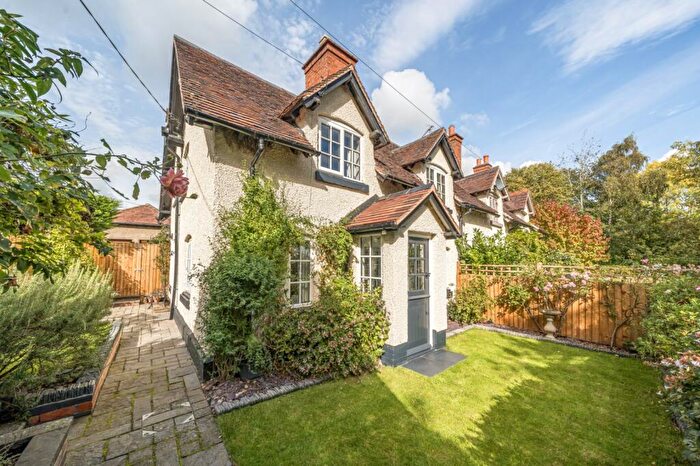
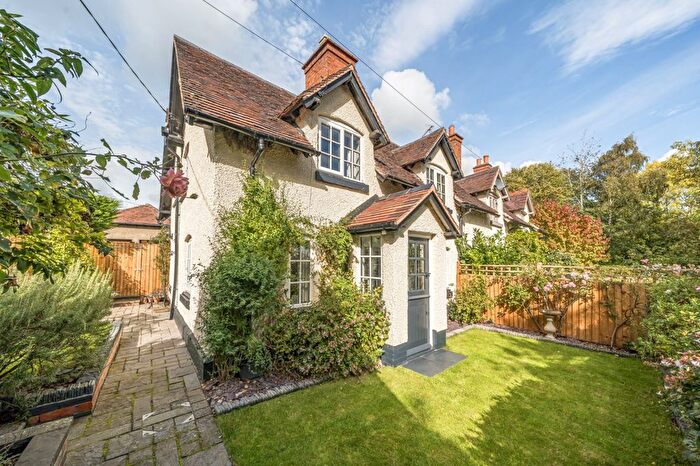
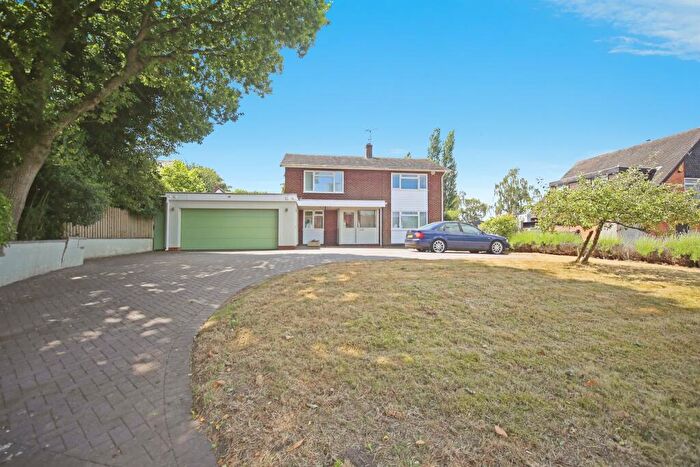
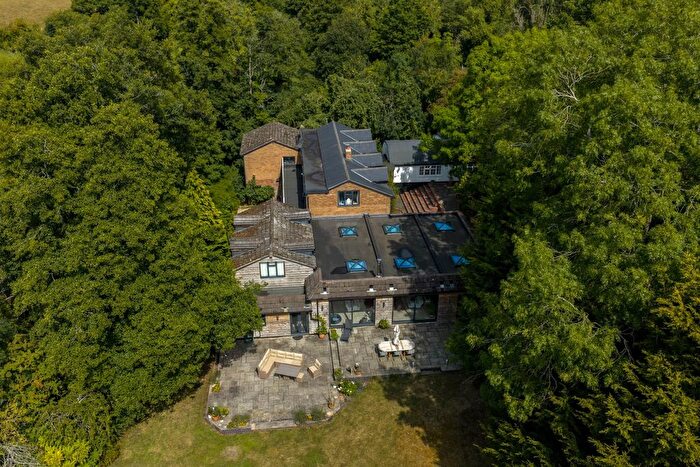
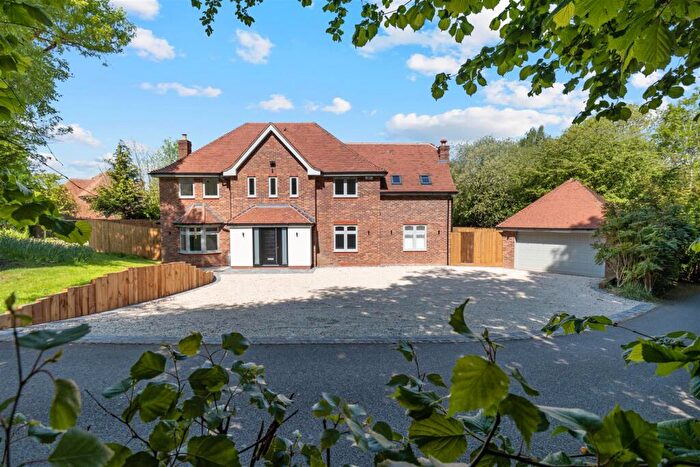
Houses for sale & to rent in Claverdon, Warwick
House Prices in Claverdon
Properties in Claverdon have an average house price of £750,199.00 and had 38 Property Transactions within the last 3 years¹.
Claverdon is an area in Warwick, Warwickshire with 475 households², where the most expensive property was sold for £2,350,000.00.
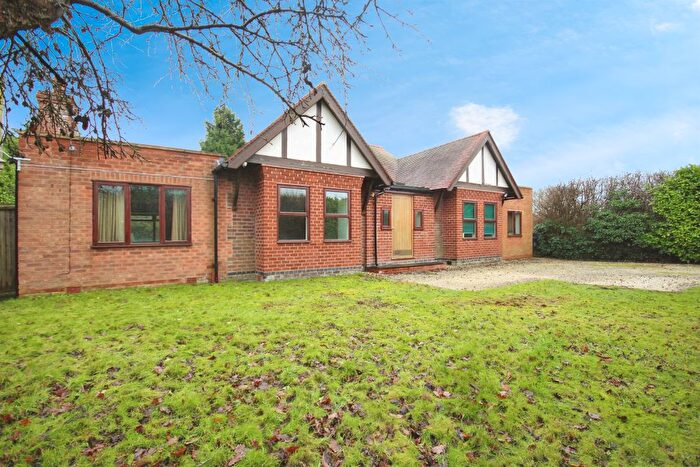
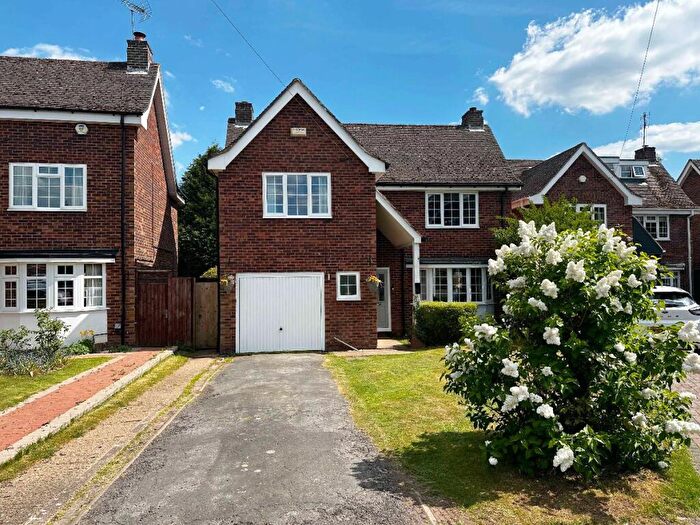
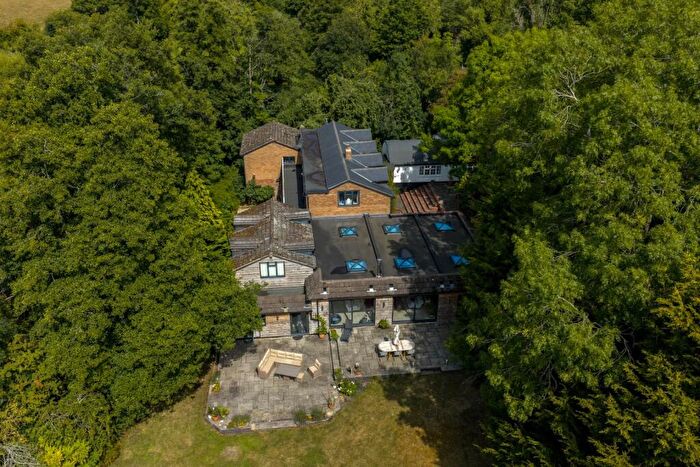
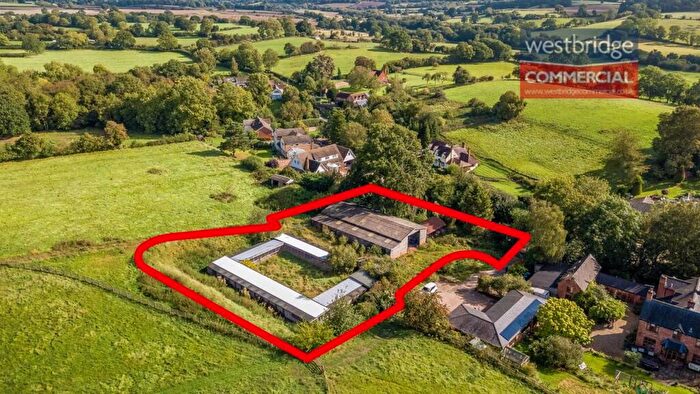
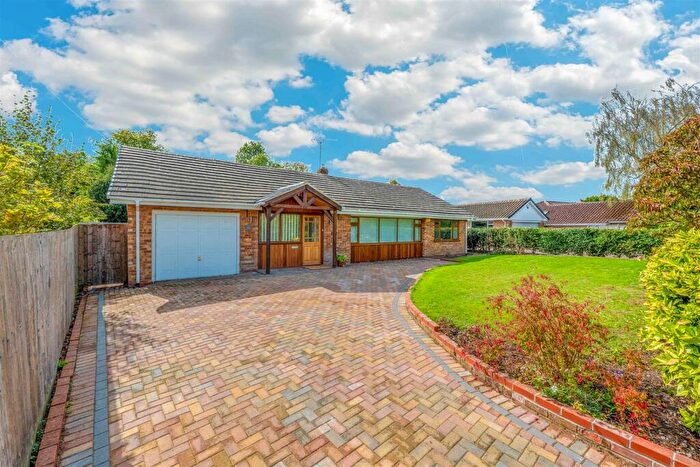
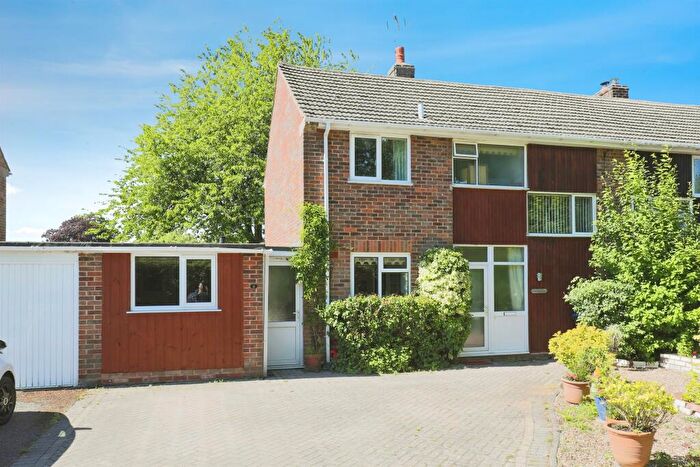
Properties for sale in Claverdon
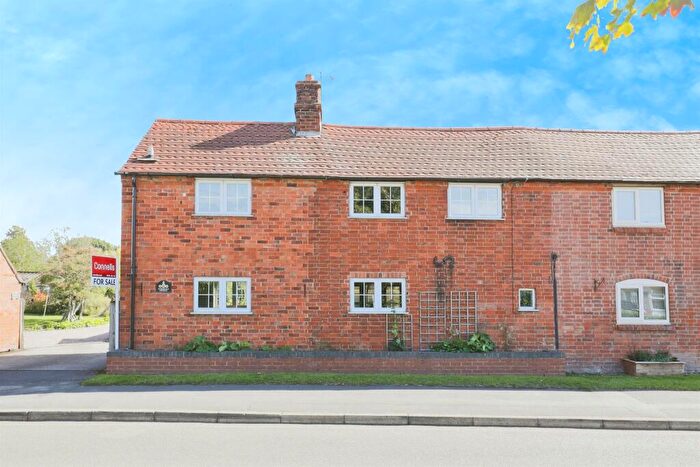
Previously listed properties in Claverdon
Roads and Postcodes in Claverdon
Navigate through our locations to find the location of your next house in Claverdon, Warwick for sale or to rent.
| Streets | Postcodes |
|---|---|
| Breach Lane | CV35 8QB |
| Buttermilk Lane | CV35 8HP |
| Church Road | CV35 8PB CV35 8PD |
| Cophill Cottage | CV35 8NY |
| Curlieu Lane | CV35 8JR |
| Far Pool Meadow | CV35 8PG |
| Gannaway | CV35 8JT |
| Glebe Road | CV35 8NX |
| Henley Road | CV35 8LJ CV35 8PS |
| High Croft | CV35 8LH |
| Home Meadow | CV35 8PY |
| Kington Cottages | CV35 8PW |
| Kington Lane | CV35 8PP |
| Kington Rise | CV35 8PN |
| Langley Road | CV35 8PJ CV35 8PU CV35 8QA |
| Lye Green | CV35 8HJ CV35 8HL |
| Morgan Close | CV35 8JF |
| Oakdene Close | CV35 8PZ |
| Ossetts Hole Lane | CV35 8HN CV35 8PT |
| Park Close | CV35 8HH |
| Park Drive | CV35 8HG |
| St Michaels Road | CV35 8NT |
| Star Lane | CV35 8LS CV35 8LW |
| Station Road | CV35 8HF CV35 8PE CV35 8PH |
| The Green | CV35 8LL |
| Trevelyan Close | CV35 8PA |
| Wheelbarrow Lane | CV35 8NN |
| Yarningale Common | CV35 8HS |
| Yarningale Lane | CV35 8HW |
| CV35 8XD |
Transport near Claverdon
-
Claverdon Station
-
Hatton Station
-
Bearley Station
-
Henley-In-Arden Station
-
Wootton Wawen Station
-
Lapworth Station
-
Warwick Parkway Station
-
Wilmcote Station
- FAQ
- Price Paid By Year
- Property Type Price
Frequently asked questions about Claverdon
What is the average price for a property for sale in Claverdon?
The average price for a property for sale in Claverdon is £750,199. This amount is 87% higher than the average price in Warwick. There are 94 property listings for sale in Claverdon.
What streets have the most expensive properties for sale in Claverdon?
The streets with the most expensive properties for sale in Claverdon are Kington Lane at an average of £1,151,666, Station Road at an average of £1,062,500 and Church Road at an average of £897,900.
What streets have the most affordable properties for sale in Claverdon?
The streets with the most affordable properties for sale in Claverdon are Park Close at an average of £390,000, The Green at an average of £445,000 and High Croft at an average of £492,500.
Which train stations are available in or near Claverdon?
Some of the train stations available in or near Claverdon are Claverdon, Hatton and Bearley.
Property Price Paid in Claverdon by Year
The average sold property price by year was:
| Year | Average Sold Price | Price Change |
Sold Properties
|
|---|---|---|---|
| 2025 | £617,375 | -30% |
12 Properties |
| 2024 | £805,416 | -2% |
18 Properties |
| 2023 | £825,199 | -12% |
8 Properties |
| 2022 | £926,366 | 17% |
18 Properties |
| 2021 | £769,506 | 29% |
30 Properties |
| 2020 | £546,475 | 6% |
16 Properties |
| 2019 | £515,833 | -18% |
18 Properties |
| 2018 | £610,800 | 13% |
10 Properties |
| 2017 | £528,714 | -50% |
16 Properties |
| 2016 | £792,640 | 26% |
21 Properties |
| 2015 | £589,547 | 9% |
21 Properties |
| 2014 | £535,281 | 5% |
30 Properties |
| 2013 | £510,000 | 33% |
10 Properties |
| 2012 | £342,692 | -9% |
19 Properties |
| 2011 | £374,133 | -19% |
15 Properties |
| 2010 | £445,650 | -38% |
19 Properties |
| 2009 | £615,521 | 18% |
21 Properties |
| 2008 | £503,380 | 11% |
13 Properties |
| 2007 | £449,165 | 12% |
20 Properties |
| 2006 | £396,377 | 12% |
24 Properties |
| 2005 | £348,607 | -8% |
14 Properties |
| 2004 | £377,842 | -6% |
25 Properties |
| 2003 | £401,035 | 16% |
30 Properties |
| 2002 | £336,826 | 6% |
38 Properties |
| 2001 | £318,090 | 41% |
26 Properties |
| 2000 | £186,839 | -14% |
17 Properties |
| 1999 | £213,521 | 23% |
28 Properties |
| 1998 | £165,275 | 21% |
18 Properties |
| 1997 | £130,074 | -28% |
21 Properties |
| 1996 | £166,860 | -1% |
28 Properties |
| 1995 | £169,153 | - |
26 Properties |
Property Price per Property Type in Claverdon
Here you can find historic sold price data in order to help with your property search.
The average Property Paid Price for specific property types in the last three years are:
| Property Type | Average Sold Price | Sold Properties |
|---|---|---|
| Semi Detached House | £513,299.00 | 7 Semi Detached Houses |
| Detached House | £872,018.00 | 27 Detached Houses |
| Terraced House | £342,500.00 | 4 Terraced Houses |

