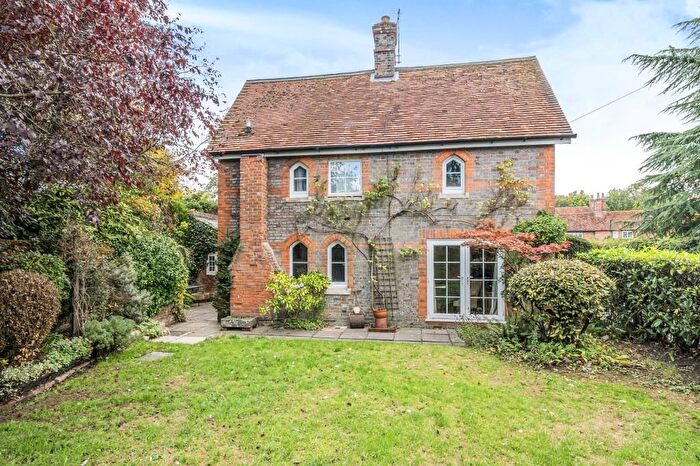
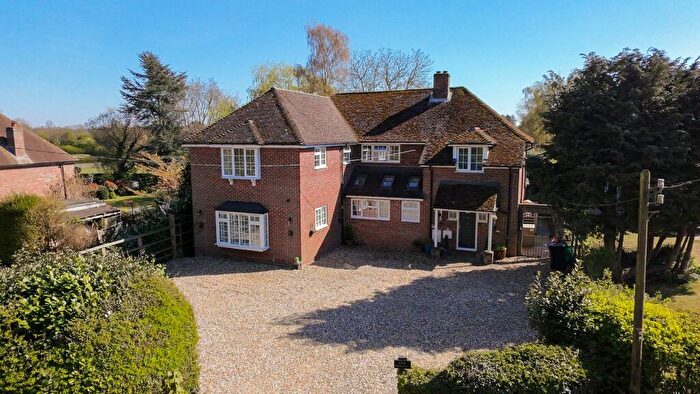
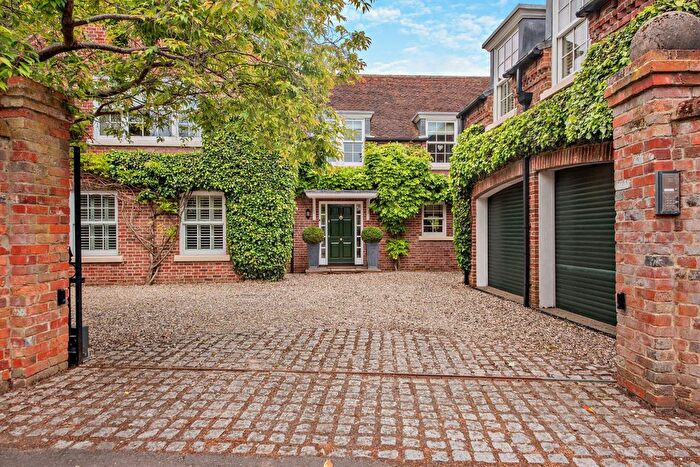
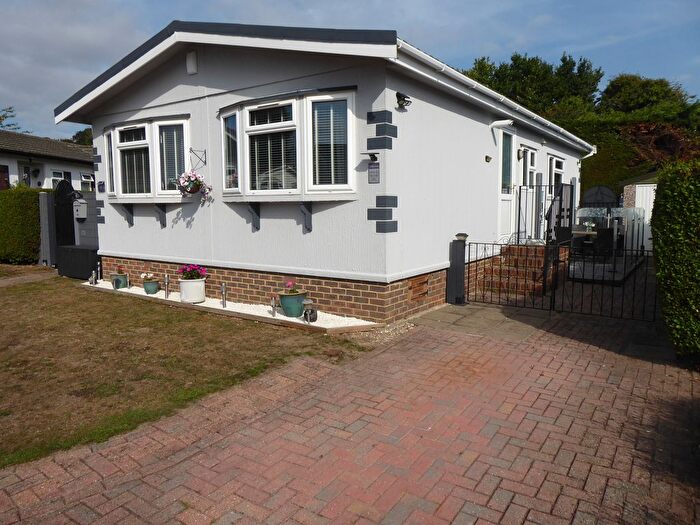
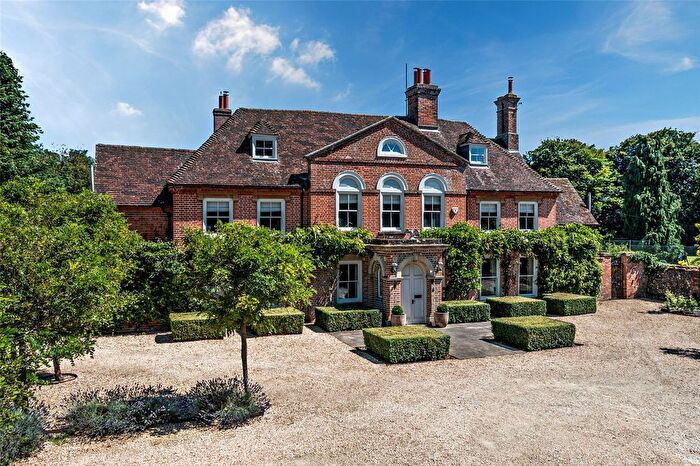
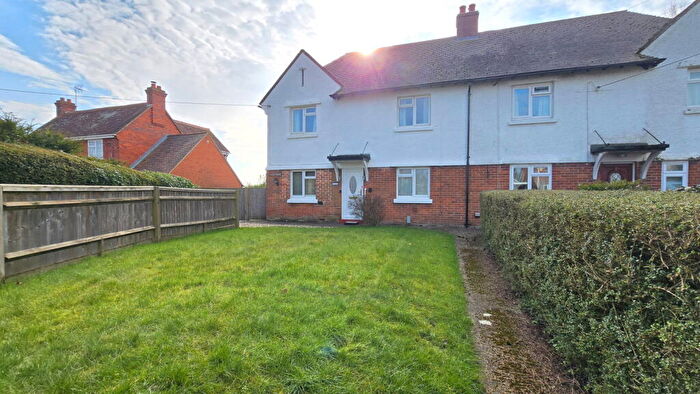
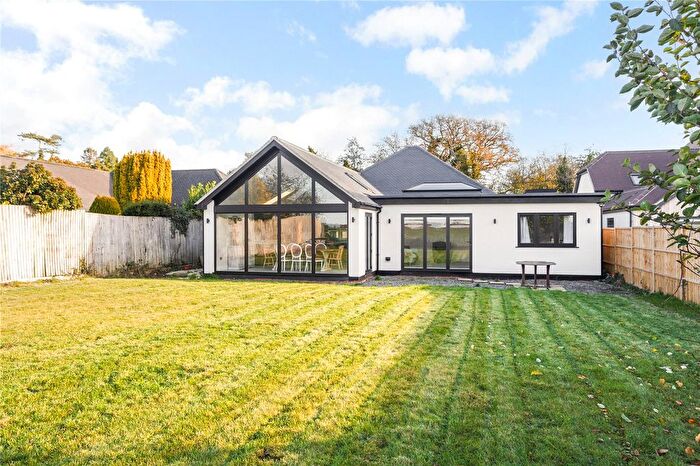
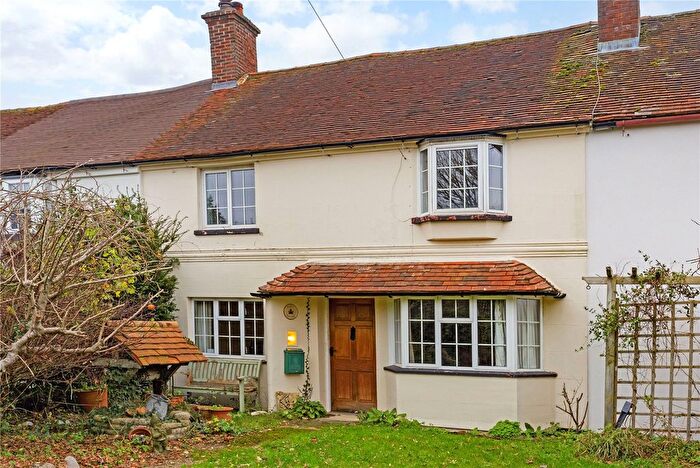
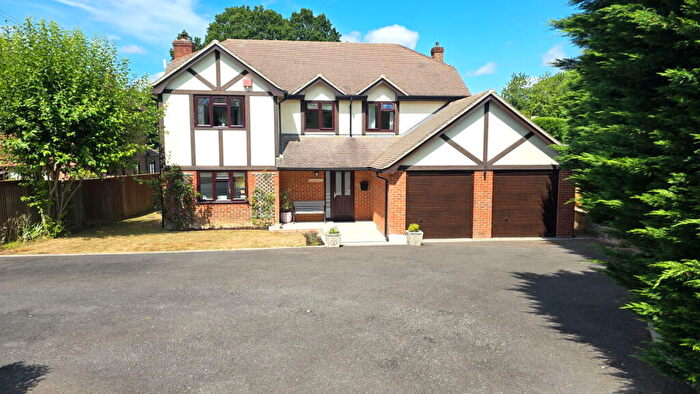
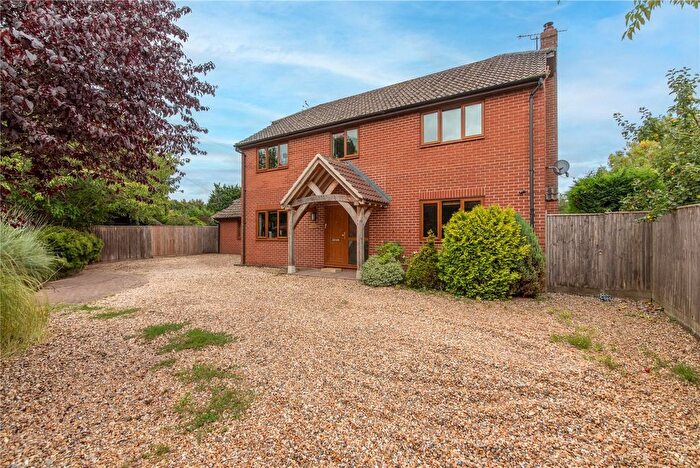
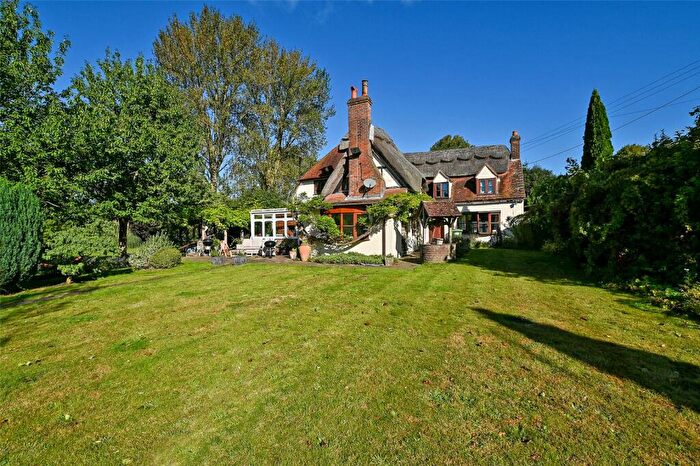
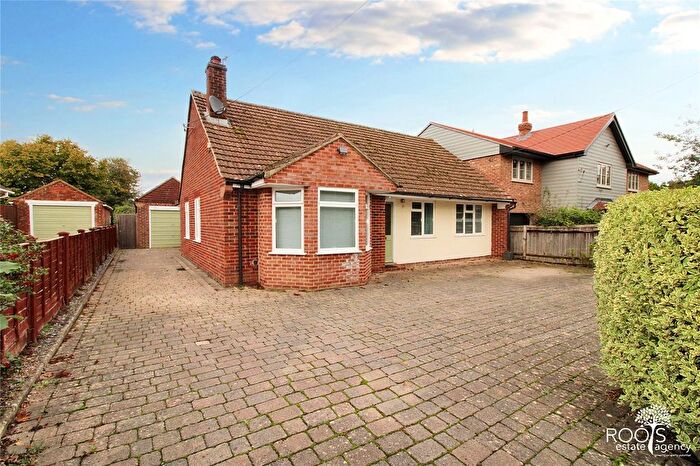
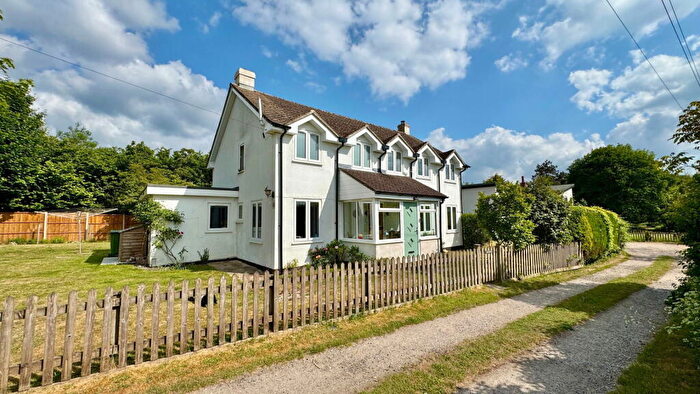
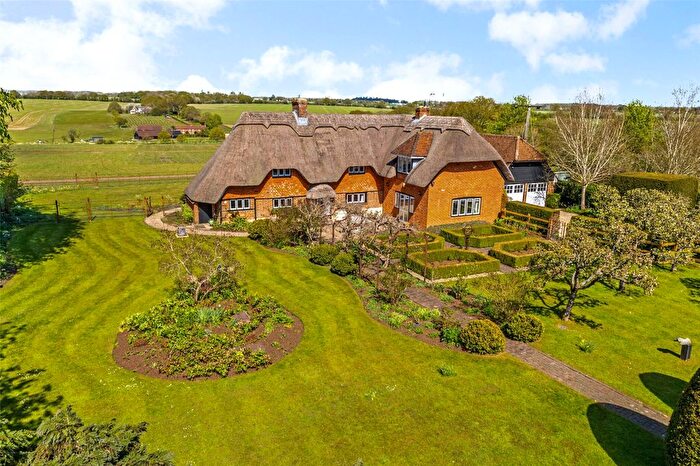
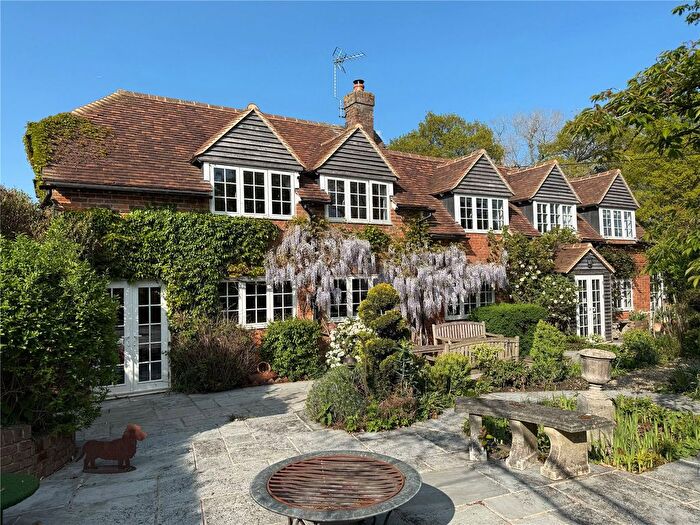
Houses for sale & to rent in Chieveley, Newbury
House Prices in Chieveley
Properties in Chieveley have an average house price of £849,656.00 and had 32 Property Transactions within the last 3 years¹.
Chieveley is an area in Newbury, West Berkshire with 405 households², where the most expensive property was sold for £4,750,000.00.
Properties for sale in Chieveley
Previously listed properties in Chieveley
Roads and Postcodes in Chieveley
Navigate through our locations to find the location of your next house in Chieveley, Newbury for sale or to rent.
| Streets | Postcodes |
|---|---|
| Arlington Lane | RG14 3BJ |
| Bardown | RG20 8TH RG20 8TJ |
| Barton Copse | RG20 8RN |
| Beedon Common | RG20 8TT |
| Church Lane | RG20 8UT |
| Down End | RG20 8TF RG20 8TG RG20 8TL RG20 8TN RG20 8TR RG20 8TS |
| East Lane | RG20 8UY RG20 8UZ |
| Freshfields Lane | RG20 8TB |
| Graces Lane | RG20 8XG RG20 8XQ |
| Green Lane | RG20 8XB |
| Hazeldene | RG20 8UP |
| Heathfields | RG20 8TW |
| High Street | RG20 8TE RG20 8UR RG20 8UX |
| Horsemoor | RG20 8XD |
| Manor Lane | RG20 8UU |
| Middle Farm Close | RG20 8RJ |
| North Heath | RG20 8UG |
| Northfields | RG20 8TP |
| Orchard End | RG20 8RQ |
| Oxford Road | RG20 8RT RG20 8RU |
| Pointers Close | RG20 8UJ |
| School Road | RG20 8TY |
| Snelsmore Farm Cottages | RG14 3BU |
| Sowbury Park | RG20 8TZ |
| The Green | RG20 8TD |
| Tudor Avenue | RG20 8RW |
Transport near Chieveley
-
Newbury Racecourse Station
-
Newbury Station
-
Thatcham Station
-
Kintbury Station
-
Midgham Station
-
Goring and Streatley Station
-
Aldermaston Station
-
Hungerford Station
-
Pangbourne Station
-
Cholsey Station
- FAQ
- Price Paid By Year
- Property Type Price
Frequently asked questions about Chieveley
What is the average price for a property for sale in Chieveley?
The average price for a property for sale in Chieveley is £849,656. This amount is 108% higher than the average price in Newbury. There are 106 property listings for sale in Chieveley.
What streets have the most expensive properties for sale in Chieveley?
The streets with the most expensive properties for sale in Chieveley are High Street at an average of £1,836,250, Church Lane at an average of £1,200,000 and Green Lane at an average of £1,100,000.
What streets have the most affordable properties for sale in Chieveley?
The streets with the most affordable properties for sale in Chieveley are Hazeldene at an average of £307,500, Middle Farm Close at an average of £584,000 and Graces Lane at an average of £585,500.
Which train stations are available in or near Chieveley?
Some of the train stations available in or near Chieveley are Newbury Racecourse, Newbury and Thatcham.
Property Price Paid in Chieveley by Year
The average sold property price by year was:
| Year | Average Sold Price | Price Change |
Sold Properties
|
|---|---|---|---|
| 2025 | £1,080,700 | 28% |
10 Properties |
| 2024 | £781,843 | 17% |
16 Properties |
| 2023 | £645,416 | -6% |
6 Properties |
| 2022 | £683,366 | 2% |
15 Properties |
| 2021 | £671,434 | 5% |
30 Properties |
| 2020 | £636,500 | -41% |
6 Properties |
| 2019 | £900,357 | 22% |
7 Properties |
| 2018 | £703,437 | -45% |
8 Properties |
| 2017 | £1,017,338 | 44% |
5 Properties |
| 2016 | £567,796 | -5% |
17 Properties |
| 2015 | £596,316 | 12% |
15 Properties |
| 2014 | £524,322 | 2% |
11 Properties |
| 2013 | £514,400 | 27% |
25 Properties |
| 2012 | £375,867 | -44% |
17 Properties |
| 2011 | £541,566 | 17% |
15 Properties |
| 2010 | £451,000 | 19% |
5 Properties |
| 2009 | £366,156 | -22% |
10 Properties |
| 2008 | £446,750 | -6% |
11 Properties |
| 2007 | £475,192 | 20% |
35 Properties |
| 2006 | £382,355 | -12% |
38 Properties |
| 2005 | £428,379 | 9% |
29 Properties |
| 2004 | £391,088 | 5% |
43 Properties |
| 2003 | £373,218 | 20% |
16 Properties |
| 2002 | £299,269 | 5% |
13 Properties |
| 2001 | £283,212 | -2% |
20 Properties |
| 2000 | £287,461 | 21% |
13 Properties |
| 1999 | £227,938 | 1% |
13 Properties |
| 1998 | £224,999 | 25% |
15 Properties |
| 1997 | £168,615 | 8% |
10 Properties |
| 1996 | £155,750 | 17% |
22 Properties |
| 1995 | £128,772 | - |
11 Properties |
Property Price per Property Type in Chieveley
Here you can find historic sold price data in order to help with your property search.
The average Property Paid Price for specific property types in the last three years are:
| Property Type | Average Sold Price | Sold Properties |
|---|---|---|
| Semi Detached House | £1,266,000.00 | 5 Semi Detached Houses |
| Terraced House | £307,500.00 | 2 Terraced Houses |
| Flat | £295,000.00 | 1 Flat |
| Detached House | £831,208.00 | 24 Detached Houses |

