
Houses for sale & to rent in Chieveley, Thatcham
House Prices in Chieveley
Properties in Chieveley have an average house price of £741k and had 26 Property Transactions within the last 3 years¹.
Chieveley is an area in Thatcham, West Berkshire with 330 households², where the most expensive property was sold for £1.36M.
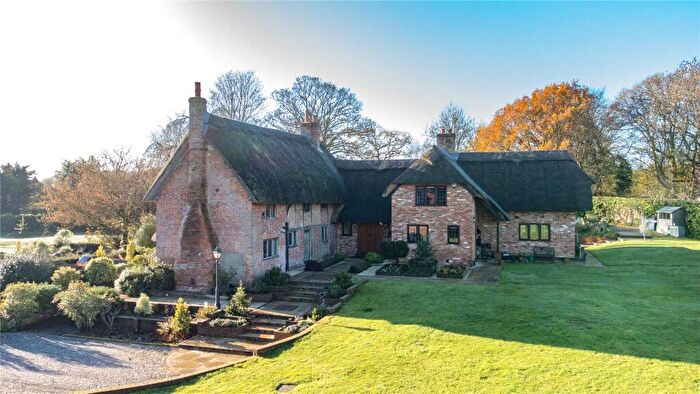
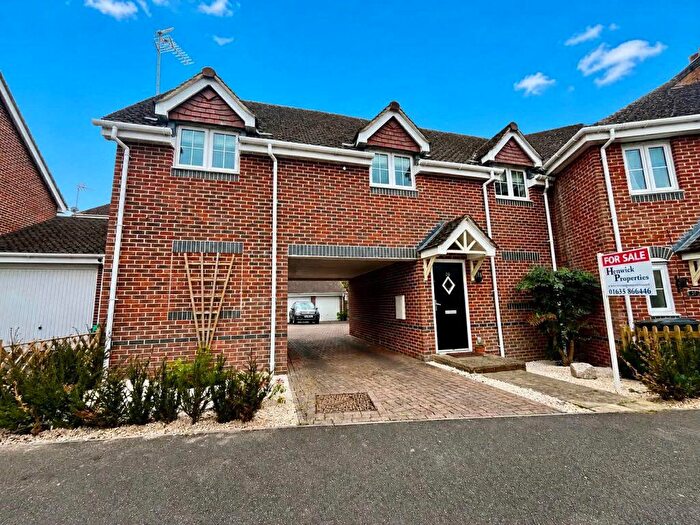
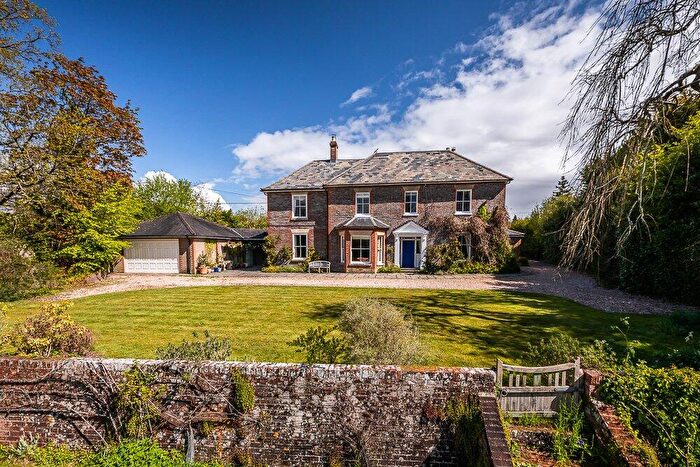
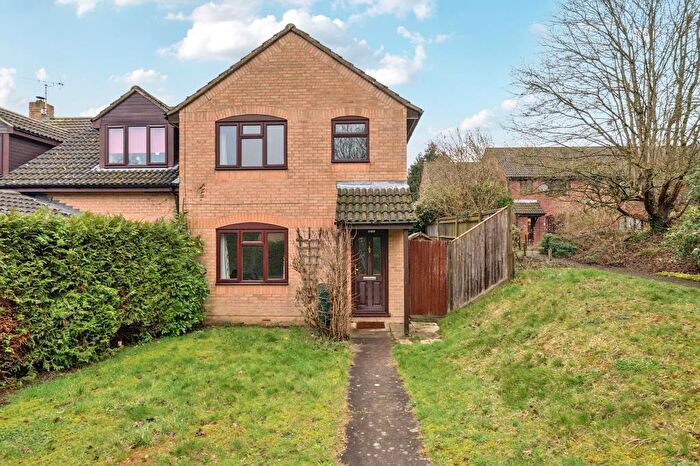
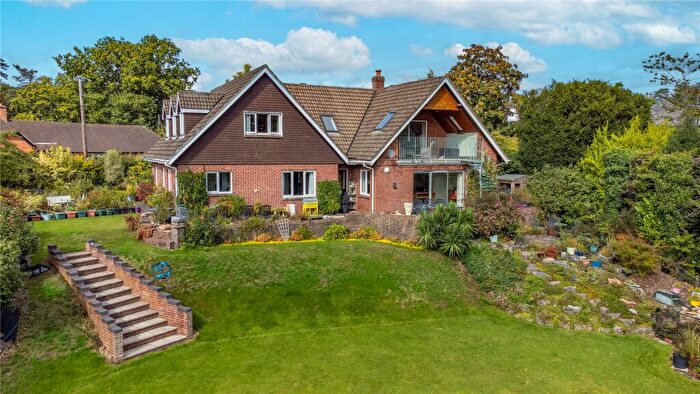
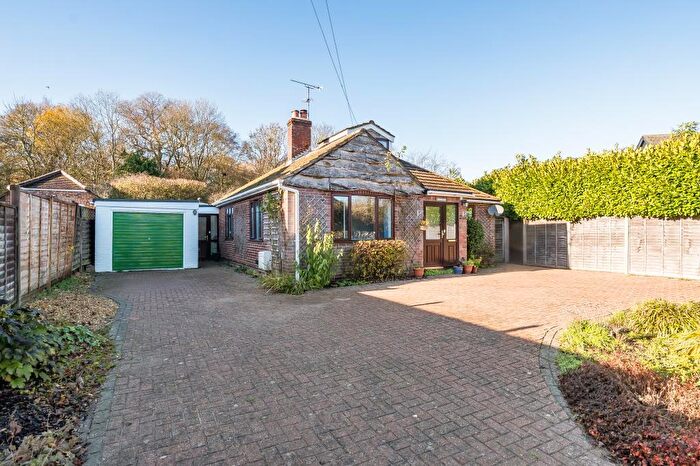
Properties for sale in Chieveley
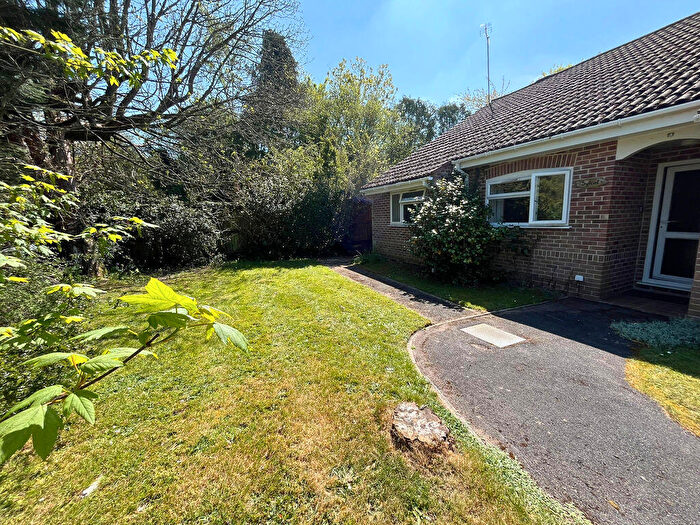

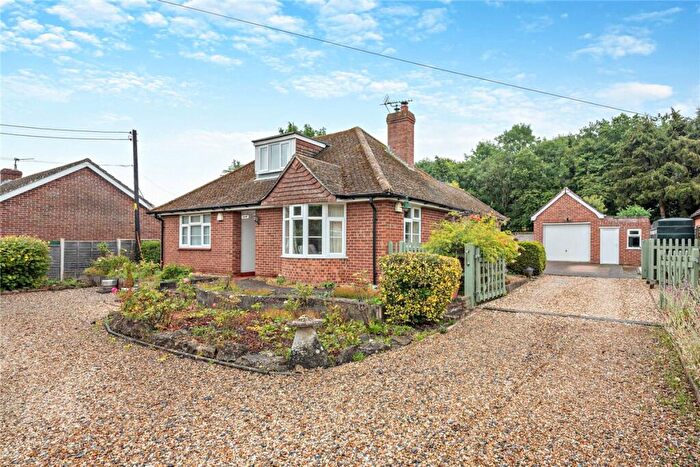
![]()
If you are looking to sell your house, let it out, or receive a property valuation, an expert can help you.
Click the button below to get started.


Previously listed properties in Chieveley
Roads and Postcodes in Chieveley
Navigate through our locations to find the location of your next house in Chieveley, Thatcham for sale or to rent.
| Streets | Postcodes |
|---|---|
| Chapel Lane | RG18 9DX |
| Crabtree Lane | RG18 9DP |
| Curridge | RG18 9DL RG18 9DN RG18 9DU RG18 9DZ RG18 9ED RG18 9EF |
| Curridge Green | RG18 9EA |
| Curridge Road | RG18 9DH RG18 9NA |
| Faircross | RG18 9TJ RG18 9TL |
| Kiln Drive | RG18 9EG |
| Kiln Terrace | RG18 9DY |
| Layleys Green | RG18 9DQ |
| Long Lane | RG18 9LU RG18 9QR RG18 9QT RG18 9TE |
| Marsh Lane | RG18 9EE |
| Oaklands | RG18 9EH |
| Oare | RG18 9SB RG18 9SD RG18 9SE RG18 9SG |
| Plantation Close | RG18 9DJ |
| Pond Cottages | RG18 9EB |
| Priors Court | RG18 9JT RG18 9JU |
| Priors Court Road | RG18 9TG |
| Sandy Close | RG18 9QP |
| Sandy Lane | RG18 9DG |
| The Old Nursery | RG18 9WE |
| Woodlands Close | RG18 9EQ |
Transport near Chieveley

- FAQ
- Price Paid By Year
- Property Type Price
Frequently asked questions about Chieveley
What is the average price for a property for sale in Chieveley?
The average price for a property for sale in Chieveley is £740,767. This amount is 75% higher than the average price in Thatcham. There are 226 property listings for sale in Chieveley.
What streets have the most expensive properties for sale in Chieveley?
The streets with the most expensive properties for sale in Chieveley are Oaklands at an average of £1,347,500, Curridge Road at an average of £851,500 and Priors Court at an average of £825,000.
What streets have the most affordable properties for sale in Chieveley?
The streets with the most affordable properties for sale in Chieveley are Faircross at an average of £246,666, Kiln Drive at an average of £612,050 and Long Lane at an average of £682,500.
Which train stations are available in or near Chieveley?
Some of the train stations available in or near Chieveley are Newbury Racecourse, Newbury and Thatcham.
Property Price Paid in Chieveley by Year
The average sold property price by year was:
| Year | Average Sold Price | Price Change |
Sold Properties
|
|---|---|---|---|
| 2025 | £812,700 | 9% |
10 Properties |
| 2024 | £741,250 | 8% |
4 Properties |
| 2023 | £680,662 | 38% |
12 Properties |
| 2022 | £419,463 | -79% |
5 Properties |
| 2021 | £749,687 | 22% |
8 Properties |
| 2020 | £585,818 | 0,1% |
11 Properties |
| 2019 | £585,444 | -11% |
9 Properties |
| 2018 | £652,000 | 8% |
11 Properties |
| 2017 | £599,995 | 17% |
12 Properties |
| 2016 | £497,788 | 29% |
7 Properties |
| 2015 | £353,750 | -27% |
4 Properties |
| 2014 | £448,500 | -9% |
12 Properties |
| 2013 | £490,050 | 29% |
10 Properties |
| 2012 | £350,243 | -10% |
8 Properties |
| 2011 | £386,142 | -43% |
7 Properties |
| 2010 | £550,318 | -2% |
11 Properties |
| 2009 | £562,068 | 35% |
8 Properties |
| 2008 | £366,977 | 7% |
11 Properties |
| 2007 | £340,777 | -9% |
18 Properties |
| 2006 | £372,932 | 5% |
26 Properties |
| 2005 | £353,250 | 4% |
10 Properties |
| 2004 | £337,937 | 16% |
8 Properties |
| 2003 | £283,278 | 24% |
23 Properties |
| 2002 | £216,340 | -28% |
11 Properties |
| 2001 | £276,749 | -7% |
20 Properties |
| 2000 | £295,401 | 20% |
9 Properties |
| 1999 | £237,312 | 33% |
16 Properties |
| 1998 | £158,388 | 21% |
13 Properties |
| 1997 | £124,926 | -45% |
15 Properties |
| 1996 | £181,077 | 11% |
20 Properties |
| 1995 | £161,944 | - |
9 Properties |
Property Price per Property Type in Chieveley
Here you can find historic sold price data in order to help with your property search.
The average Property Paid Price for specific property types in the last three years are:
| Property Type | Average Sold Price | Sold Properties |
|---|---|---|
| Semi Detached House | £438,000.00 | 5 Semi Detached Houses |
| Terraced House | £402,500.00 | 2 Terraced Houses |
| Detached House | £856,050.00 | 19 Detached Houses |