
Houses for sale & to rent in Downlands, Newbury
House Prices in Downlands
Properties in Downlands have an average house price of £625k and had 94 Property Transactions within the last 3 years¹.
Downlands is an area in Newbury, West Berkshire with 1,167 households², where the most expensive property was sold for £3M.
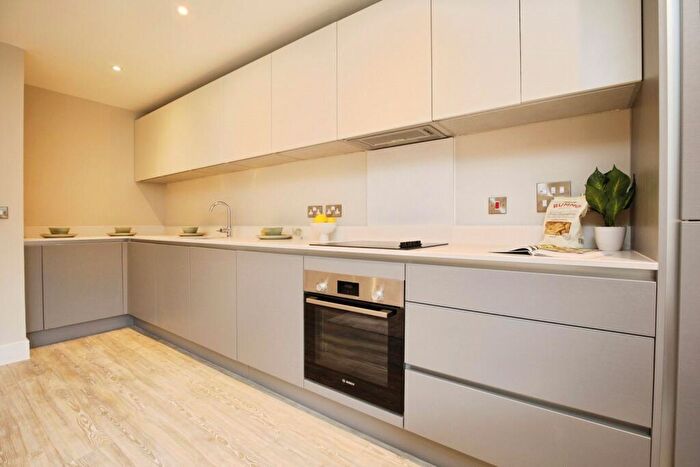
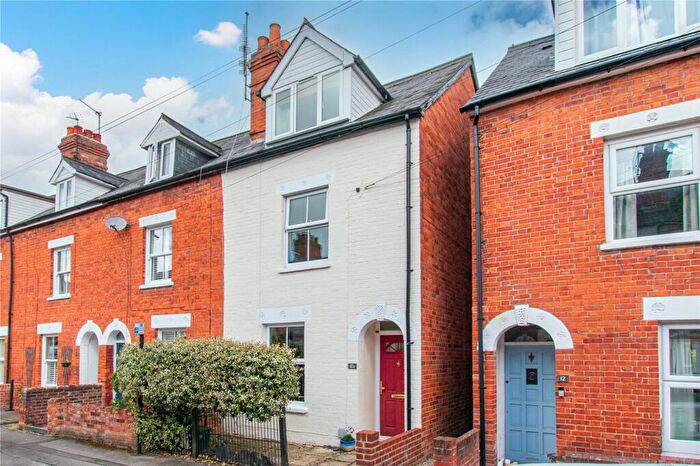
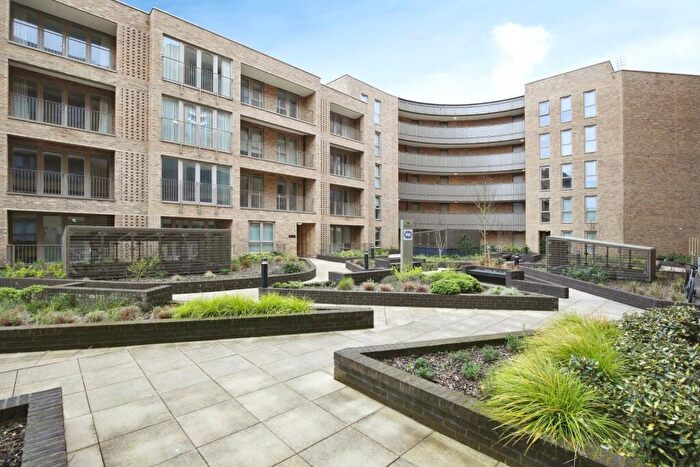
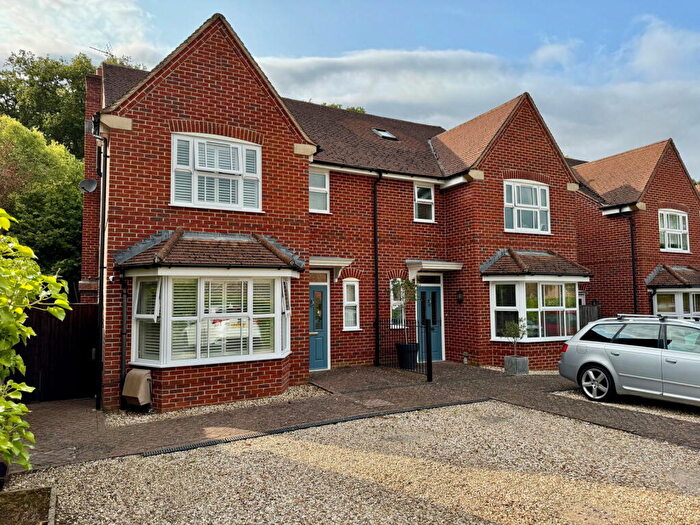
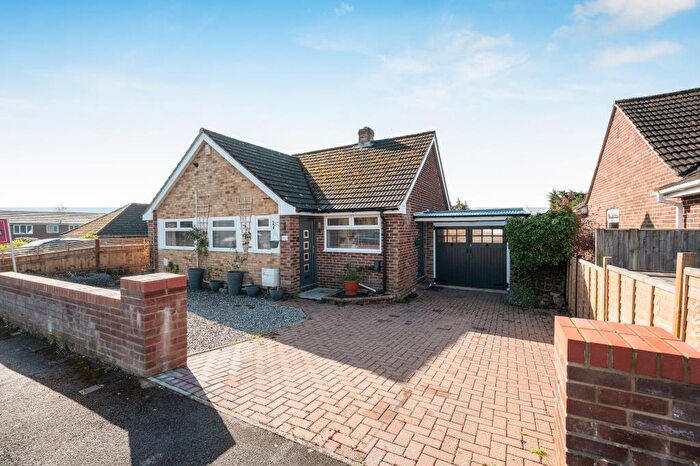
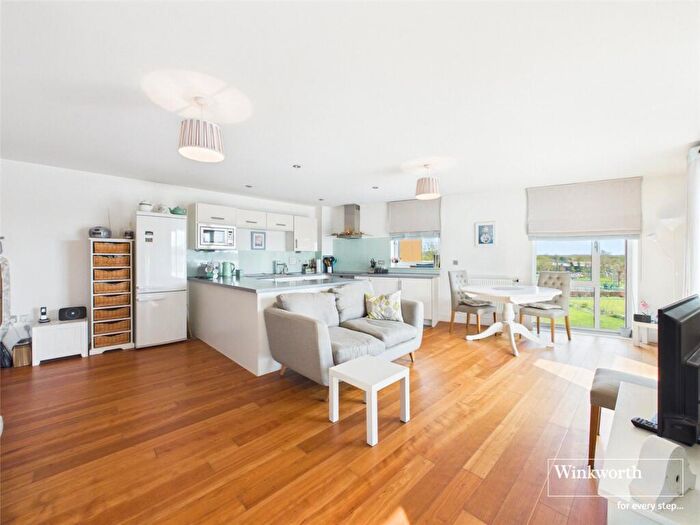
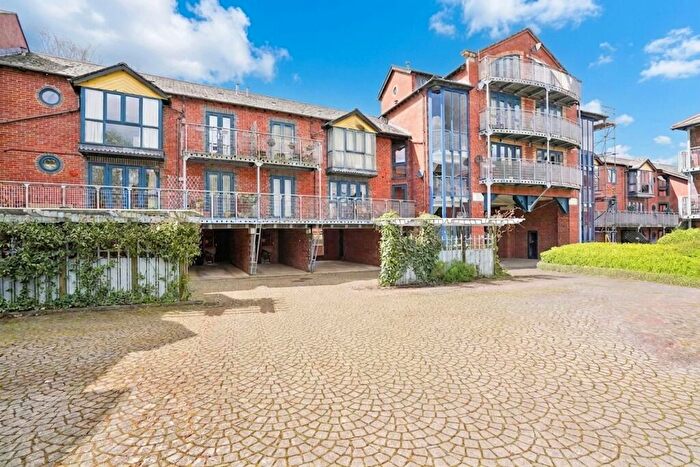
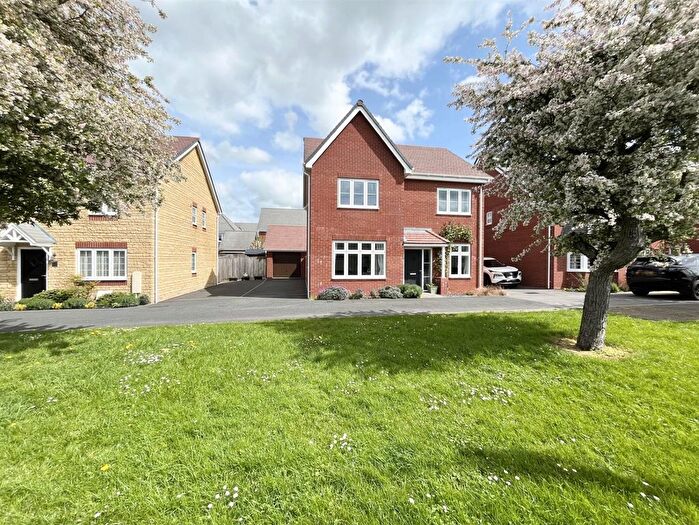
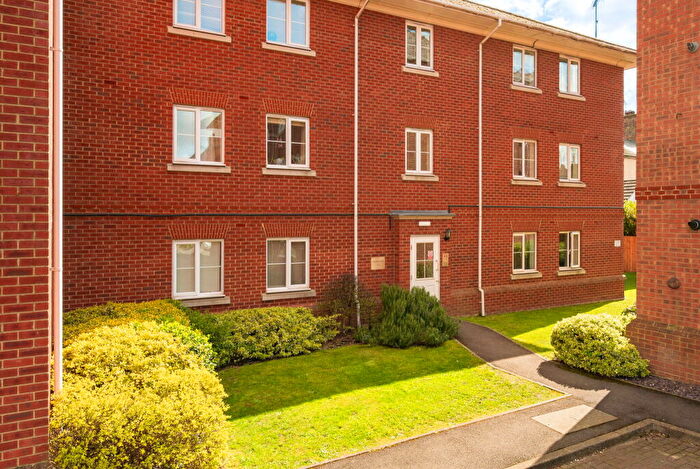
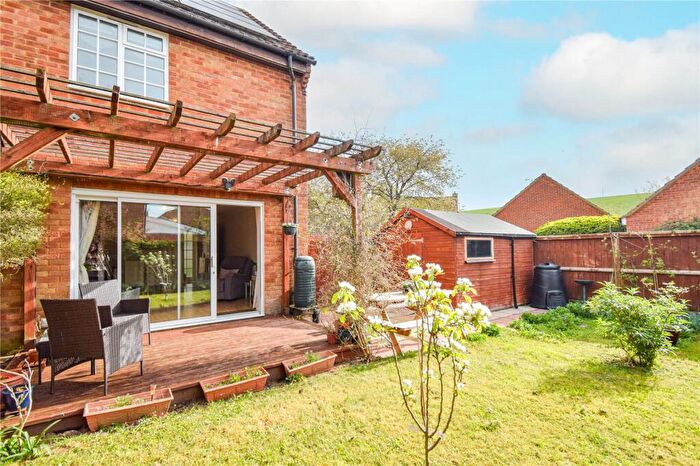
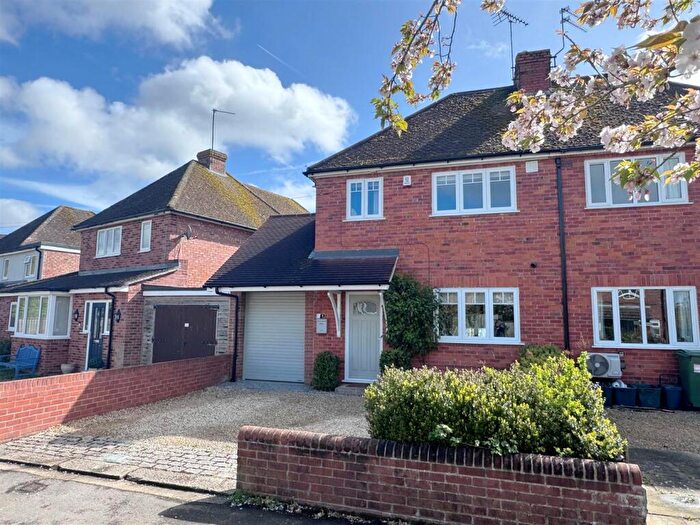
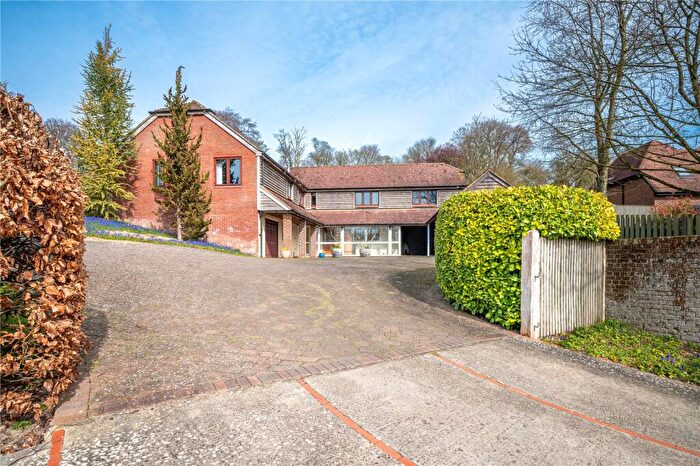
Properties for sale in Downlands
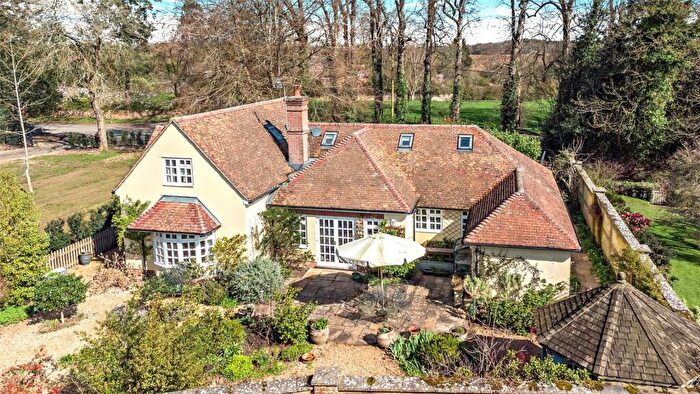
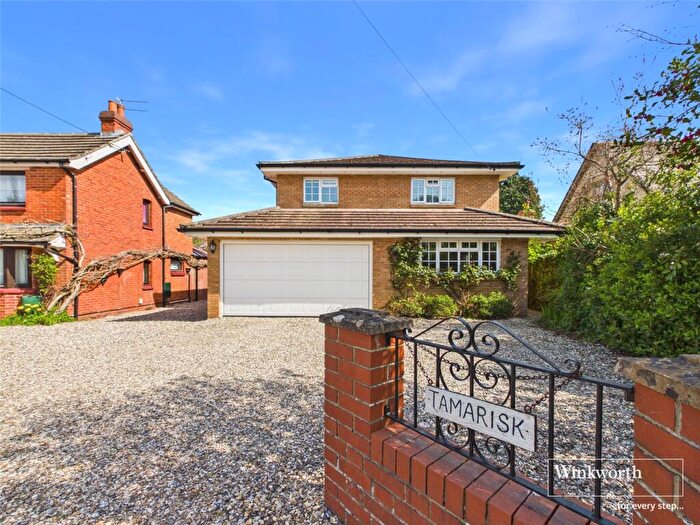
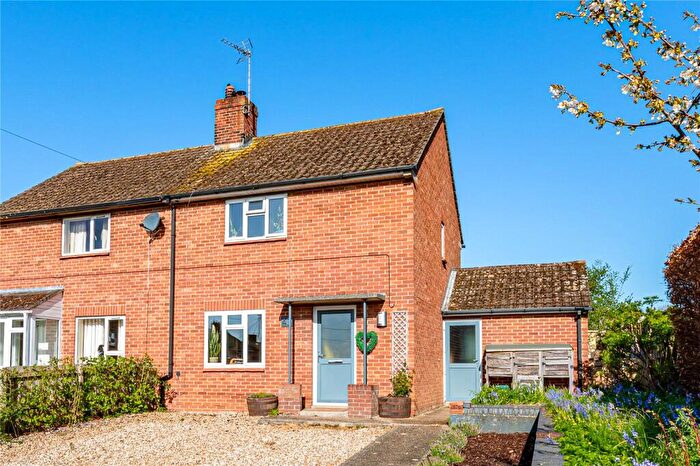
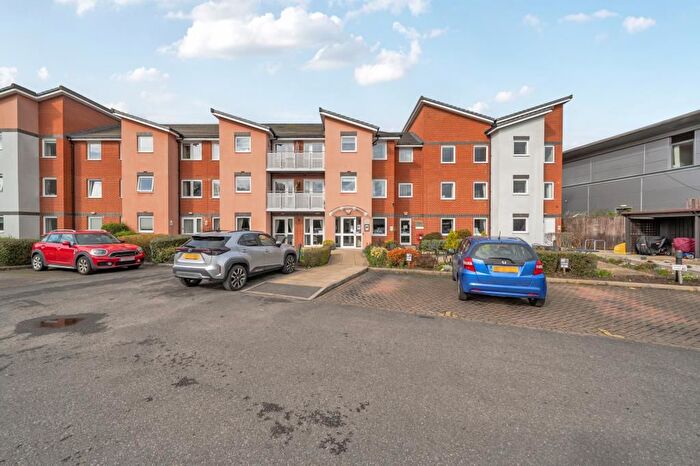
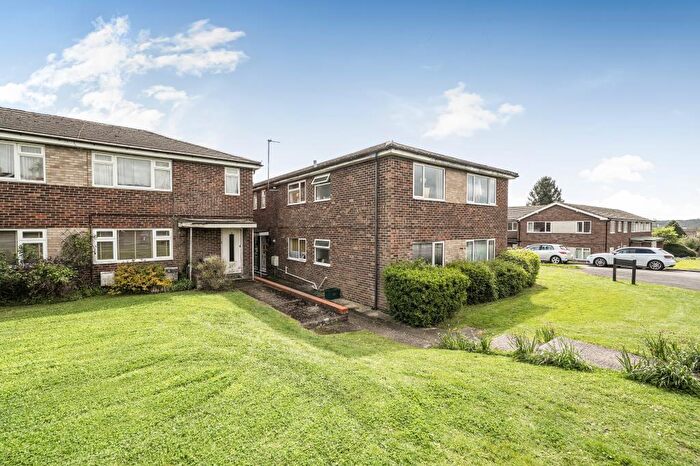
![]()
If you are looking to sell your house, let it out, or receive a property valuation, an expert can help you.
Click the button below to get started.
Roads and Postcodes in Downlands
Navigate through our locations to find the location of your next house in Downlands, Newbury for sale or to rent.
Transport near Downlands
-
 Newbury Station
 -
Newbury Racecourse Station
-
Kintbury Station
-
Hungerford Station
-
Thatcham Station
-
Didcot Parkway Station
- FAQ
- Price Paid By Year
- Property Type Price
Frequently asked questions about Downlands
What is the average price for a property for sale in Downlands?
The average price for a property for sale in Downlands is £624,746. This amount is 53% higher than the average price in Newbury. There are 4,035 property listings for sale in Downlands.
What streets have the most expensive properties for sale in Downlands?
The streets with the most expensive properties for sale in Downlands are Pudding Lane at an average of £1,505,000, The Thicket at an average of £1,011,666 and Hill Green at an average of £954,295.
What streets have the most affordable properties for sale in Downlands?
The streets with the most affordable properties for sale in Downlands are Hildesley Court at an average of £218,333, Glenn Miller Close at an average of £300,000 and Downside at an average of £318,500.
Which train stations are available in or near Downlands?
Some of the train stations available in or near Downlands are Newbury, Newbury Racecourse and Kintbury.
Property Price Paid in Downlands by Year
The average sold property price by year was:
| Year | Average Sold Price | Price Change |
Sold Properties
|
|---|---|---|---|
| 2025 | £697,481 | 25% |
33 Properties |
| 2024 | £521,701 | -26% |
32 Properties |
| 2023 | £655,683 | -13% |
29 Properties |
| 2022 | £742,173 | 23% |
36 Properties |
| 2021 | £567,999 | -8% |
46 Properties |
| 2020 | £613,737 | 3% |
40 Properties |
| 2019 | £593,727 | 11% |
24 Properties |
| 2018 | £530,054 | 6% |
32 Properties |
| 2017 | £496,657 | 14% |
47 Properties |
| 2016 | £428,235 | 9% |
27 Properties |
| 2015 | £390,267 | -17% |
24 Properties |
| 2014 | £454,786 | -6% |
30 Properties |
| 2013 | £484,125 | 6% |
31 Properties |
| 2012 | £455,369 | 13% |
28 Properties |
| 2011 | £398,236 | 1% |
29 Properties |
| 2010 | £393,217 | -3% |
32 Properties |
| 2009 | £405,805 | -2% |
27 Properties |
| 2008 | £415,735 | 13% |
17 Properties |
| 2007 | £361,153 | -3% |
54 Properties |
| 2006 | £373,387 | 2% |
53 Properties |
| 2005 | £364,342 | 8% |
34 Properties |
| 2004 | £334,313 | 12% |
51 Properties |
| 2003 | £295,181 | 2% |
65 Properties |
| 2002 | £290,574 | -7% |
55 Properties |
| 2001 | £309,984 | 27% |
33 Properties |
| 2000 | £226,925 | 3% |
42 Properties |
| 1999 | £219,845 | 19% |
43 Properties |
| 1998 | £179,022 | 14% |
37 Properties |
| 1997 | £154,106 | 4% |
40 Properties |
| 1996 | £148,521 | 0,5% |
32 Properties |
| 1995 | £147,782 | - |
45 Properties |
Property Price per Property Type in Downlands
Here you can find historic sold price data in order to help with your property search.
The average Property Paid Price for specific property types in the last three years are:
| Property Type | Average Sold Price | Sold Properties |
|---|---|---|
| Semi Detached House | £433,395.00 | 28 Semi Detached Houses |
| Detached House | £818,114.00 | 49 Detached Houses |
| Terraced House | £417,750.00 | 14 Terraced Houses |
| Flat | £218,333.00 | 3 Flats |