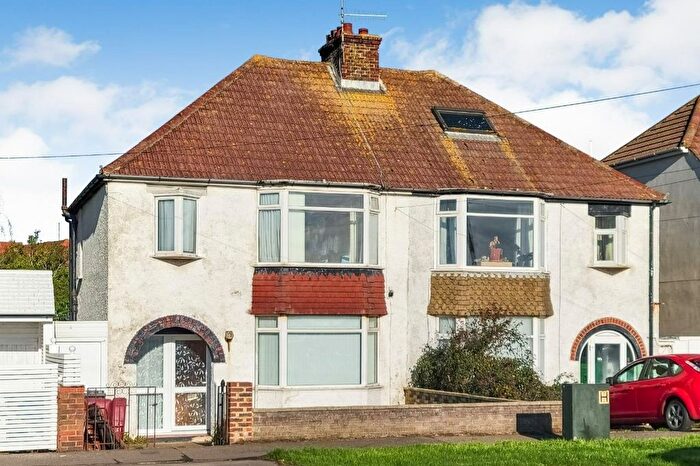
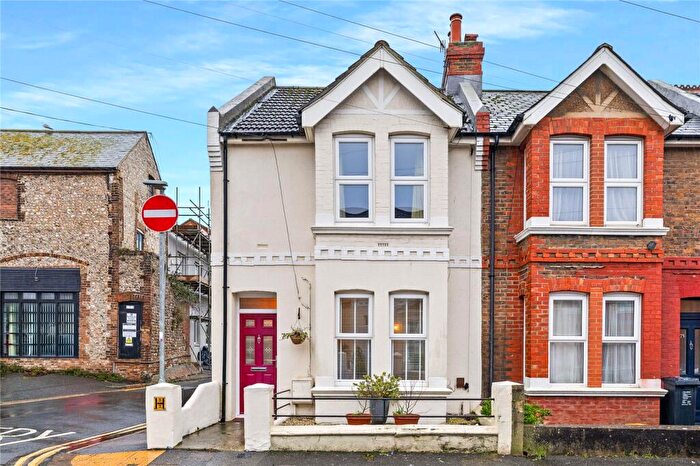
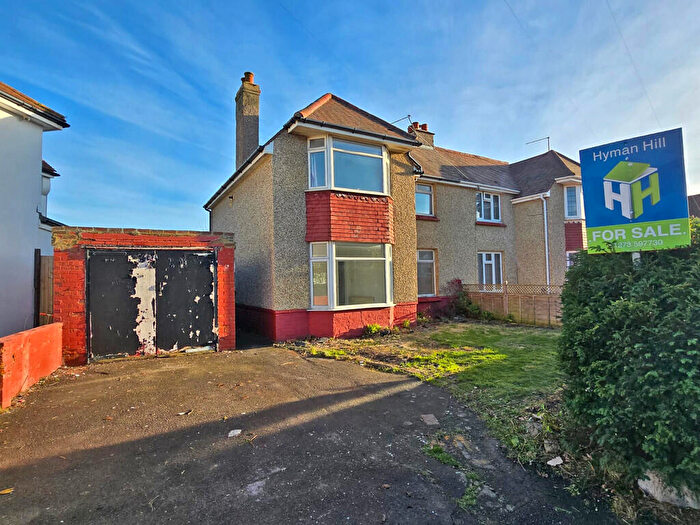
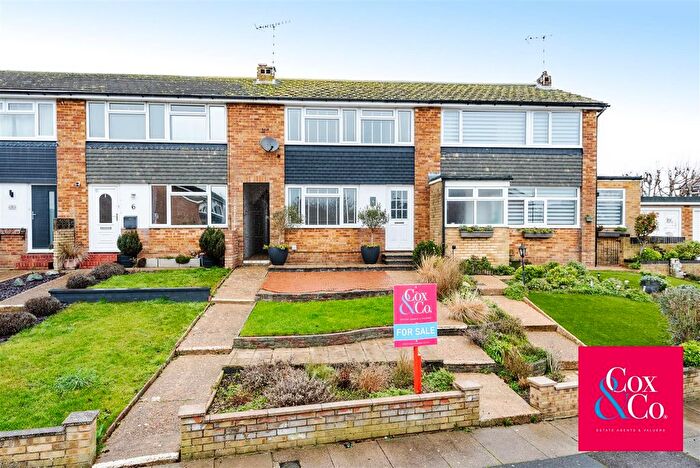
Houses for sale & to rent in Eastbrook, Brighton
House Prices in Eastbrook
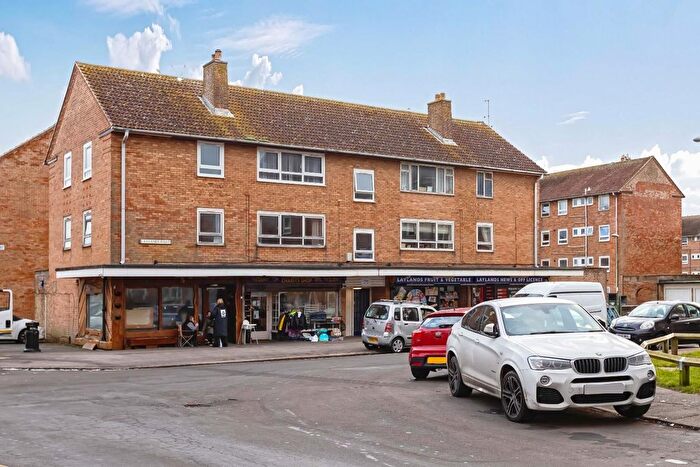
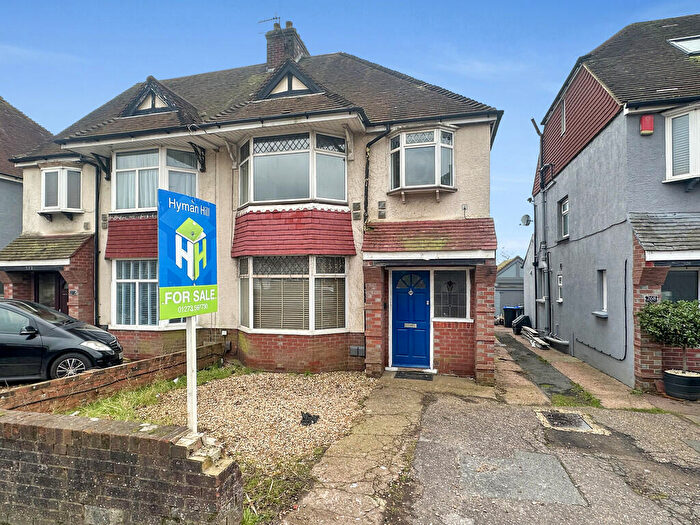
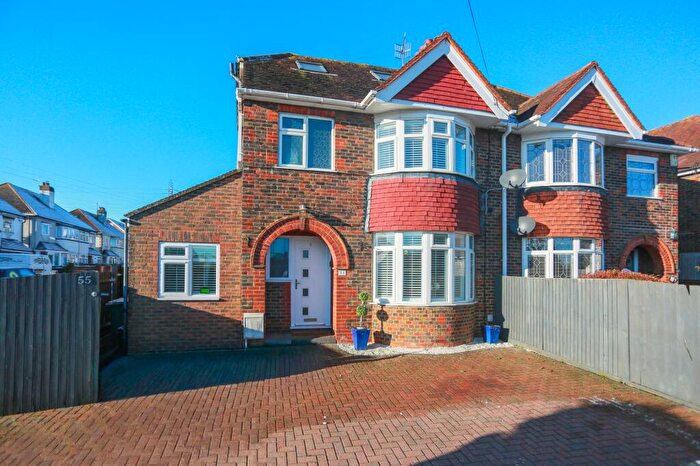
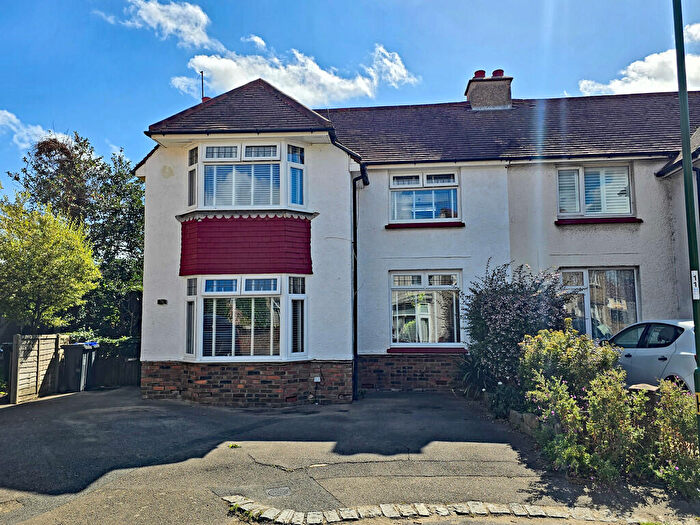
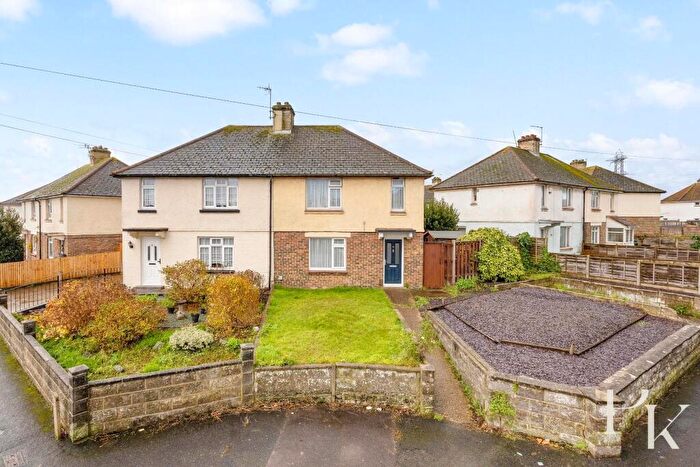
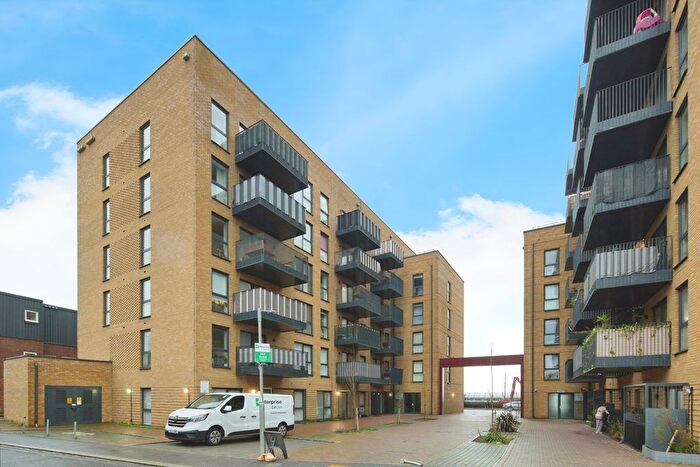
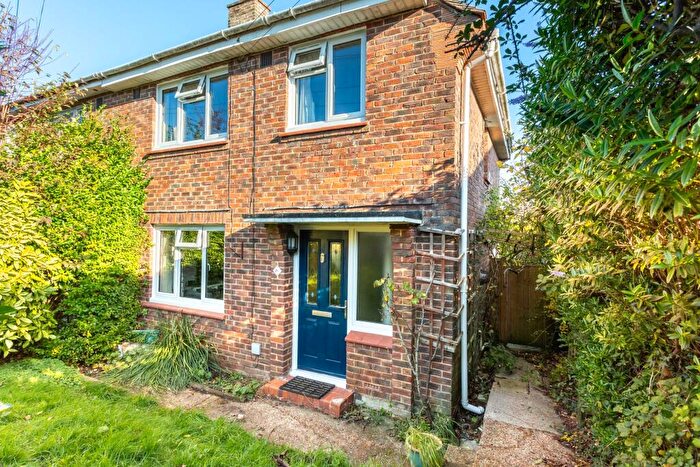
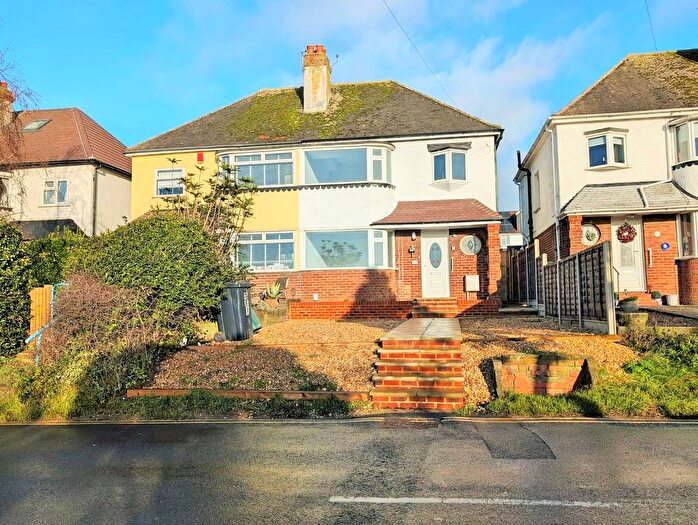
Properties in Eastbrook have an average house price of £408,234.00 and had 173 Property Transactions within the last 3 years¹.
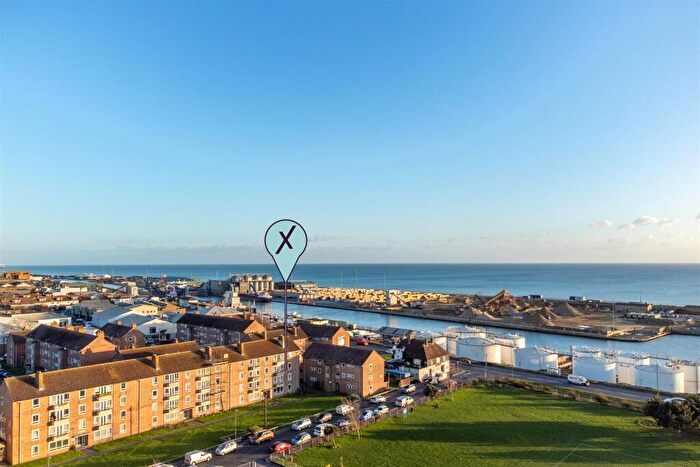
Eastbrook is an area in Brighton, West Sussex with 1,872 households², where the most expensive property was sold for £927,500.00.
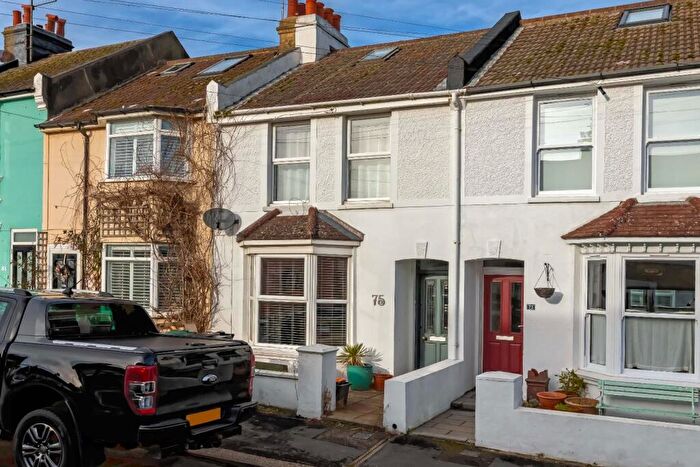
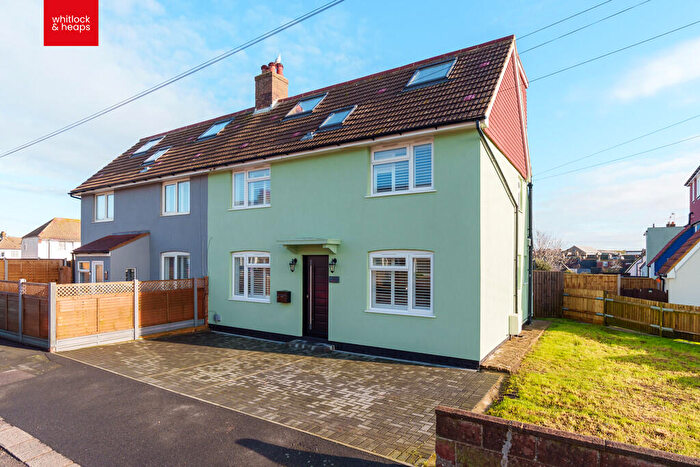
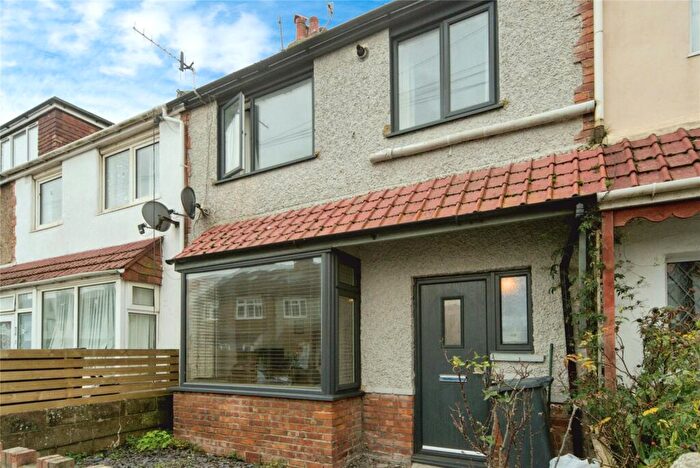
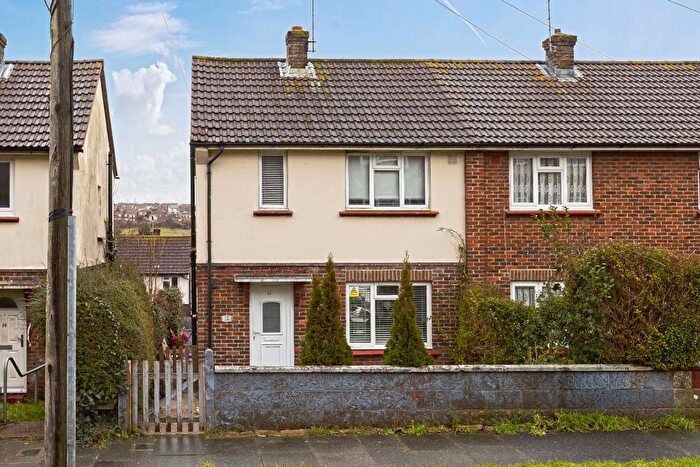
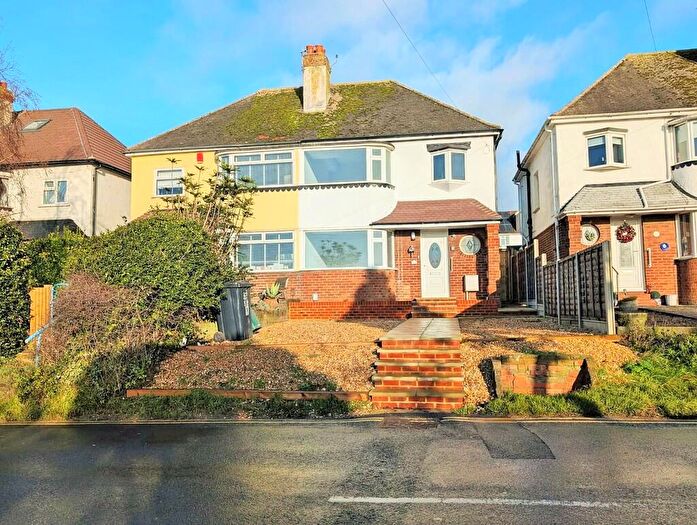
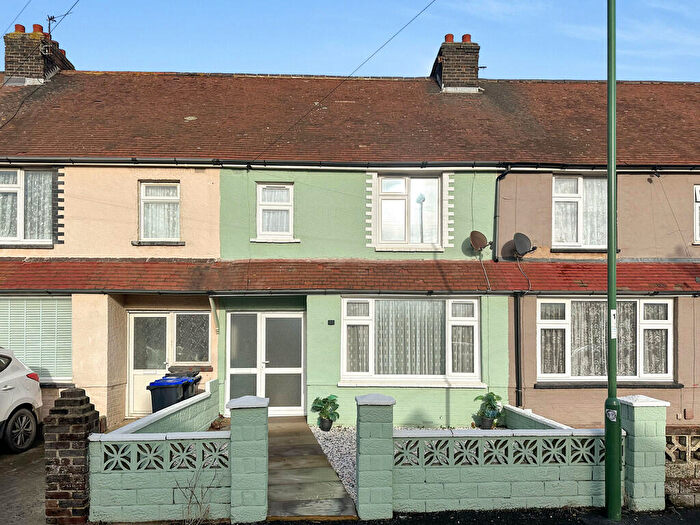
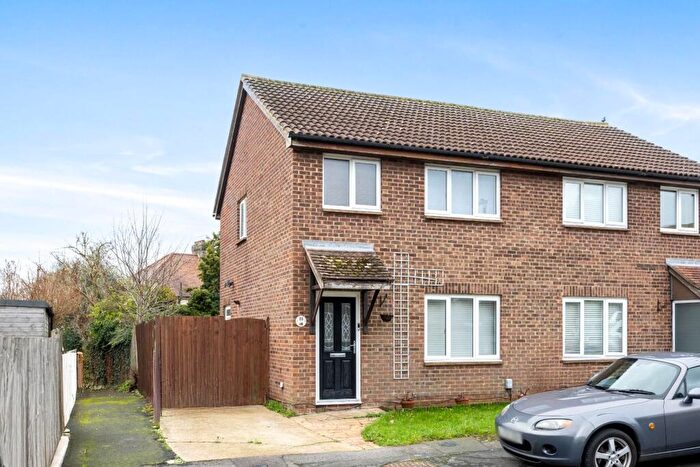
Properties for sale in Eastbrook
Roads and Postcodes in Eastbrook
Navigate through our locations to find the location of your next house in Eastbrook, Brighton for sale or to rent.
| Streets | Postcodes |
|---|---|
| Albion Street | BN42 4AT BN42 4AU BN42 4AX BN42 4BW BN42 4DP |
| Amelia Close | BN42 4AJ |
| Basin Road South | BN41 1UQ |
| Butts Road | BN42 4DR BN42 4DS |
| Channel View | BN42 4AZ |
| Chapel Road | BN41 1PF |
| Colebrook Road | BN42 4AL |
| Croft Avenue | BN42 4AA BN42 4AB |
| Eastbrook Way | BN41 1PS |
| Farm Way | BN42 4NU |
| Fishersgate Close | BN41 1QR |
| Fishersgate Terrace | BN41 1PH |
| Gardner Road | BN41 1AR BN41 1PL BN41 1PN |
| George Street | BN41 1RA |
| Glebe Close | BN42 4TF |
| Gordon Road | BN41 1PT |
| Grange Court | BN42 4DX |
| Hadrian Avenue | BN42 4LJ |
| Lady Bee Industrial Estate | BN42 4EP |
| Lady Bee Marina Industrial Estate | BN42 4EG |
| Laylands Court | BN41 1PU |
| Laylands Road | BN41 1PP |
| Locks Court | BN42 4DW |
| Manor Close | BN42 4NW |
| Manor Court | BN42 4NY |
| Manor Hall Road | BN42 4NA BN42 4NB BN42 4ND BN42 4NG BN42 4NH BN42 4NL BN42 4NN BN42 4NP BN42 4NQ BN42 4NR BN42 4NF |
| Meadow Close | BN42 4NX |
| Mill Road | BN41 1PD BN41 1PX |
| Milton Drive | BN42 4NE |
| Old Barn Way | BN42 4NS BN42 4NT |
| Old Mill Close | BN41 1PQ |
| Old Shoreham Road | BN42 4LN BN42 4LQ BN42 4LT |
| Orchard Close | BN42 4NJ |
| Park Way | BN42 4LD |
| Park Way Close | BN42 4LE |
| Riverside | BN42 4AW BN42 4BY |
| Rock Close | BN42 4DT |
| Seaview Estate | BN42 4AS |
| Southwick Street | BN42 4TG BN42 4TJ BN42 4TB BN42 4TE |
| Spring Gardens | BN42 4AF |
| Springate Road | BN42 4LF |
| St Aubyns Crescent | BN41 1PJ |
| St Aubyns Road | BN41 1PE BN41 1PW |
| St Richards Road | BN41 1PA |
| Station Road | BN42 4AE |
| Summer Close | BN41 1QF |
| The Crescent | BN42 4LA BN42 4LB BN42 4LG BN42 4LH |
| The Gardens | BN42 4AN BN42 4AP BN42 4AQ BN42 4AR |
| Waterside Road | BN41 1AZ |
| West Road | BN41 1PR BN41 1QH |
| Westbrook Way | BN42 4BF |
| Whiterock Place | BN42 4AG BN42 4AY BN42 4BA BN42 4BB |
| William Street | BN41 1PZ |
Transport near Eastbrook
-
Southwick Station
-
Fishersgate Station
-
Portslade Station
-
Shoreham-By-Sea Station
-
Aldrington Station
-
Hove Station
- FAQ
- Price Paid By Year
- Property Type Price
Frequently asked questions about Eastbrook
What is the average price for a property for sale in Eastbrook?
The average price for a property for sale in Eastbrook is £408,234. This amount is 8% lower than the average price in Brighton. There are 818 property listings for sale in Eastbrook.
What streets have the most expensive properties for sale in Eastbrook?
The streets with the most expensive properties for sale in Eastbrook are Glebe Close at an average of £642,500, Springate Road at an average of £613,333 and The Crescent at an average of £561,071.
What streets have the most affordable properties for sale in Eastbrook?
The streets with the most affordable properties for sale in Eastbrook are Locks Court at an average of £189,260, Laylands Court at an average of £201,000 and Butts Road at an average of £209,983.
Which train stations are available in or near Eastbrook?
Some of the train stations available in or near Eastbrook are Southwick, Fishersgate and Portslade.
Property Price Paid in Eastbrook by Year
The average sold property price by year was:
| Year | Average Sold Price | Price Change |
Sold Properties
|
|---|---|---|---|
| 2025 | £442,783 | 20% |
30 Properties |
| 2024 | £354,335 | -14% |
42 Properties |
| 2023 | £402,804 | -9% |
50 Properties |
| 2022 | £437,621 | 15% |
51 Properties |
| 2021 | £373,735 | 8% |
75 Properties |
| 2020 | £344,732 | 11% |
47 Properties |
| 2019 | £306,980 | -7% |
47 Properties |
| 2018 | £328,952 | -2% |
59 Properties |
| 2017 | £335,325 | 10% |
46 Properties |
| 2016 | £300,618 | 8% |
61 Properties |
| 2015 | £275,945 | 15% |
53 Properties |
| 2014 | £234,096 | -10% |
57 Properties |
| 2013 | £258,185 | 13% |
50 Properties |
| 2012 | £223,909 | 16% |
48 Properties |
| 2011 | £187,848 | -9% |
57 Properties |
| 2010 | £203,932 | 6% |
84 Properties |
| 2009 | £192,442 | -11% |
41 Properties |
| 2008 | £213,848 | -1% |
36 Properties |
| 2007 | £215,378 | -1% |
65 Properties |
| 2006 | £218,076 | 19% |
66 Properties |
| 2005 | £177,605 | 0,5% |
69 Properties |
| 2004 | £176,732 | 13% |
61 Properties |
| 2003 | £153,207 | 7% |
70 Properties |
| 2002 | £142,074 | 15% |
88 Properties |
| 2001 | £120,999 | 13% |
86 Properties |
| 2000 | £104,932 | 24% |
66 Properties |
| 1999 | £80,178 | 4% |
86 Properties |
| 1998 | £77,033 | 6% |
66 Properties |
| 1997 | £72,303 | 15% |
80 Properties |
| 1996 | £61,466 | 9% |
62 Properties |
| 1995 | £55,650 | - |
58 Properties |
Property Price per Property Type in Eastbrook
Here you can find historic sold price data in order to help with your property search.
The average Property Paid Price for specific property types in the last three years are:
| Property Type | Average Sold Price | Sold Properties |
|---|---|---|
| Semi Detached House | £482,234.00 | 75 Semi Detached Houses |
| Detached House | £531,330.00 | 18 Detached Houses |
| Terraced House | £369,722.00 | 46 Terraced Houses |
| Flat | £231,932.00 | 34 Flats |

