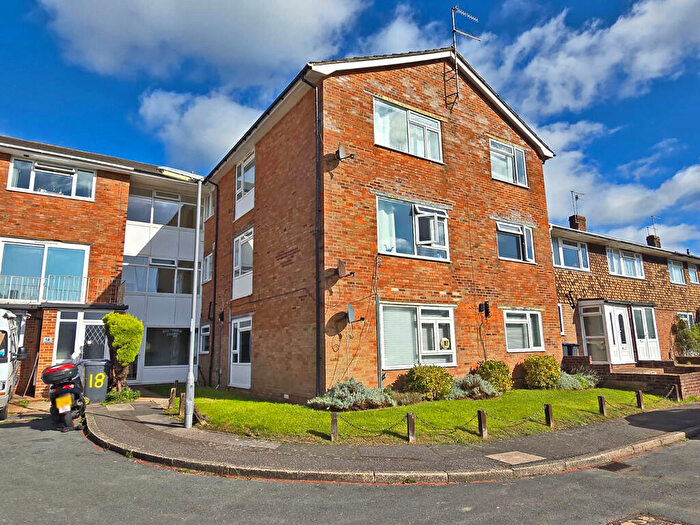
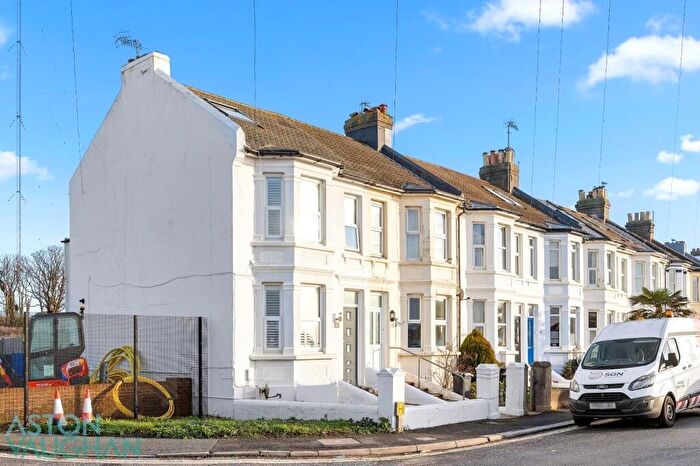
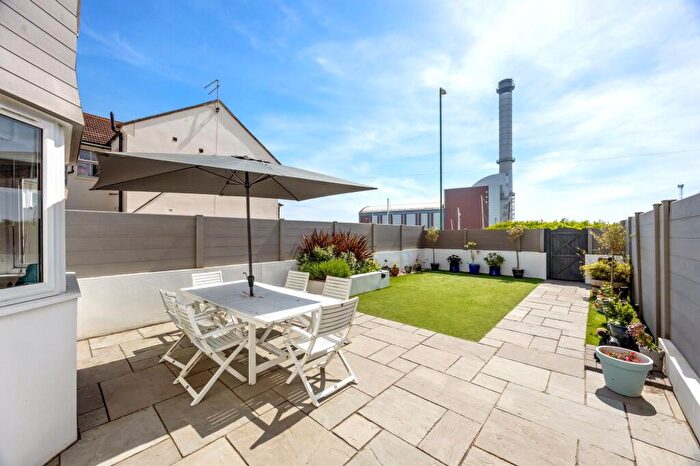
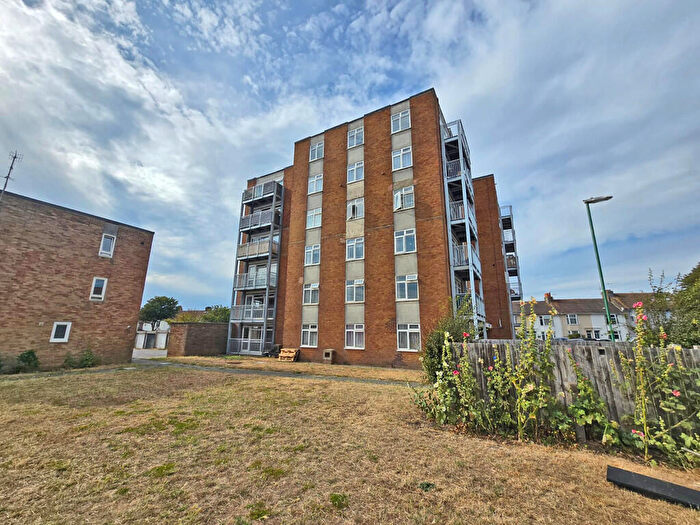
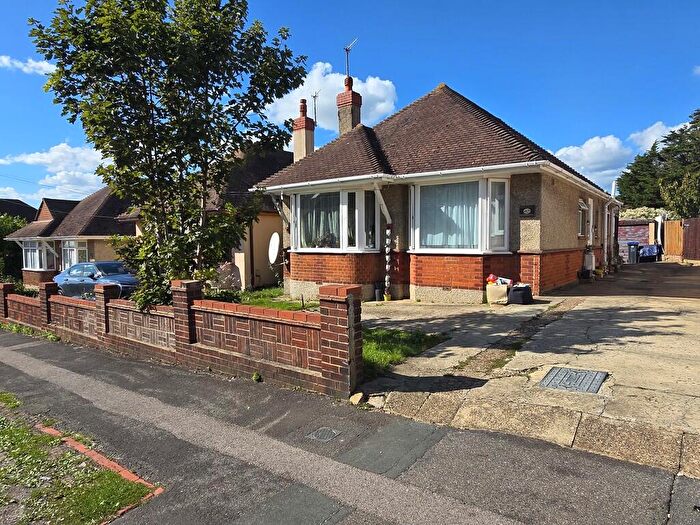
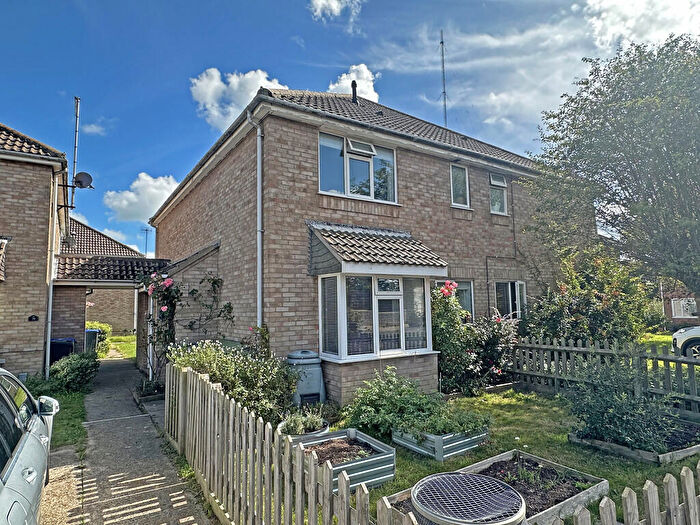
Houses for sale & to rent in Southwick Green, Brighton
House Prices in Southwick Green
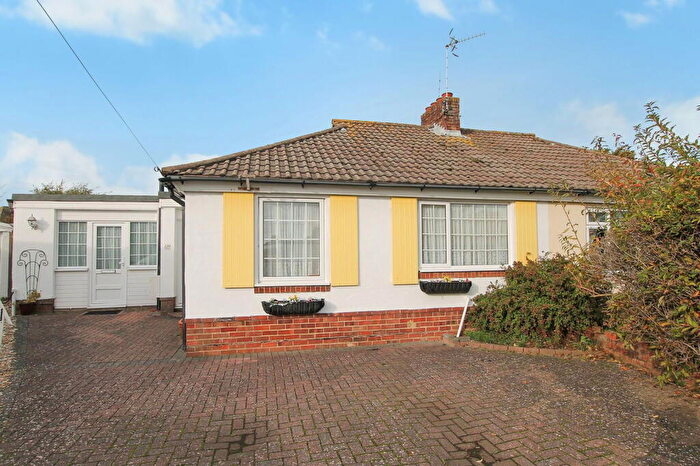
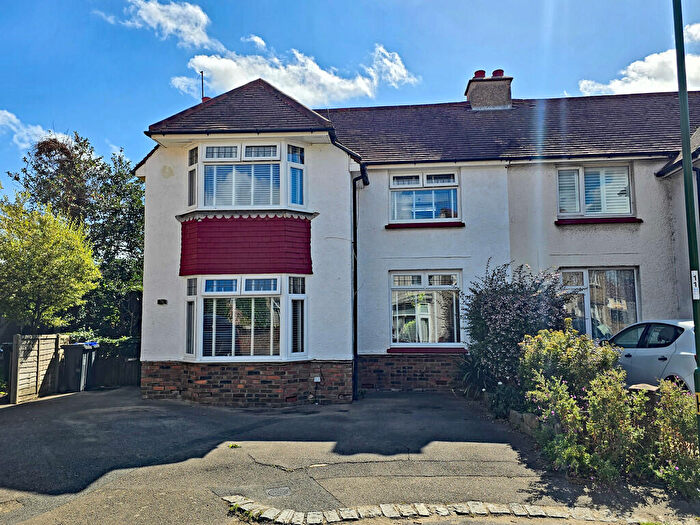
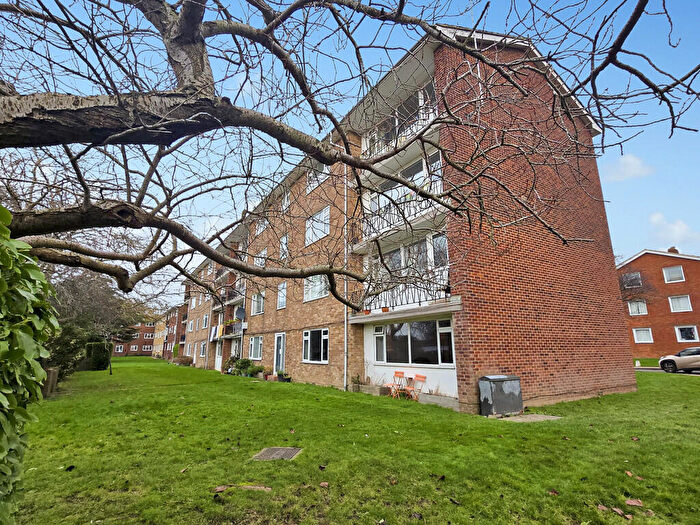
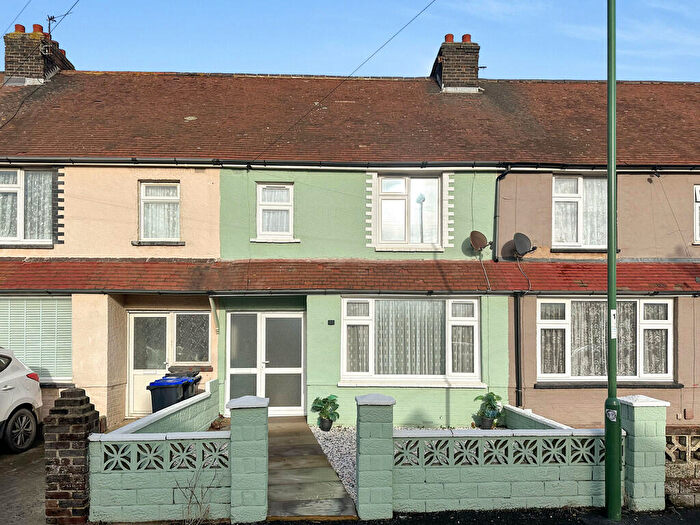
Properties in Southwick Green have an average house price of £451,274.00 and had 149 Property Transactions within the last 3 years¹.
Southwick Green is an area in Brighton, West Sussex with 1,394 households², where the most expensive property was sold for £1,575,000.00.
Properties for sale in Southwick Green
Roads and Postcodes in Southwick Green
Navigate through our locations to find the location of your next house in Southwick Green, Brighton for sale or to rent.
| Streets | Postcodes |
|---|---|
| Albert Road | BN42 4GE |
| Albion Street | BN42 4DN BN42 4ED BN42 4BX |
| Cardigan Villas | BN42 4GG |
| Church Lane | BN42 4GB BN42 4GD |
| Cross Road | BN42 4HD BN42 4HE BN42 4HF BN42 4HG BN42 4HH BN42 4HJ |
| Cross Road Close | BN42 4HW |
| Grange Road | BN42 4DQ |
| Grange Road Industrial Estate | BN42 4EN |
| Green Close | BN42 4GR |
| Greenfield Close | BN42 4TQ |
| Hope Cottages | BN42 4TZ |
| Kingsfield Close | BN42 4FU |
| Kingston Lane | BN42 4SJ BN42 4SP BN42 4BR |
| Meadway Court | BN42 4SL BN42 4SN |
| Old Dairy Close | BN42 4BS BN42 4BT |
| Old Rectory Gardens | BN42 4SQ |
| Old Shoreham Road | BN42 4HS BN42 4HT BN42 4HU BN42 4TR |
| Oldfield Crescent | BN42 4FZ BN42 4GA |
| Park Lane | BN42 4DL |
| Phoenix Crescent | BN42 4HR |
| Phoenix Way | BN42 4HP BN42 4HQ |
| Roman Crescent | BN42 4TY |
| Roman Road | BN42 4TP |
| Roman Way | BN42 4TN |
| Sandown Road | BN42 4HB |
| Somerly Gardens | BN42 4BU |
| Southdown Road | BN42 4FT |
| Southview Close | BN42 4TX |
| Southview Road | BN42 4TS BN42 4TT BN42 4TU BN42 4TW |
| Southwick Beach | BN41 1WD |
| Southwick Square | BN42 4FL BN42 4FQ BN42 4EY BN42 4FB BN42 4FH BN42 4FJ BN42 4FN BN42 4FP BN42 4GJ |
| Southwick Street | BN42 4AD BN42 4TH BN42 4TL BN42 4TA |
| Spinnals Grove | BN42 4DU |
| The Cotswolds | BN42 4GH |
| The Green | BN42 4DA BN42 4DE BN42 4DG BN42 4FR BN42 4FS BN42 4FW BN42 4FX BN42 4FY BN42 4GF BN42 4GS BN42 4DZ |
| The Twitten | BN42 4DB |
| Twitten Close | BN42 4DY |
| Underdown Road | BN42 4HL BN42 4HN BN42 4HA |
| Victoria Road | BN42 4DH BN42 4DJ |
| Water Dyke Avenue | BN42 4DF |
| Watling Road | BN42 4DD |
| Westmount Close | BN42 4SR |
Transport near Southwick Green
-
Southwick Station
-
Fishersgate Station
-
Shoreham-By-Sea Station
-
Portslade Station
-
Aldrington Station
-
Hove Station
- FAQ
- Price Paid By Year
- Property Type Price
Frequently asked questions about Southwick Green
What is the average price for a property for sale in Southwick Green?
The average price for a property for sale in Southwick Green is £451,274. This amount is 1% higher than the average price in Brighton. There are 536 property listings for sale in Southwick Green.
What streets have the most expensive properties for sale in Southwick Green?
The streets with the most expensive properties for sale in Southwick Green are Spinnals Grove at an average of £773,333, Old Rectory Gardens at an average of £702,500 and Park Lane at an average of £650,625.
What streets have the most affordable properties for sale in Southwick Green?
The streets with the most affordable properties for sale in Southwick Green are Southwick Square at an average of £238,000, Meadway Court at an average of £255,781 and Southview Close at an average of £298,670.
Which train stations are available in or near Southwick Green?
Some of the train stations available in or near Southwick Green are Southwick, Fishersgate and Shoreham-By-Sea.
Property Price Paid in Southwick Green by Year
The average sold property price by year was:
| Year | Average Sold Price | Price Change |
Sold Properties
|
|---|---|---|---|
| 2025 | £399,430 | -16% |
22 Properties |
| 2024 | £462,682 | 10% |
32 Properties |
| 2023 | £415,397 | -17% |
34 Properties |
| 2022 | £483,985 | 12% |
61 Properties |
| 2021 | £425,631 | 10% |
59 Properties |
| 2020 | £382,632 | 0,3% |
49 Properties |
| 2019 | £381,540 | 1% |
66 Properties |
| 2018 | £378,287 | 3% |
66 Properties |
| 2017 | £367,375 | 1% |
49 Properties |
| 2016 | £365,463 | 17% |
67 Properties |
| 2015 | £303,113 | 1% |
67 Properties |
| 2014 | £299,681 | 19% |
63 Properties |
| 2013 | £243,288 | -0,5% |
52 Properties |
| 2012 | £244,412 | 2% |
68 Properties |
| 2011 | £239,401 | -4% |
51 Properties |
| 2010 | £248,275 | 16% |
53 Properties |
| 2009 | £208,642 | -25% |
38 Properties |
| 2008 | £260,183 | 5% |
43 Properties |
| 2007 | £247,967 | 8% |
79 Properties |
| 2006 | £229,163 | 12% |
97 Properties |
| 2005 | £202,645 | -1% |
57 Properties |
| 2004 | £205,113 | 7% |
70 Properties |
| 2003 | £191,383 | 12% |
85 Properties |
| 2002 | £168,618 | 21% |
74 Properties |
| 2001 | £133,585 | 10% |
92 Properties |
| 2000 | £119,618 | 25% |
80 Properties |
| 1999 | £89,723 | 12% |
77 Properties |
| 1998 | £79,260 | 17% |
75 Properties |
| 1997 | £65,857 | 1% |
79 Properties |
| 1996 | £64,984 | 10% |
64 Properties |
| 1995 | £58,399 | - |
58 Properties |
Property Price per Property Type in Southwick Green
Here you can find historic sold price data in order to help with your property search.
The average Property Paid Price for specific property types in the last three years are:
| Property Type | Average Sold Price | Sold Properties |
|---|---|---|
| Semi Detached House | £507,060.00 | 32 Semi Detached Houses |
| Detached House | £680,330.00 | 35 Detached Houses |
| Terraced House | £412,784.00 | 39 Terraced Houses |
| Flat | £258,229.00 | 43 Flats |

