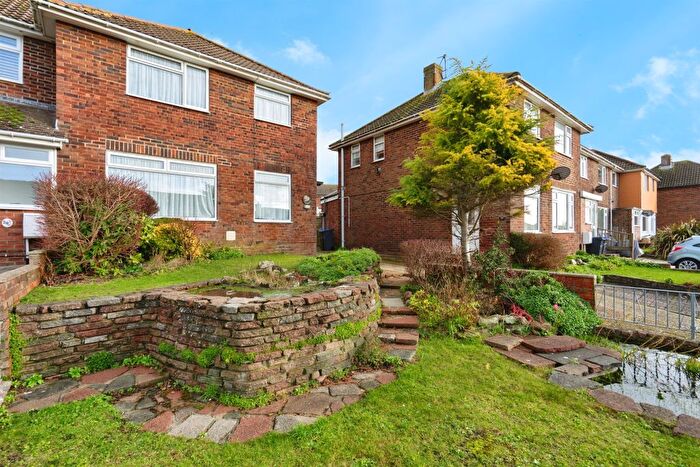
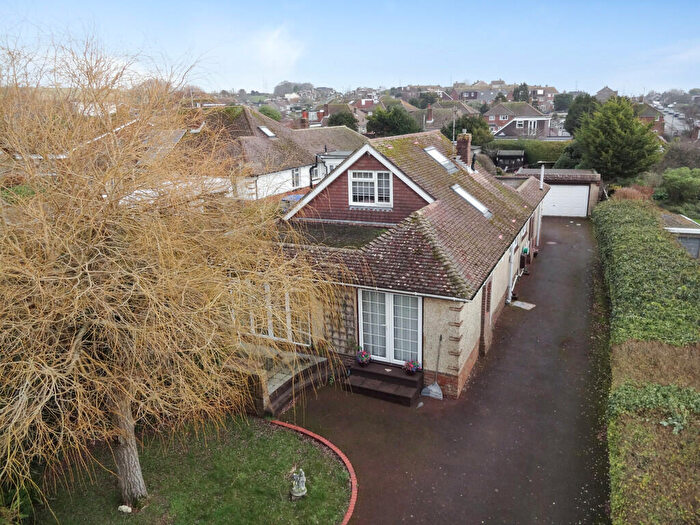
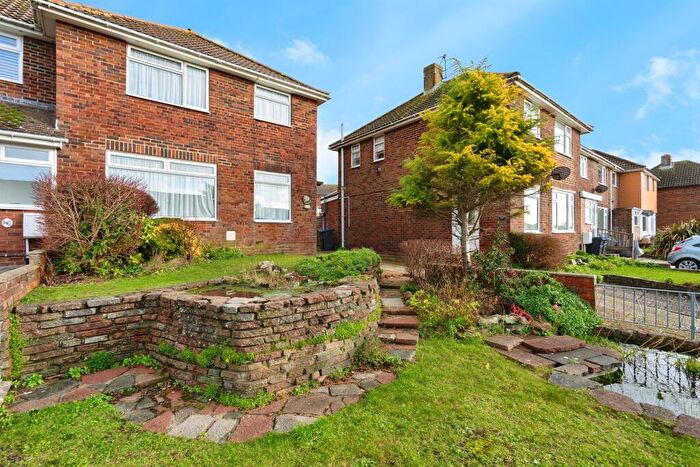
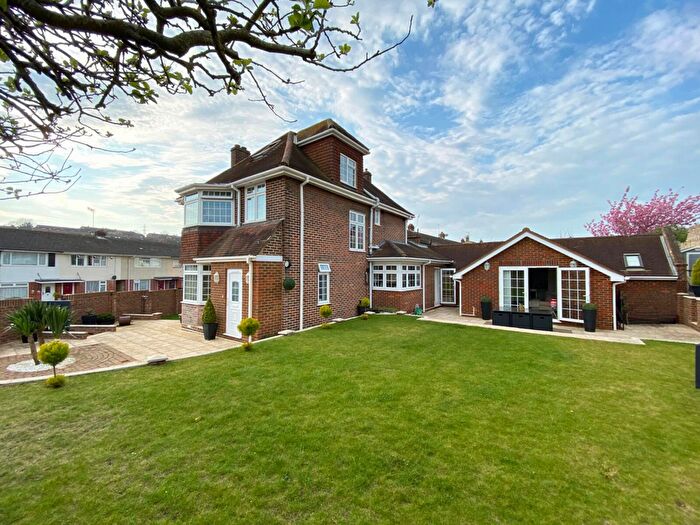
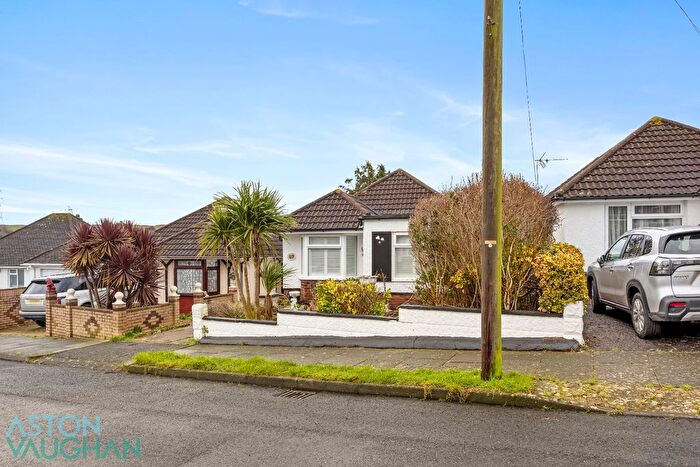
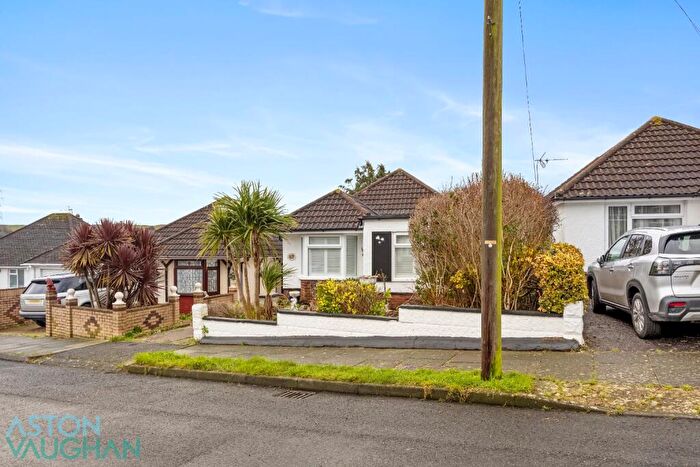
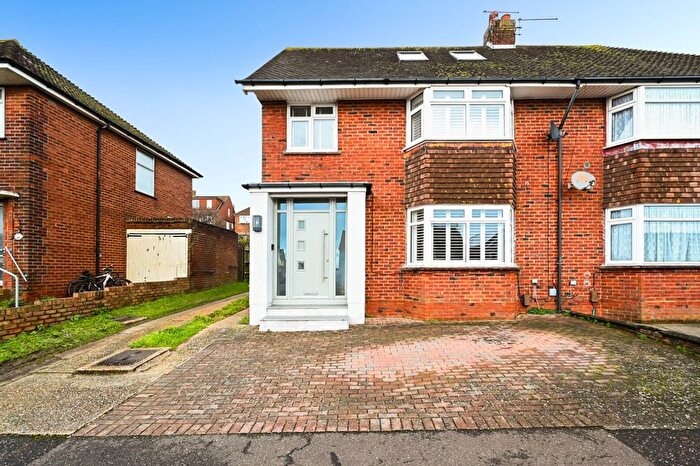
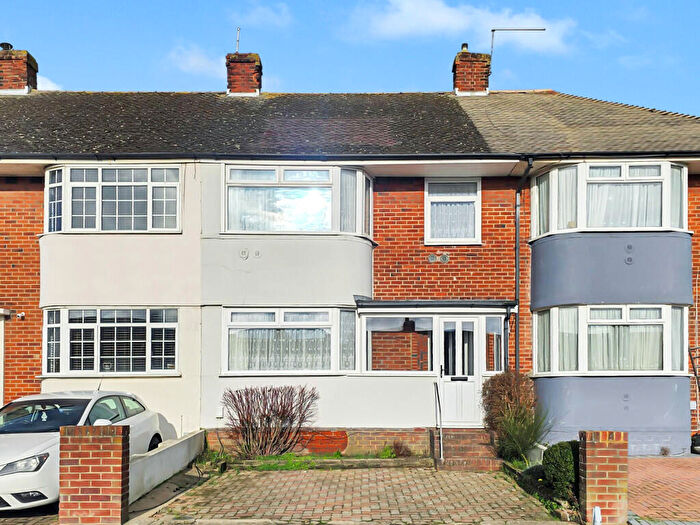
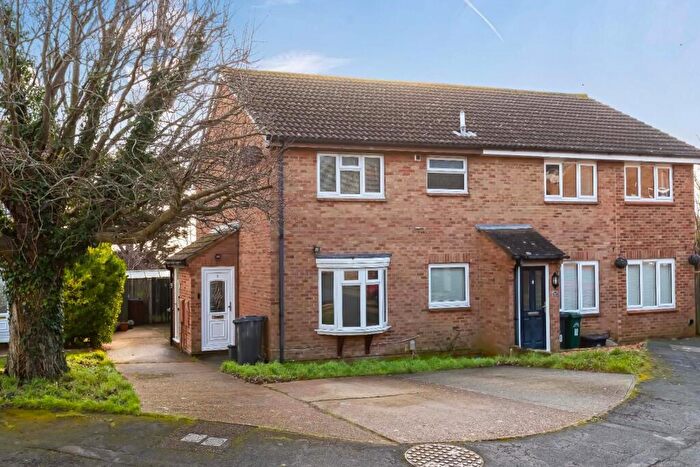
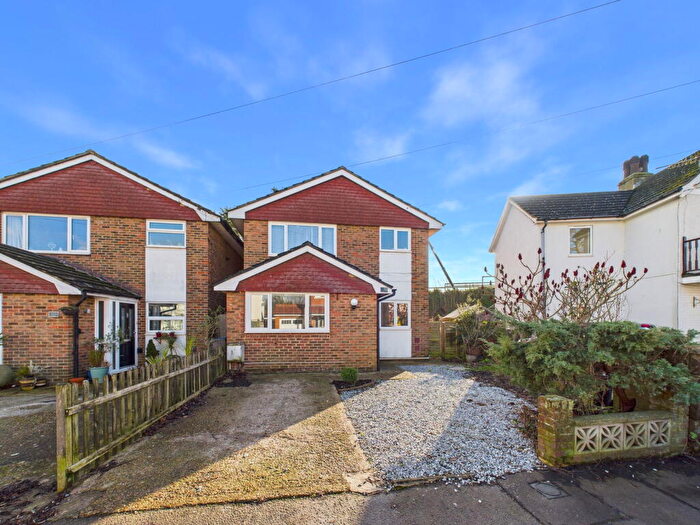
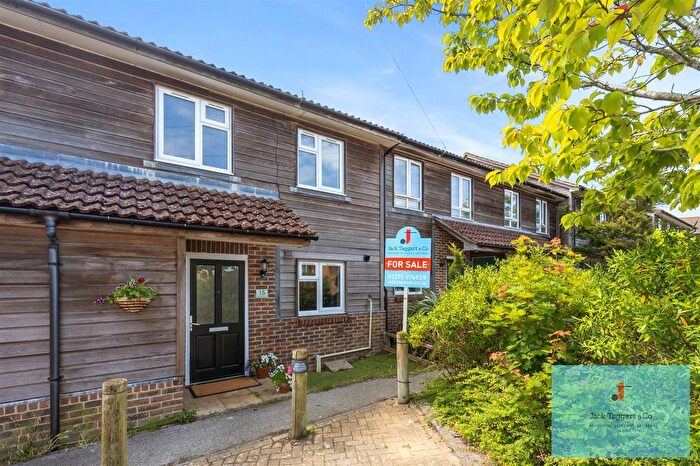
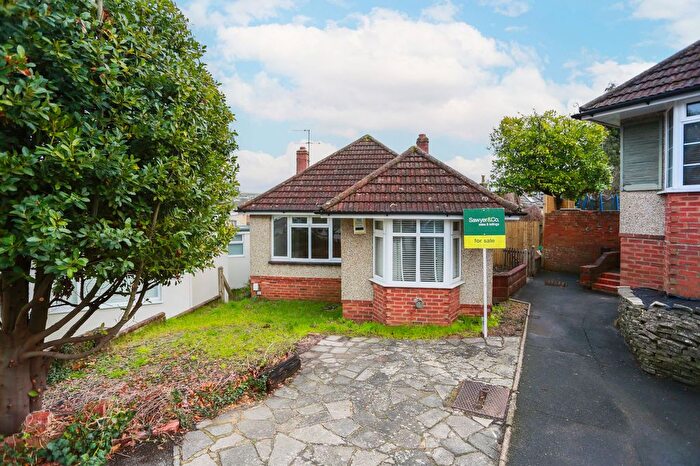
Houses for sale & to rent in Hillside, Brighton
House Prices in Hillside
Properties in Hillside have an average house price of £424,805.00 and had 135 Property Transactions within the last 3 years¹.
Hillside is an area in Brighton, West Sussex with 1,544 households², where the most expensive property was sold for £690,000.00.
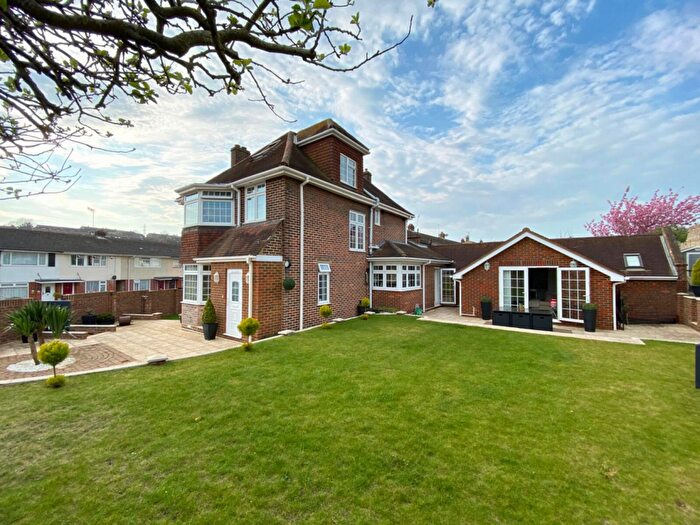
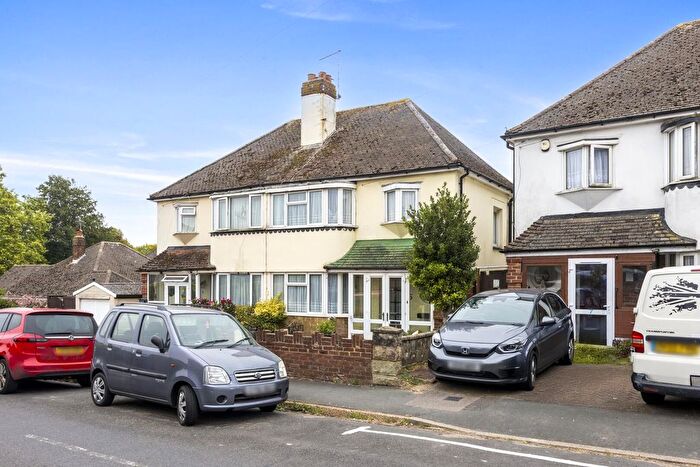
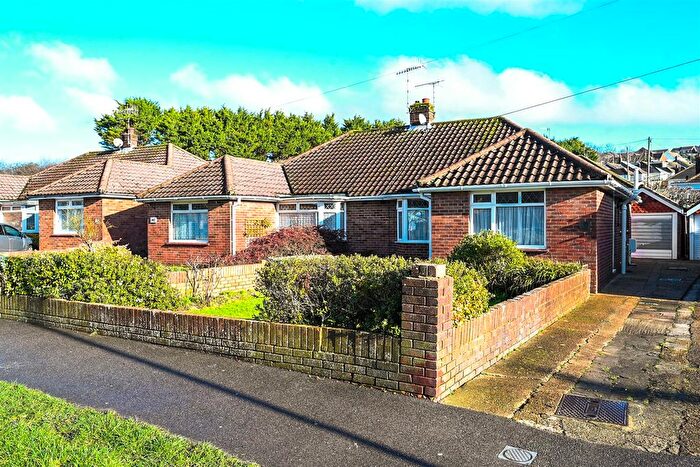
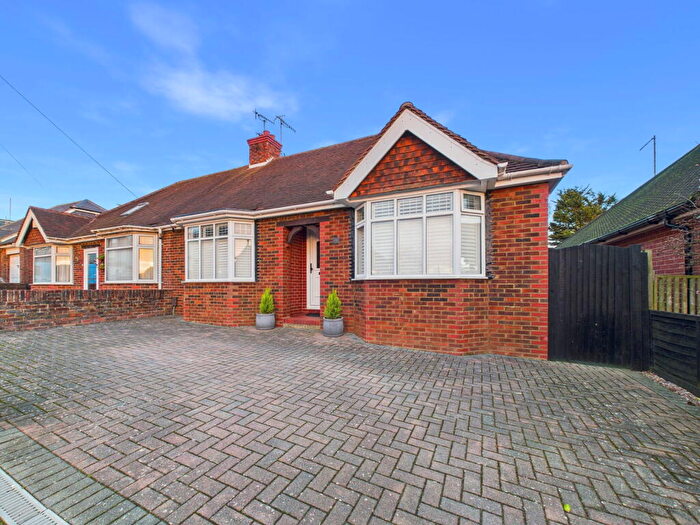
Properties for sale in Hillside
Roads and Postcodes in Hillside
Navigate through our locations to find the location of your next house in Hillside, Brighton for sale or to rent.
| Streets | Postcodes |
|---|---|
| Church House Close | BN42 4WQ |
| Cromleigh Way | BN42 4WG |
| Downland Avenue | BN42 4RF BN42 4RG BN42 4RL BN42 4RN BN42 4RX BN42 4RY |
| Downland Close | BN42 4RH |
| Downsway | BN42 4WA BN42 4WB BN42 4WD BN42 4WE BN42 4WF |
| Eastbank | BN42 4QL |
| Fairdene | BN42 4QN |
| Greenways | BN42 4QJ |
| Highdown | BN42 4QS BN42 4QT |
| Highdown Close | BN42 4QW |
| Hill Farm Way | BN42 4YG BN42 4YH BN42 4YJ |
| Hillside | BN42 4QD |
| Holmbush Way | BN42 4YA BN42 4YD BN42 4YE |
| Kings Road | BN42 4RJ |
| Lower Drive | BN42 4RT |
| Mile Oak Crescent | BN42 4QP |
| Mile Oak Road | BN42 4QE BN42 4QF BN42 4QG BN42 4QH |
| Millcroft Avenue | BN42 4RU |
| Millcroft Gardens | BN42 4RW |
| Oakapple Road | BN42 4YL |
| Old Shoreham Road | BN42 4LP BN42 4LR BN42 4LS BN42 4QB BN42 4RB BN42 4RD |
| Overhill | BN42 4WH BN42 4WJ BN42 4WL BN42 4WN |
| Paythorne Close | BN42 4YB |
| Prince Charles Close | BN42 4PQ BN42 4PR BN42 4PS BN42 4PT BN42 4PU |
| Queens Road | BN42 4RQ |
| Ridgeway | BN42 4QR |
| Ridgeway Close | BN42 4QQ |
| St Louie Close | BN42 4LL |
| Summersdeane | BN42 4QU |
| The Drive | BN42 4RR |
| The Glebe | BN42 4JD |
| Upper Kingston Lane | BN42 4RE BN42 4YN BN42 4YP |
| Upton Avenue | BN42 4WP |
| Whitelot Close | BN42 4YQ |
| Whitelot Way | BN42 4YF |
| Wilby Avenue | BN42 4RS |
| Windmill Road | BN42 4RP |
Transport near Hillside
-
Southwick Station
-
Fishersgate Station
-
Portslade Station
-
Shoreham-By-Sea Station
-
Aldrington Station
-
Hove Station
- FAQ
- Price Paid By Year
- Property Type Price
Frequently asked questions about Hillside
What is the average price for a property for sale in Hillside?
The average price for a property for sale in Hillside is £424,805. This amount is 0.29% higher than the average price in Brighton. There are 820 property listings for sale in Hillside.
What streets have the most expensive properties for sale in Hillside?
The streets with the most expensive properties for sale in Hillside are Millcroft Gardens at an average of £690,000, Eastbank at an average of £532,500 and Hillside at an average of £502,166.
What streets have the most affordable properties for sale in Hillside?
The streets with the most affordable properties for sale in Hillside are Summersdeane at an average of £280,666, Whitelot Close at an average of £295,000 and Prince Charles Close at an average of £311,625.
Which train stations are available in or near Hillside?
Some of the train stations available in or near Hillside are Southwick, Fishersgate and Portslade.
Property Price Paid in Hillside by Year
The average sold property price by year was:
| Year | Average Sold Price | Price Change |
Sold Properties
|
|---|---|---|---|
| 2025 | £439,534 | 6% |
46 Properties |
| 2024 | £414,411 | -2% |
51 Properties |
| 2023 | £420,924 | -9% |
38 Properties |
| 2022 | £460,518 | 19% |
37 Properties |
| 2021 | £371,805 | 5% |
52 Properties |
| 2020 | £353,382 | 5% |
50 Properties |
| 2019 | £334,114 | -4% |
62 Properties |
| 2018 | £348,216 | 9% |
54 Properties |
| 2017 | £317,438 | -0,2% |
47 Properties |
| 2016 | £318,198 | 2% |
48 Properties |
| 2015 | £310,471 | 19% |
52 Properties |
| 2014 | £252,860 | 5% |
52 Properties |
| 2013 | £240,444 | 1% |
38 Properties |
| 2012 | £239,171 | 9% |
40 Properties |
| 2011 | £218,158 | -3% |
46 Properties |
| 2010 | £224,281 | 9% |
46 Properties |
| 2009 | £204,949 | -7% |
45 Properties |
| 2008 | £218,366 | -11% |
50 Properties |
| 2007 | £241,866 | 14% |
67 Properties |
| 2006 | £207,549 | 3% |
80 Properties |
| 2005 | £201,065 | 2% |
61 Properties |
| 2004 | £196,223 | 9% |
66 Properties |
| 2003 | £178,088 | 17% |
57 Properties |
| 2002 | £148,263 | 13% |
75 Properties |
| 2001 | £129,482 | 10% |
70 Properties |
| 2000 | £116,945 | 21% |
56 Properties |
| 1999 | £92,218 | 15% |
55 Properties |
| 1998 | £78,450 | 6% |
55 Properties |
| 1997 | £73,761 | 18% |
52 Properties |
| 1996 | £60,218 | -7% |
63 Properties |
| 1995 | £64,175 | - |
46 Properties |
Property Price per Property Type in Hillside
Here you can find historic sold price data in order to help with your property search.
The average Property Paid Price for specific property types in the last three years are:
| Property Type | Average Sold Price | Sold Properties |
|---|---|---|
| Semi Detached House | £414,433.00 | 86 Semi Detached Houses |
| Detached House | £485,407.00 | 33 Detached Houses |
| Terraced House | £385,000.00 | 13 Terraced Houses |
| Flat | £228,000.00 | 3 Flats |

