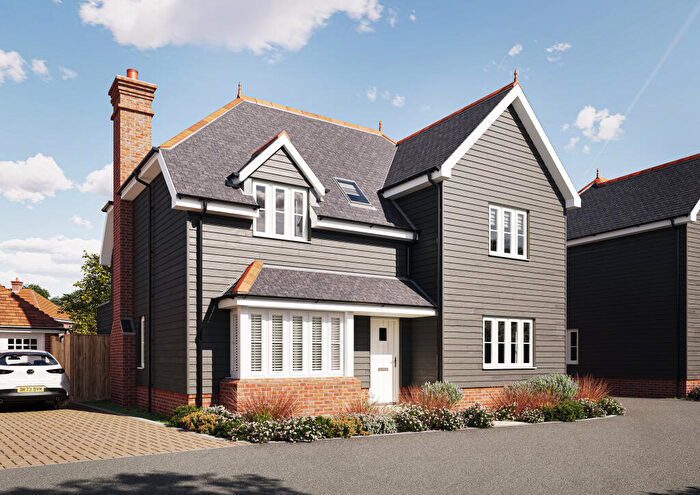
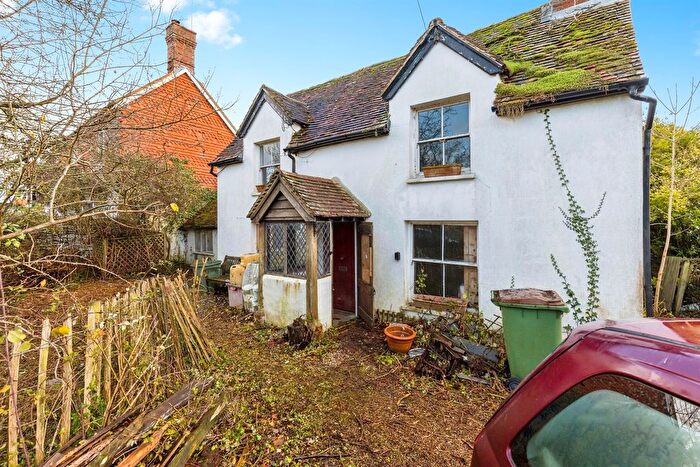
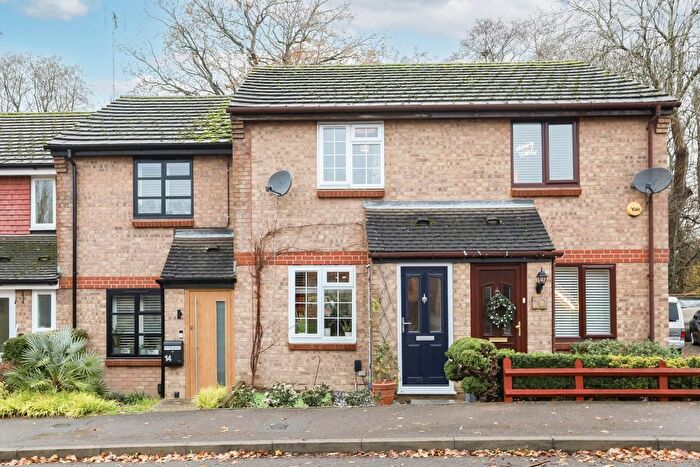
Houses for sale & to rent in Billingshurst And Shipley, Horsham
House Prices in Billingshurst And Shipley
Properties in Billingshurst And Shipley have an average house price of £761,212.00 and had 24 Property Transactions within the last 3 years¹.
Billingshurst And Shipley is an area in Horsham, West Sussex with 437 households², where the most expensive property was sold for £1,410,000.00.
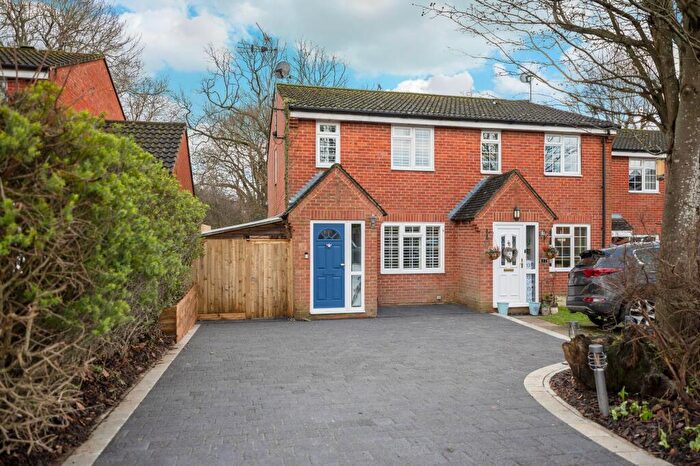
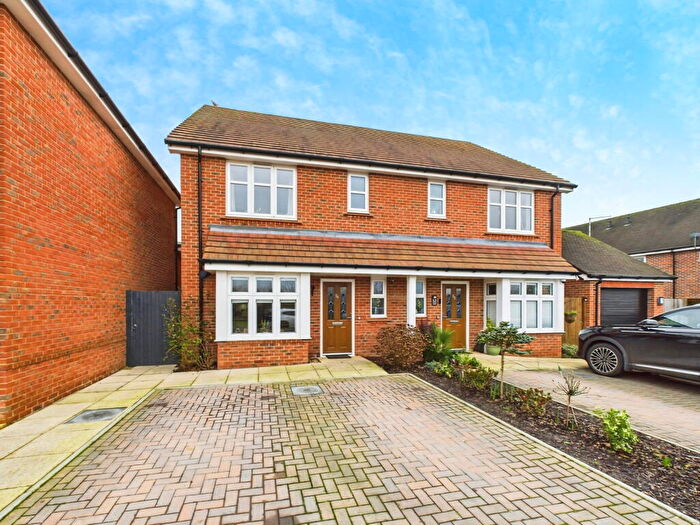
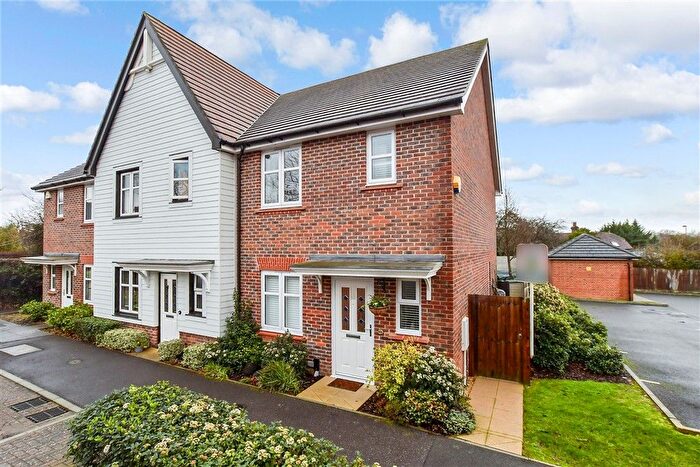
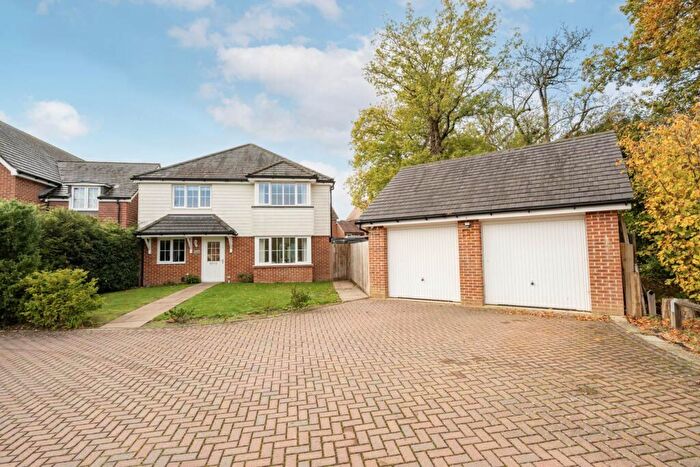
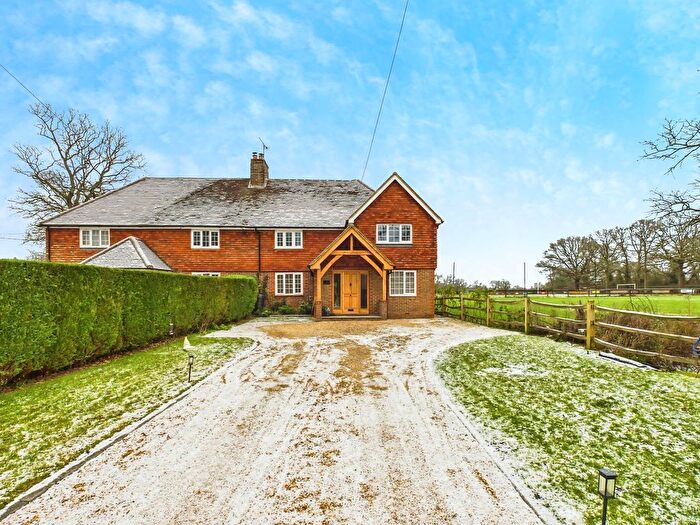
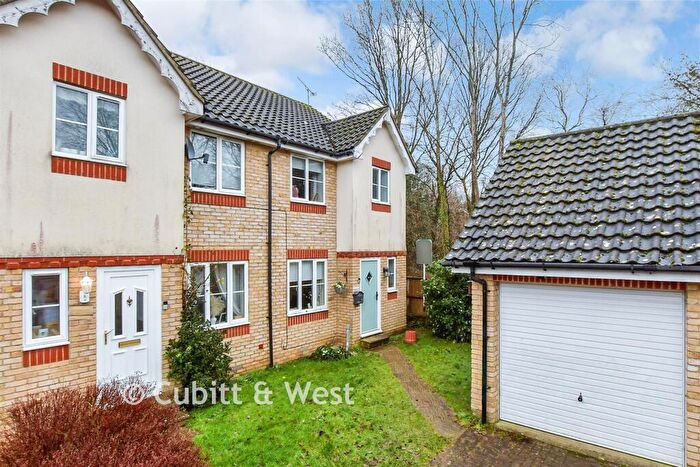
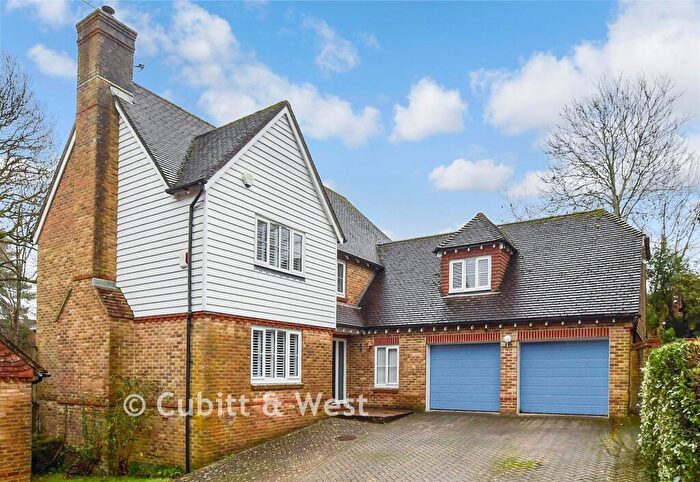
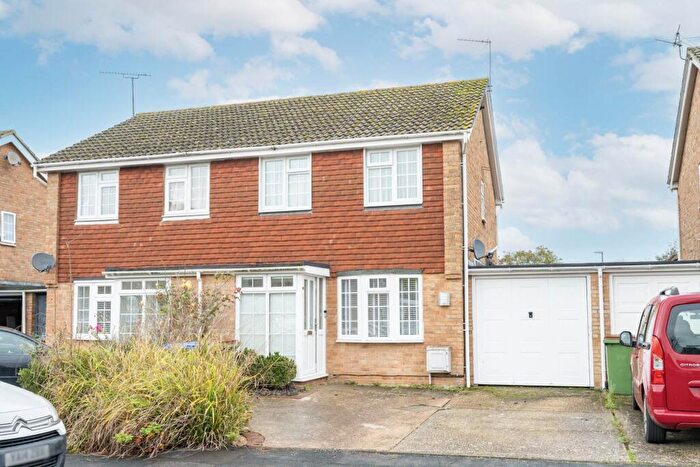
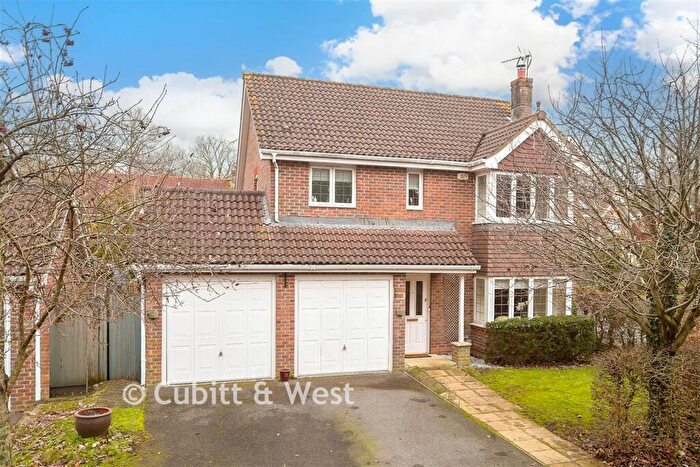
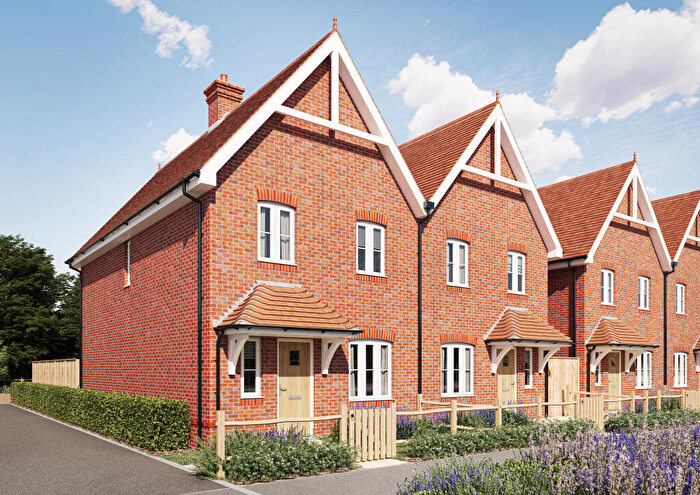
Properties for sale in Billingshurst And Shipley
Roads and Postcodes in Billingshurst And Shipley
Navigate through our locations to find the location of your next house in Billingshurst And Shipley, Horsham for sale or to rent.
| Streets | Postcodes |
|---|---|
| Bakers Lane | RH13 8GL |
| Bar Lane | RH13 9DL |
| Billingshurst Road | RH13 8QN |
| Brooks Green Road | RH13 8GN RH13 8GR |
| Church Close | RH13 8PJ |
| Church Gate | RH13 8PH |
| Coolham Road | RH13 0JW RH13 8GP RH13 8LN RH13 8PA |
| Countryman Lane | RH13 8PR RH13 8PZ |
| Cowfold Road | RH13 8QJ |
| Dragons Lane | RH13 8GD |
| Emms Lane | RH13 0TR |
| Furze View | RH13 0RH |
| Green Street | RH13 8PB RH13 8PQ |
| Hooklands Lane | RH13 8PX |
| Kings Platt | RH13 8AX |
| Kingsbrook | RH13 0AT |
| Mill Lane | RH13 8QW |
| Oakleigh Farm | RH13 8PF |
| Old House Lane | RH13 9DB |
| Pound Lane | RH13 8PG RH13 8QB |
| Saucelands Lane | RH13 8PS RH13 8PU RH13 8QG |
| School Lane | RH13 8PL |
| Shipley Road | RH13 9BQ |
| Sincox Lane | RH13 8PT |
| Smithers Hill Lane | RH13 8PE RH13 8PP |
| Swallows Lane | RH13 8QA |
| Thakeham Road | RH13 8QD |
| Trout Lane | RH13 0JN |
| Wisteria Place | RH13 8GU |
| Worthing Road | RH13 8GH |
| RH13 8QQ |
Transport near Billingshurst And Shipley
-
Billingshurst Station
-
Christ's Hospital Station
-
Horsham Station
-
Pulborough Station
-
Littlehaven Station
-
Warnham Station
-
Faygate Station
-
Amberley Station
- FAQ
- Price Paid By Year
- Property Type Price
Frequently asked questions about Billingshurst And Shipley
What is the average price for a property for sale in Billingshurst And Shipley?
The average price for a property for sale in Billingshurst And Shipley is £761,212. This amount is 63% higher than the average price in Horsham. There are 1,314 property listings for sale in Billingshurst And Shipley.
What streets have the most expensive properties for sale in Billingshurst And Shipley?
The streets with the most expensive properties for sale in Billingshurst And Shipley are Mill Lane at an average of £1,250,000, Emms Lane at an average of £1,056,700 and Furze View at an average of £825,000.
What streets have the most affordable properties for sale in Billingshurst And Shipley?
The streets with the most affordable properties for sale in Billingshurst And Shipley are Brooks Green Road at an average of £536,250, Billingshurst Road at an average of £558,500 and Dragons Lane at an average of £754,775.
Which train stations are available in or near Billingshurst And Shipley?
Some of the train stations available in or near Billingshurst And Shipley are Billingshurst, Christ's Hospital and Horsham.
Property Price Paid in Billingshurst And Shipley by Year
The average sold property price by year was:
| Year | Average Sold Price | Price Change |
Sold Properties
|
|---|---|---|---|
| 2025 | £609,833 | -52% |
6 Properties |
| 2024 | £927,045 | 32% |
11 Properties |
| 2023 | £630,371 | -38% |
7 Properties |
| 2022 | £870,000 | 3% |
11 Properties |
| 2021 | £847,500 | 2% |
12 Properties |
| 2020 | £830,000 | 8% |
5 Properties |
| 2019 | £760,312 | 12% |
8 Properties |
| 2018 | £667,454 | -4% |
12 Properties |
| 2017 | £697,200 | 18% |
5 Properties |
| 2016 | £572,000 | -4% |
15 Properties |
| 2015 | £595,500 | -29% |
9 Properties |
| 2014 | £768,223 | -3% |
13 Properties |
| 2013 | £791,204 | 22% |
12 Properties |
| 2012 | £619,800 | 13% |
5 Properties |
| 2011 | £539,583 | 19% |
12 Properties |
| 2010 | £437,666 | -17% |
6 Properties |
| 2009 | £512,375 | 28% |
8 Properties |
| 2008 | £370,000 | -58% |
7 Properties |
| 2007 | £586,083 | 20% |
18 Properties |
| 2006 | £468,820 | 21% |
25 Properties |
| 2005 | £370,772 | -21% |
11 Properties |
| 2004 | £449,790 | -4% |
11 Properties |
| 2003 | £467,028 | 15% |
14 Properties |
| 2002 | £394,995 | 29% |
24 Properties |
| 2001 | £280,710 | 6% |
14 Properties |
| 2000 | £264,200 | 15% |
15 Properties |
| 1999 | £224,936 | -26% |
19 Properties |
| 1998 | £284,417 | 39% |
16 Properties |
| 1997 | £172,405 | -63% |
19 Properties |
| 1996 | £281,642 | 51% |
14 Properties |
| 1995 | £138,000 | - |
9 Properties |
Property Price per Property Type in Billingshurst And Shipley
Here you can find historic sold price data in order to help with your property search.
The average Property Paid Price for specific property types in the last three years are:
| Property Type | Average Sold Price | Sold Properties |
|---|---|---|
| Semi Detached House | £618,750.00 | 4 Semi Detached Houses |
| Detached House | £835,055.00 | 18 Detached Houses |
| Terraced House | £381,550.00 | 2 Terraced Houses |

