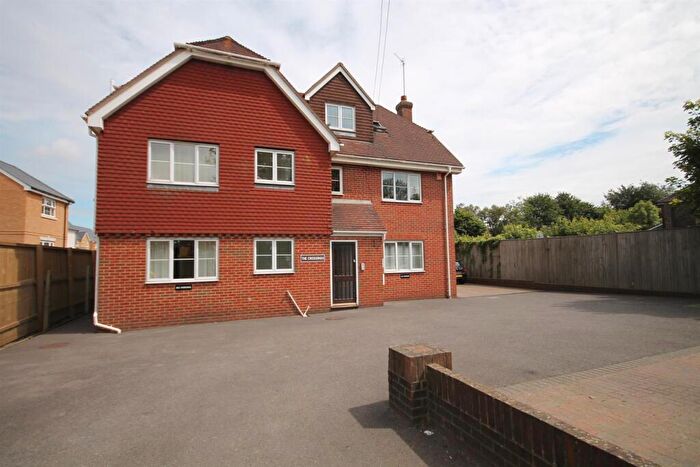
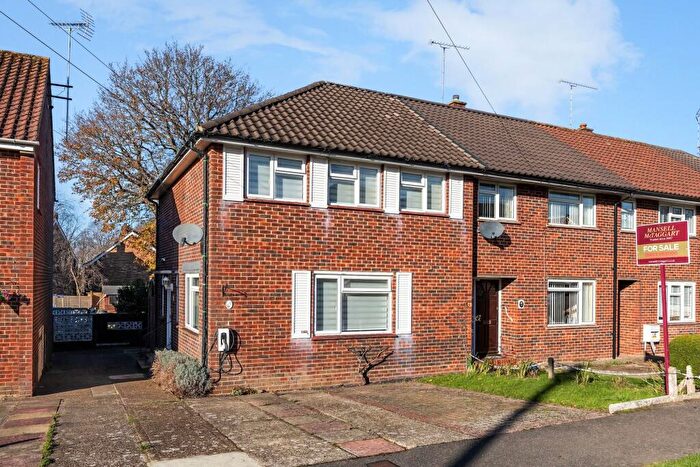
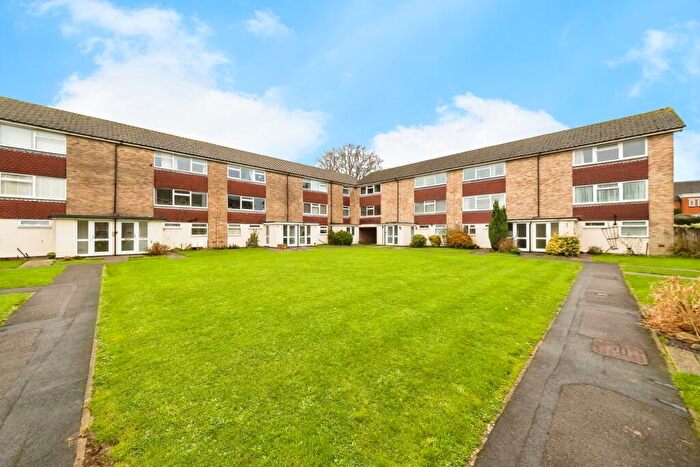
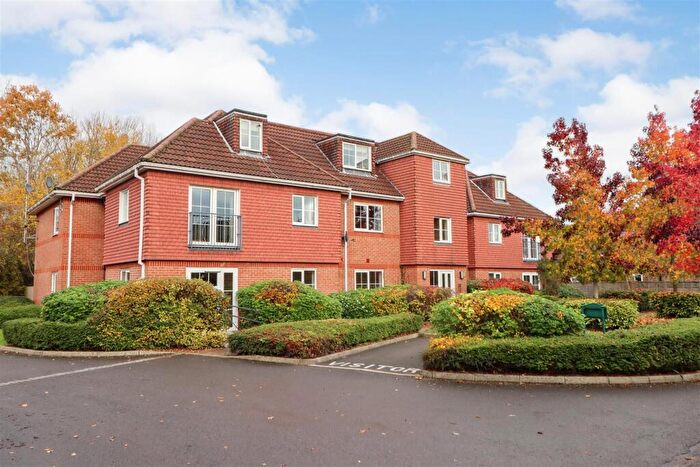
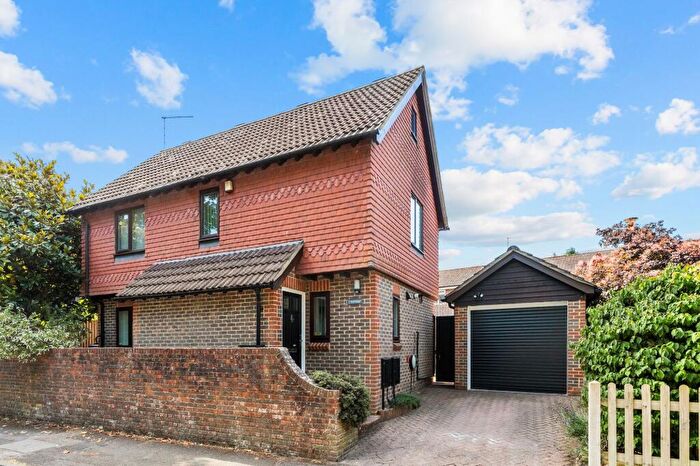
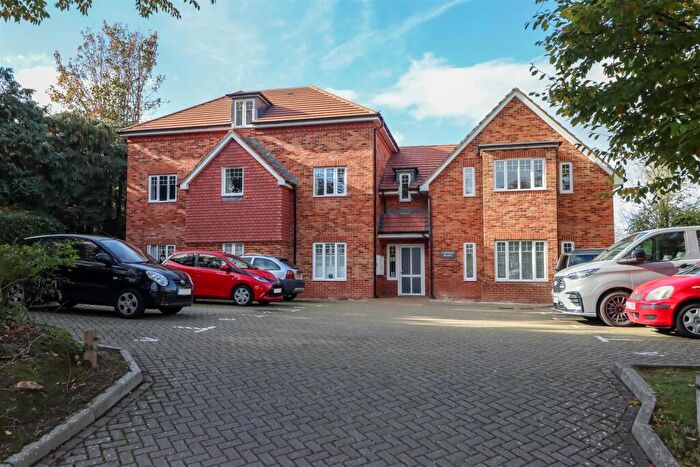
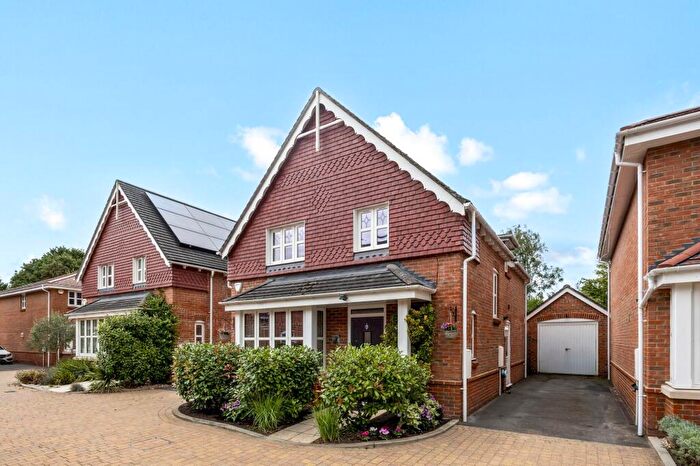
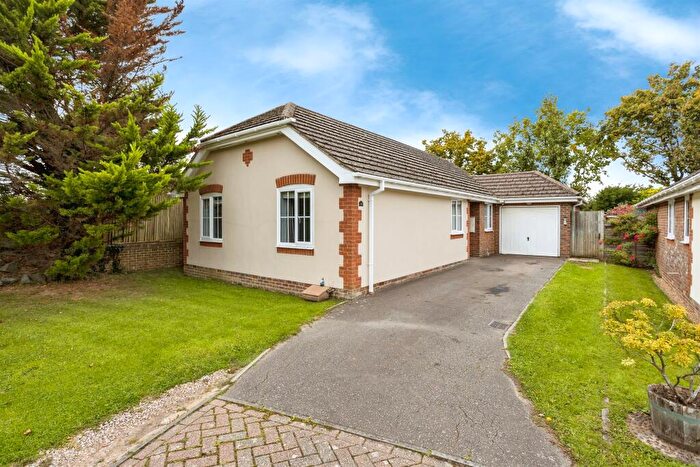
Houses for sale & to rent in Holbrook East, Horsham
House Prices in Holbrook East
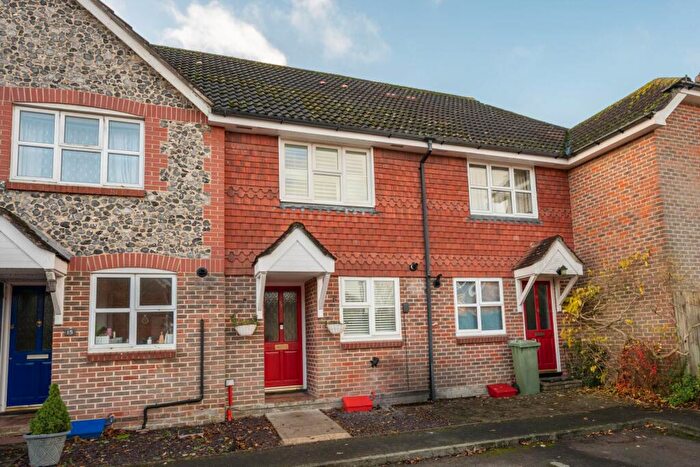
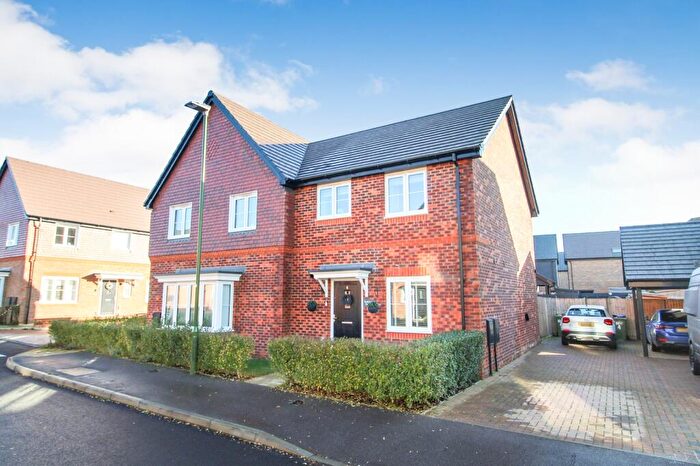
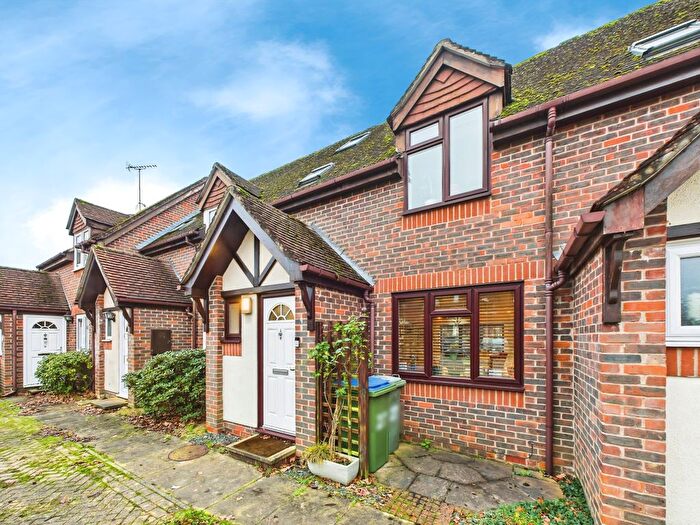
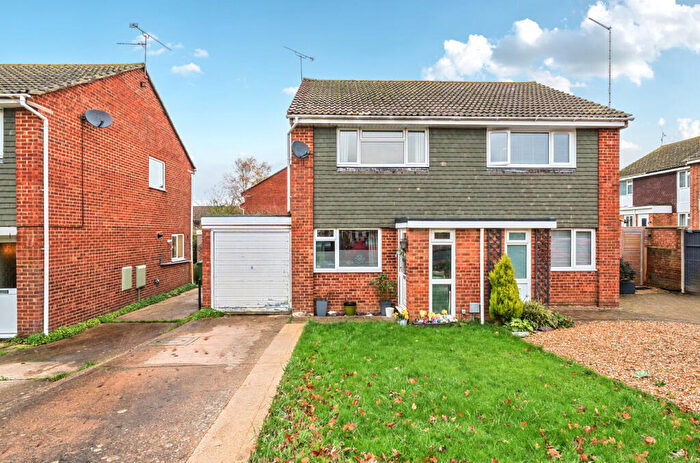
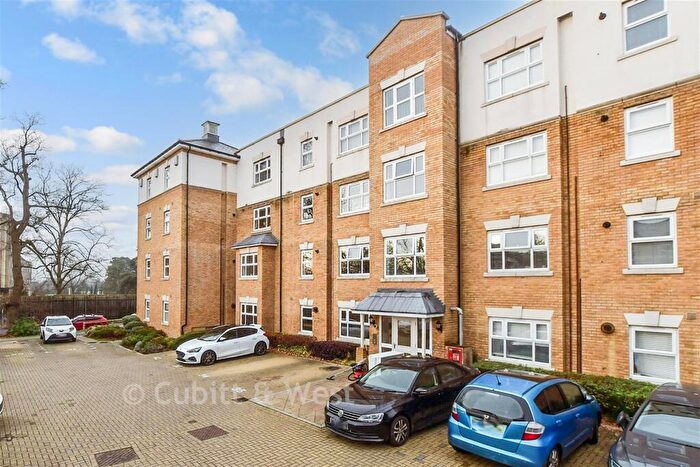
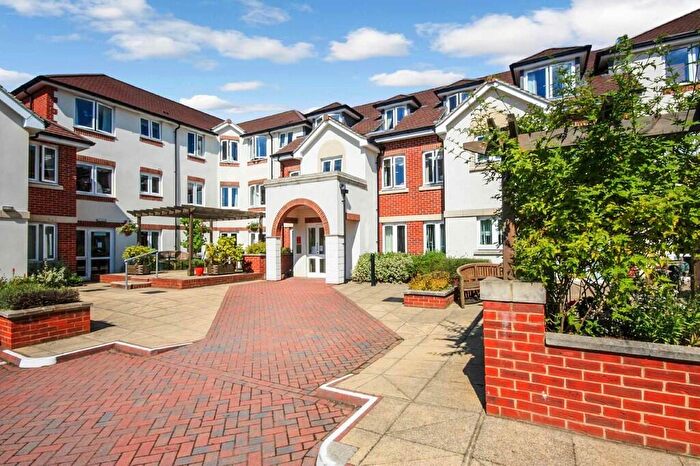
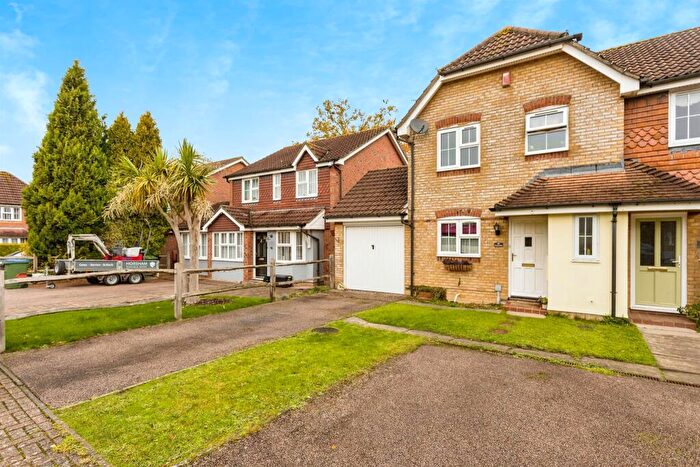
Properties in Holbrook East have an average house price of £474,047.00 and had 299 Property Transactions within the last 3 years¹.
Holbrook East is an area in Horsham, West Sussex with 2,217 households², where the most expensive property was sold for £1,150,000.00.
Properties for sale in Holbrook East
Roads and Postcodes in Holbrook East
Navigate through our locations to find the location of your next house in Holbrook East, Horsham for sale or to rent.
| Streets | Postcodes |
|---|---|
| Allcard Close | RH12 5AJ |
| Avebury Close | RH12 5JY |
| Badgers Close | RH12 5RU |
| Bailey Close | RH12 5QR |
| Bartholomew Way | RH12 5JL |
| Beaver Close | RH12 5GB |
| Bignor Close | RH12 5JQ |
| Bluebell Close | RH12 5WB |
| Braby Drive | RH12 4TJ |
| Brook Road | RH12 5FS RH12 5FY RH12 5RT |
| Burns Close | RH12 5PE RH12 5PF |
| Byron Close | RH12 5PA |
| Campion Road | RH12 5FJ |
| Chennells Brook Cottages | RH12 5QP |
| Chennells Way | RH12 5TW |
| Cissbury Close | RH12 5JT |
| Coleridge Close | RH12 5PB |
| Coltsfoot Drive | RH12 5FH RH12 5FN |
| Copse Close | RH12 5RS |
| Drake Close | RH12 5UB RH12 5UD |
| Dutchells Copse | RH12 5PD |
| Foxglove Avenue | RH12 5FZ |
| Gateford Drive | RH12 5FW |
| Giblets Lane | RH12 5QJ |
| Harvesters | RH12 5TJ |
| Hatchlands | RH12 5JX |
| Highdown Way | RH12 5JJ |
| Jackdaw Lane | RH12 5FT |
| Keats Close | RH12 5PL |
| Kestrel Close | RH12 5WD |
| Lanyon Close | RH12 5JP |
| Lanyon Mews | RH12 5JU |
| Lemmington Way | RH12 5JG |
| Longfellow Close | RH12 5PT |
| Mallow Close | RH12 5GA |
| Meadow Farm Lane | RH12 5QQ |
| North Heath Lane | RH12 5AH RH12 5PJ RH12 5PQ |
| Nymans Close | RH12 5JR |
| Oldbury Close | RH12 5JZ |
| Olive Close | RH12 4TH |
| Petworth Drive | RH12 5JH |
| Plough Lane | RH12 5TN |
| Quarry Close | RH12 5QN |
| Raven Close | RH12 5FX |
| Reapers Close | RH12 5TG |
| Red Admiral Street | RH12 5YH RH12 5YJ |
| Robert Way | RH12 5QS |
| Rook Way | RH12 5FR |
| Ropeland Way | RH12 5NY RH12 5NZ |
| Rusper Road | RH12 5QW |
| Ryders Way | RH12 5QT |
| Serrin Way | RH12 5YN RH12 5YP RH12 5YW |
| Shottermill | RH12 5HG RH12 5HJ |
| Siskin Close | RH12 5YR |
| Sloughbrook Close | RH12 5JD |
| Sorrell Road | RH12 5FL |
| Speedwell Way | RH12 5WA |
| St Marks Lane | RH12 5PU |
| Standen Place | RH12 5JS |
| Swallowtail Road | RH12 5YD RH12 5YE RH12 5YF RH12 5YG RH12 5YQ |
| Tennyson Close | RH12 5PN |
| Tern Avenue | RH12 5AT |
| Thatchers Close | RH12 5TL |
| The Castle | RH12 5PX |
| Timms Close | RH12 4TN |
| Trefoil Close | RH12 5FQ |
| Tylden Way | RH12 5JB |
| Uppark Gardens | RH12 5JN |
| Wain End | RH12 5TQ |
| Wheatsheaf Close | RH12 5TH |
| Wimblehurst Road | RH12 5AA |
| Winterbourne | RH12 5JW |
| Wordsworth Place | RH12 5PR RH12 5PS |
| Yarrow Close | RH12 5FP |
Transport near Holbrook East
- FAQ
- Price Paid By Year
- Property Type Price
Frequently asked questions about Holbrook East
What is the average price for a property for sale in Holbrook East?
The average price for a property for sale in Holbrook East is £474,047. This amount is 1% higher than the average price in Horsham. There are 1,732 property listings for sale in Holbrook East.
What streets have the most expensive properties for sale in Holbrook East?
The streets with the most expensive properties for sale in Holbrook East are Rusper Road at an average of £980,000, The Castle at an average of £915,000 and Lemmington Way at an average of £908,750.
What streets have the most affordable properties for sale in Holbrook East?
The streets with the most affordable properties for sale in Holbrook East are Red Admiral Street at an average of £235,700, Giblets Lane at an average of £265,000 and Serrin Way at an average of £265,500.
Which train stations are available in or near Holbrook East?
Some of the train stations available in or near Holbrook East are Littlehaven, Horsham and Warnham.
Property Price Paid in Holbrook East by Year
The average sold property price by year was:
| Year | Average Sold Price | Price Change |
Sold Properties
|
|---|---|---|---|
| 2025 | £488,597 | 2% |
64 Properties |
| 2024 | £477,947 | 6% |
75 Properties |
| 2023 | £447,308 | -8% |
69 Properties |
| 2022 | £480,873 | 8% |
91 Properties |
| 2021 | £444,029 | -2% |
127 Properties |
| 2020 | £452,252 | 17% |
91 Properties |
| 2019 | £375,485 | -4% |
98 Properties |
| 2018 | £390,639 | -10% |
81 Properties |
| 2017 | £429,389 | 7% |
104 Properties |
| 2016 | £398,038 | 12% |
105 Properties |
| 2015 | £349,632 | 3% |
98 Properties |
| 2014 | £337,748 | -4% |
90 Properties |
| 2013 | £350,824 | 17% |
81 Properties |
| 2012 | £290,516 | 6% |
86 Properties |
| 2011 | £272,101 | -14% |
85 Properties |
| 2010 | £310,415 | 18% |
76 Properties |
| 2009 | £253,536 | -6% |
81 Properties |
| 2008 | £268,630 | -6% |
63 Properties |
| 2007 | £284,095 | 6% |
111 Properties |
| 2006 | £266,218 | 9% |
143 Properties |
| 2005 | £242,263 | -0,1% |
121 Properties |
| 2004 | £242,423 | 10% |
148 Properties |
| 2003 | £218,623 | 11% |
149 Properties |
| 2002 | £194,393 | 20% |
189 Properties |
| 2001 | £154,661 | 3% |
189 Properties |
| 2000 | £149,691 | 10% |
165 Properties |
| 1999 | £135,451 | 14% |
175 Properties |
| 1998 | £115,958 | 1% |
187 Properties |
| 1997 | £114,450 | 8% |
307 Properties |
| 1996 | £104,959 | 1% |
227 Properties |
| 1995 | £104,227 | - |
147 Properties |
Property Price per Property Type in Holbrook East
Here you can find historic sold price data in order to help with your property search.
The average Property Paid Price for specific property types in the last three years are:
| Property Type | Average Sold Price | Sold Properties |
|---|---|---|
| Semi Detached House | £439,242.00 | 67 Semi Detached Houses |
| Detached House | £664,006.00 | 103 Detached Houses |
| Terraced House | £364,956.00 | 111 Terraced Houses |
| Flat | £189,333.00 | 18 Flats |

