
Houses for sale & to rent in Trafalgar, Horsham
House Prices in Trafalgar
Properties in Trafalgar have an average house price of £517,447.00 and had 345 Property Transactions within the last 3 years¹.
Trafalgar is an area in Horsham, West Sussex with 2,695 households², where the most expensive property was sold for £1,850,000.00.
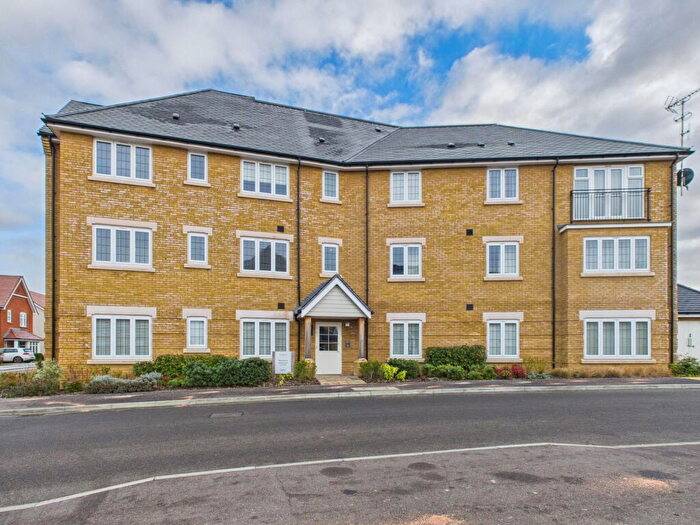
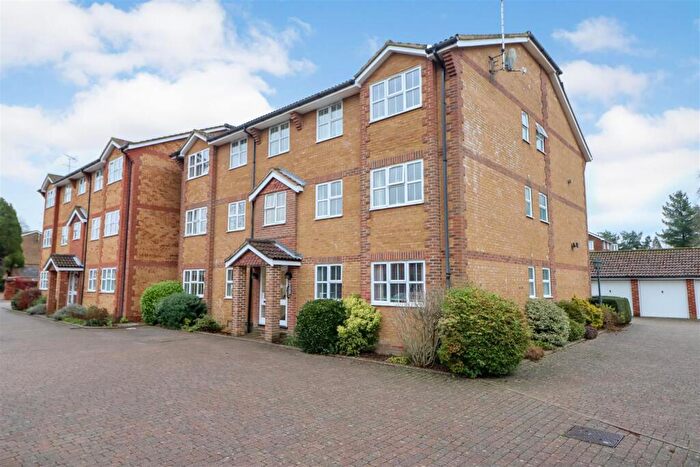
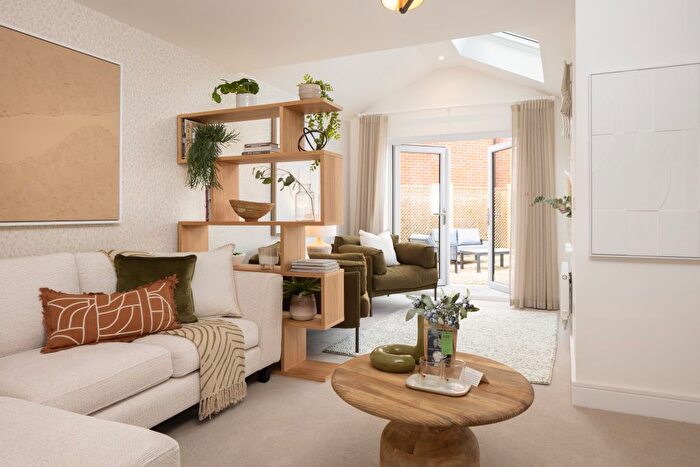
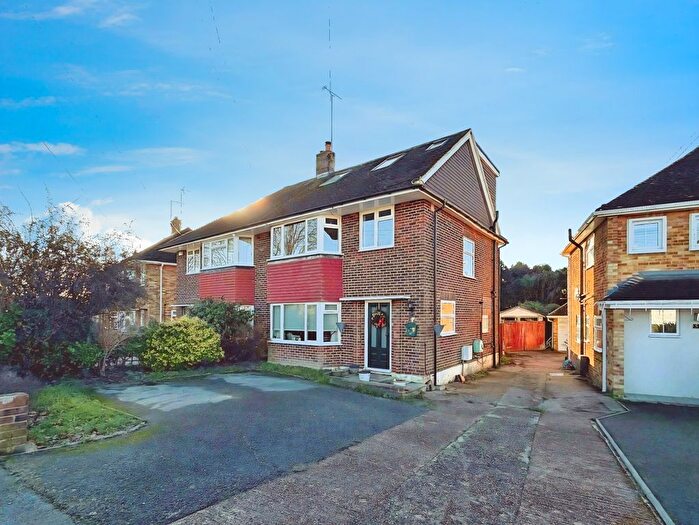
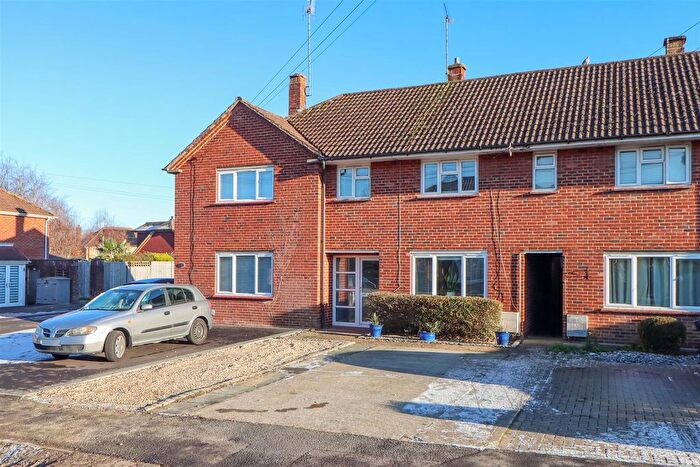
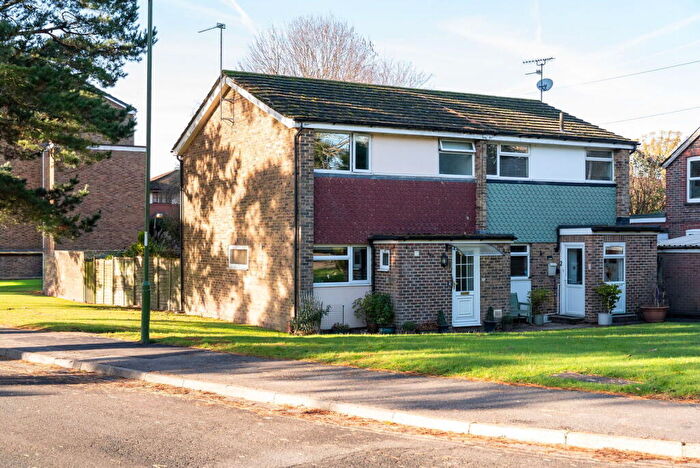
Properties for sale in Trafalgar
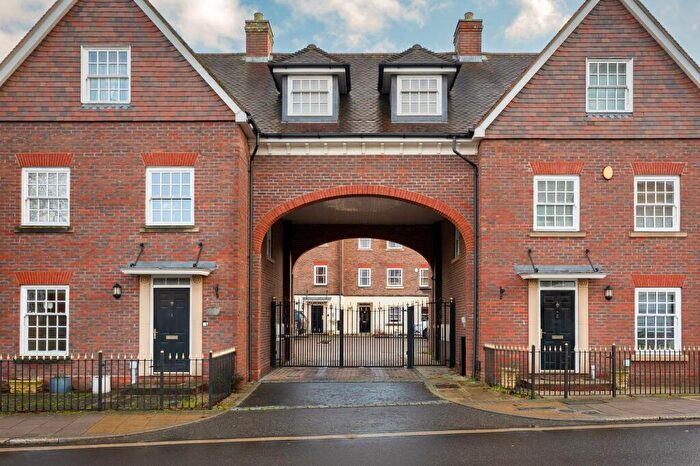

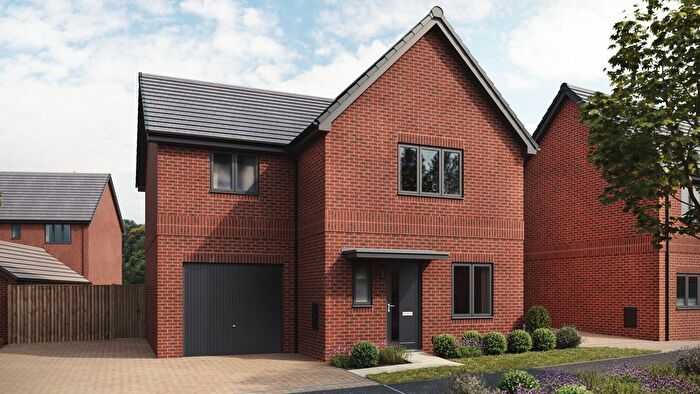
![]()
If you are looking to sell your house, let it out, or receive a property valuation, an expert can help you.
Click the button below to get started.


Roads and Postcodes in Trafalgar
Navigate through our locations to find the location of your next house in Trafalgar, Horsham for sale or to rent.
| Streets | Postcodes |
|---|---|
| Albery Close | RH12 2HY |
| Barnes Mews | RH12 1AP |
| Bishopric | RH12 1QN |
| Blunts Way | RH12 2BJ RH12 2BL RH12 2BX |
| Caterways | RH12 2AN |
| Cedar Close | RH12 2BN |
| Churchill Avenue | RH12 2JP RH12 2JR |
| Collingwood Close | RH12 2QP |
| Collingwood Road | RH12 2QN RH12 2QW |
| Cootes Avenue | RH12 2AD RH12 2AF RH12 2AG RH12 2AH |
| Copperfield Place | RH12 2HR |
| Croft Way | RH12 2AS |
| Curzon Avenue | RH12 2LA RH12 2LB |
| Eyles Close | RH12 2HT |
| Fairview | RH12 2PY |
| Farm Avenue | RH12 2JY |
| Farthings Hill | RH12 1TS |
| Fishers Court | RH12 2RJ |
| Greenway | RH12 2JS RH12 2JT |
| Guildford Road | RH12 1LS RH12 1LX RH12 1LY |
| Hamilton Road | RH12 2JJ RH12 2JL |
| Hardy Close | RH12 2QF RH12 2QG RH12 2QH RH12 2QQ |
| Hill Mead | RH12 2PT RH12 2PU RH12 2PX |
| Irwin Drive | RH12 1NH RH12 1NJ RH12 1NL |
| Kempshott Mews | RH12 2GG |
| Kempshott Road | RH12 2EX RH12 2EY |
| Kings Gate | RH12 1AE |
| Larch End | RH12 2AZ |
| Marlborough Place | RH12 2NR |
| Merryfield Drive | RH12 2AA RH12 2AB RH12 2AR RH12 2AT RH12 2AU RH12 2AX RH12 2BA RH12 2BB |
| Milnwood Road | RH12 2BU |
| Milton Road | RH12 2JD |
| Nelson Road | RH12 2JE |
| Newlands Road | RH12 2BY |
| North Parade | RH12 2BF RH12 2BH RH12 2BS RH12 2DA RH12 2DE RH12 2DG RH12 2QR RH12 2RE RH12 2RL RH12 2BP RH12 2BT RH12 2DP |
| Orchard Gardens | RH12 2QX |
| Park Rise | RH12 2AY |
| Percy Road | RH12 2JN |
| Potters Place | RH12 2PL |
| Purton Road | RH12 2HA RH12 2HB |
| Red River Court | RH12 2HS |
| Redford Avenue | RH12 2FX RH12 2HH RH12 2HJ RH12 2HL RH12 2HN RH12 2HP RH12 2HW RH12 2RD RH12 2RB |
| Rookwood Park | RH12 1UB |
| Rushams Road | RH12 2LD RH12 2LQ RH12 2NT RH12 2NU RH12 2NX RH12 2NY RH12 2NZ RH12 2QA |
| Ryecroft Drive | RH12 2AP RH12 2AW |
| Saxon Crescent | RH12 2HU RH12 2HX RH12 2HZ |
| Shelley Road | RH12 2JH |
| Spencers Place | RH12 2EZ |
| Spencers Road | RH12 2JG RH12 2JQ |
| Spring Gardens | RH12 2QE |
| Springfield Crescent | RH12 2PP |
| Springfield Park | RH12 2BQ |
| Springfield Park Gate | RH12 2FY |
| Springfield Park Road | RH12 2PW |
| Springfield Road | RH12 2PG |
| Stubfield | RH12 2AJ |
| Swindon Road | RH12 2HD RH12 2HE RH12 2HF RH12 2HQ |
| The Parade | RH12 2AL |
| The Plat | RH12 2AE |
| The Ridgeway | RH12 2HG |
| The Walnuts | RH12 2DQ |
| Trafalgar Road | RH12 2QB RH12 2QD RH12 2QJ RH12 2QL |
| Vale Drive | RH12 2JU RH12 2JX |
| Victory Road | RH12 2JF |
| Warnham Road | RH12 2QS RH12 2QT |
| West Parade | RH12 2BZ |
| Wildgoose Drive | RH12 1TU |
Transport near Trafalgar

- FAQ
- Price Paid By Year
- Property Type Price
Frequently asked questions about Trafalgar
What is the average price for a property for sale in Trafalgar?
The average price for a property for sale in Trafalgar is £517,447. This amount is 10% higher than the average price in Horsham. There are 1,859 property listings for sale in Trafalgar.
What streets have the most expensive properties for sale in Trafalgar?
The streets with the most expensive properties for sale in Trafalgar are Rookwood Park at an average of £1,477,000, Wildgoose Drive at an average of £1,422,500 and Warnham Road at an average of £1,093,200.
What streets have the most affordable properties for sale in Trafalgar?
The streets with the most affordable properties for sale in Trafalgar are Fishers Court at an average of £235,357, Red River Court at an average of £242,500 and Kempshott Mews at an average of £277,500.
Which train stations are available in or near Trafalgar?
Some of the train stations available in or near Trafalgar are Horsham, Littlehaven and Warnham.
Property Price Paid in Trafalgar by Year
The average sold property price by year was:
| Year | Average Sold Price | Price Change |
Sold Properties
|
|---|---|---|---|
| 2025 | £480,179 | -12% |
67 Properties |
| 2024 | £536,267 | 6% |
103 Properties |
| 2023 | £505,894 | -6% |
92 Properties |
| 2022 | £536,982 | 12% |
83 Properties |
| 2021 | £471,077 | 5% |
127 Properties |
| 2020 | £447,237 | 12% |
95 Properties |
| 2019 | £394,574 | 0,5% |
95 Properties |
| 2018 | £392,606 | -12% |
110 Properties |
| 2017 | £441,159 | 9% |
122 Properties |
| 2016 | £402,948 | 3% |
111 Properties |
| 2015 | £391,077 | 12% |
131 Properties |
| 2014 | £344,752 | 14% |
148 Properties |
| 2013 | £297,337 | -4% |
104 Properties |
| 2012 | £309,713 | 1% |
97 Properties |
| 2011 | £307,489 | -3% |
96 Properties |
| 2010 | £317,385 | 20% |
126 Properties |
| 2009 | £253,218 | -17% |
77 Properties |
| 2008 | £295,577 | -1% |
90 Properties |
| 2007 | £299,853 | 10% |
149 Properties |
| 2006 | £269,903 | 10% |
180 Properties |
| 2005 | £242,845 | 1% |
139 Properties |
| 2004 | £241,089 | 2% |
173 Properties |
| 2003 | £236,684 | 15% |
152 Properties |
| 2002 | £200,890 | 8% |
183 Properties |
| 2001 | £185,620 | 18% |
178 Properties |
| 2000 | £152,352 | 2% |
154 Properties |
| 1999 | £149,328 | 26% |
156 Properties |
| 1998 | £110,108 | 8% |
131 Properties |
| 1997 | £101,707 | -17% |
147 Properties |
| 1996 | £119,313 | -1% |
157 Properties |
| 1995 | £121,083 | - |
126 Properties |
Property Price per Property Type in Trafalgar
Here you can find historic sold price data in order to help with your property search.
The average Property Paid Price for specific property types in the last three years are:
| Property Type | Average Sold Price | Sold Properties |
|---|---|---|
| Semi Detached House | £483,233.00 | 150 Semi Detached Houses |
| Detached House | £821,009.00 | 81 Detached Houses |
| Terraced House | £432,638.00 | 52 Terraced Houses |
| Flat | £274,766.00 | 62 Flats |