
Houses for sale & to rent in RH12 4ZR, Darwin Close, Roffey North, Horsham
House Prices in RH12 4ZR, Darwin Close, Roffey North
Properties in RH12 4ZR have an average house price of £204,250.00 and had 2 Property Transactions within the last 3 years.¹ RH12 4ZR is a postcode in Darwin Close located in Roffey North, an area in Horsham, West Sussex, with 14 households², where the most expensive property was sold for £218,500.00.
Properties for sale near RH12 4ZR, Darwin Close
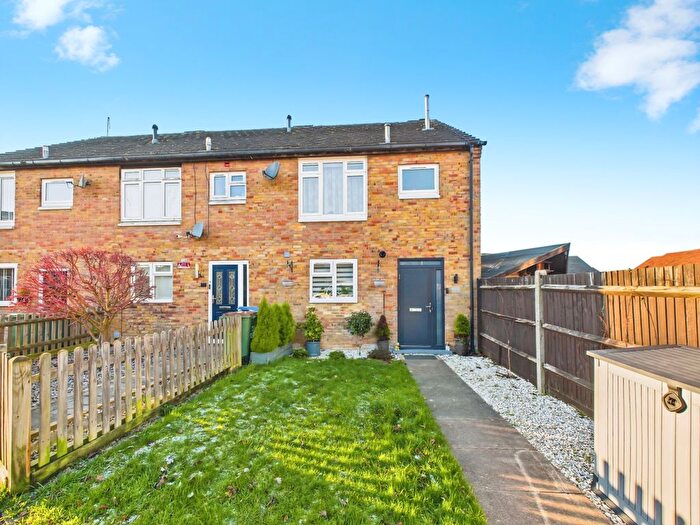
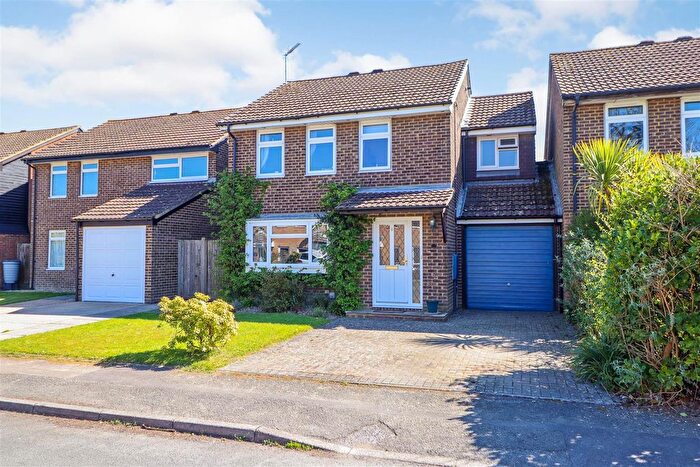

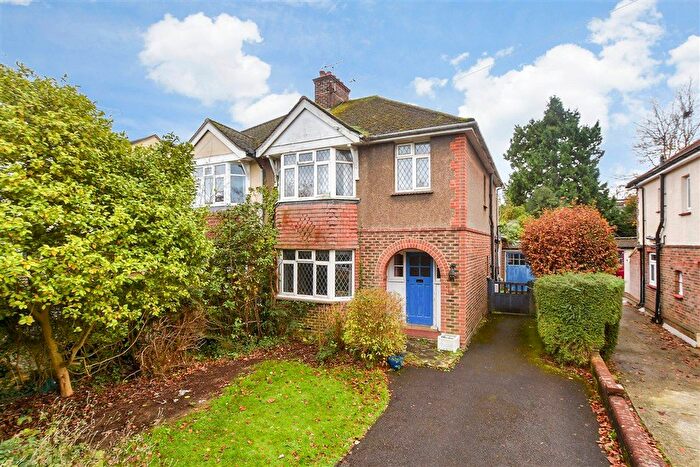
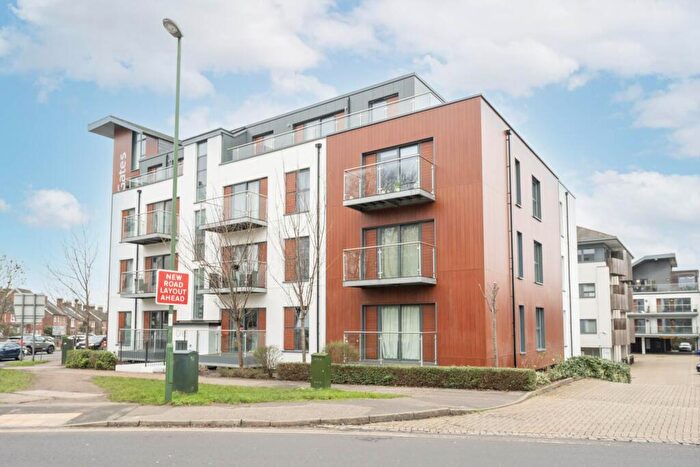

![]()
If you are looking to sell your house, let it out, or receive a property valuation, an expert can help you.
Click the button below to get started.


Price Paid in Darwin Close, RH12 4ZR, Roffey North
3 Darwin Close, RH12 4ZR, Roffey North Horsham
Property 3 has been sold 2 times. The last time it was sold was in 12/05/2025 and the sold price was £218,500.00.
This is a Flat which was sold as a leasehold in 12/05/2025
| Date | Price | Property Type | Tenure | Classification |
|---|---|---|---|---|
| 12/05/2025 | £218,500.00 | Flat | leasehold | Established Building |
| 18/08/2008 | £98,000.00 | Flat | leasehold | New Build |
8 Darwin Close, RH12 4ZR, Roffey North Horsham
Property 8 has been sold 5 times. The last time it was sold was in 10/07/2024 and the sold price was £190,000.00.
This flat, sold as a leasehold on 10/07/2024, is a 56 sqm top-floor flat with an EPC rating of C.
| Date | Price | Property Type | Tenure | Classification |
|---|---|---|---|---|
| 10/07/2024 | £190,000.00 | Flat | leasehold | Established Building |
| 24/03/2020 | £185,000.00 | Flat | leasehold | Established Building |
| 31/10/2017 | £180,000.00 | Flat | leasehold | Established Building |
| 12/09/2014 | £140,000.00 | Flat | leasehold | Established Building |
| 22/05/2006 | £80,000.00 | Flat | leasehold | New Build |
4 Darwin Close, RH12 4ZR, Roffey North Horsham
Property 4 has been sold 2 times. The last time it was sold was in 11/03/2016 and the sold price was £200,000.00.
This flat, sold as a leasehold on 11/03/2016, is a 53 sqm top-floor flat with an EPC rating of D.
| Date | Price | Property Type | Tenure | Classification |
|---|---|---|---|---|
| 11/03/2016 | £200,000.00 | Flat | leasehold | Established Building |
| 07/09/2007 | £139,000.00 | Flat | leasehold | Established Building |
Transport near RH12 4ZR, Darwin Close

House price paid reports for RH12 4ZR, Darwin Close
Click on the buttons below to see price paid reports by year or property price:
- Price Paid By Year
- Property Type Price
Property Price Paid in RH12 4ZR, Darwin Close by Year
The average sold property price by year was:
| Year | Average Sold Price | Price Change |
Sold Properties
|
|---|---|---|---|
| 2025 | £218,500 | 13% |
1 Property |
| 2024 | £190,000 | 3% |
1 Property |
| 2020 | £185,000 | 3% |
1 Property |
| 2017 | £180,000 | -11% |
1 Property |
| 2016 | £200,000 | 30% |
1 Property |
| 2014 | £140,000 | 30% |
1 Property |
| 2008 | £98,000 | -42% |
1 Property |
| 2007 | £139,000 | 42% |
1 Property |
| 2006 | £80,000 | - |
1 Property |
Property Price per Property Type in RH12 4ZR, Darwin Close
Here you can find historic sold price data in order to help with your property search.
The average Property Paid Price for specific property types in the last three years are:
| Property Type | Average Sold Price | Sold Properties |
|---|---|---|
| Flat | £204,250.00 | 2 Flats |