
Houses for sale in Andover, Wiltshire
House Prices in Andover
Properties in Andover have an average house price of £300k and had 255 Property Transactions within the last 3 years.¹
Andover is an area in Wiltshire with 2,760 households², where the most expensive property was sold for £3M.
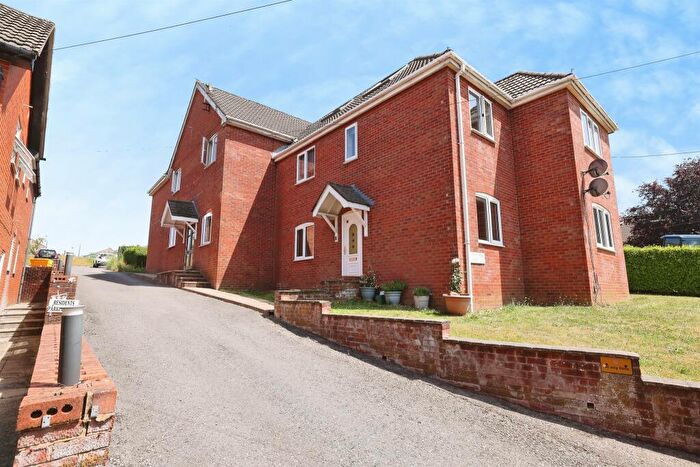
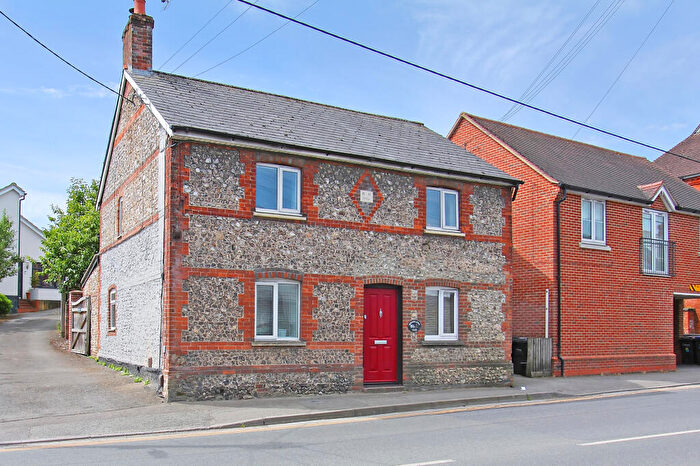
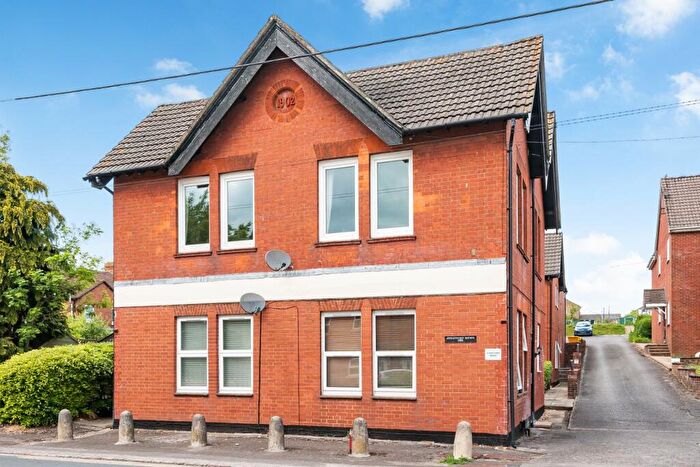
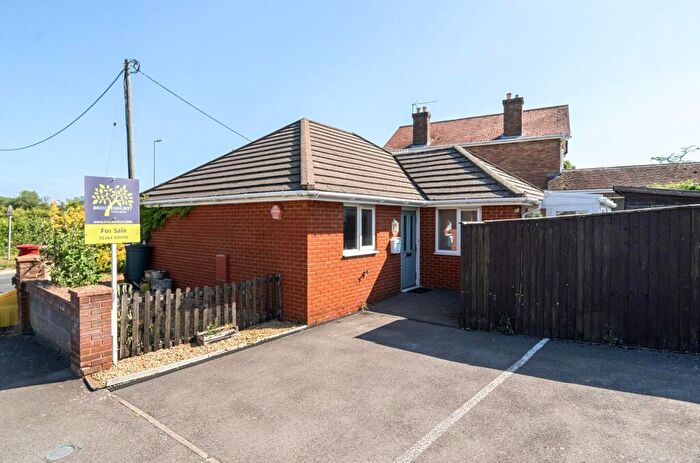
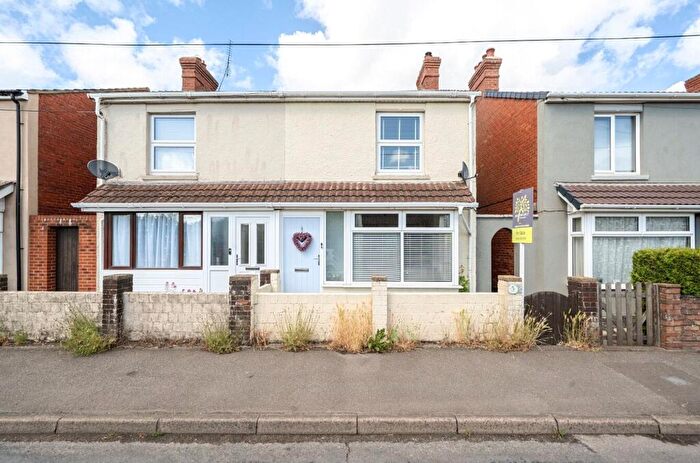
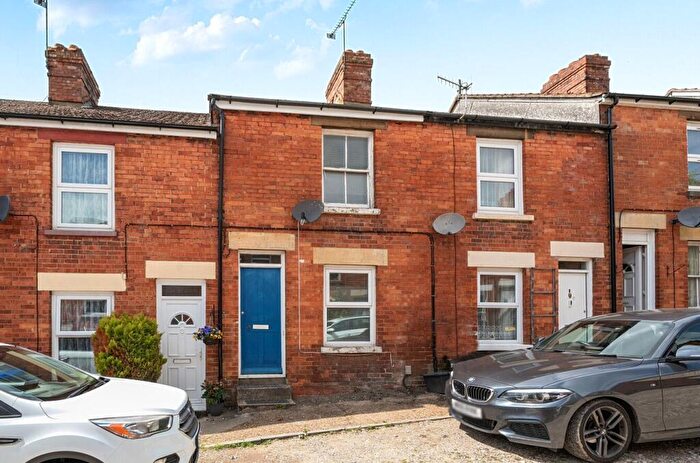
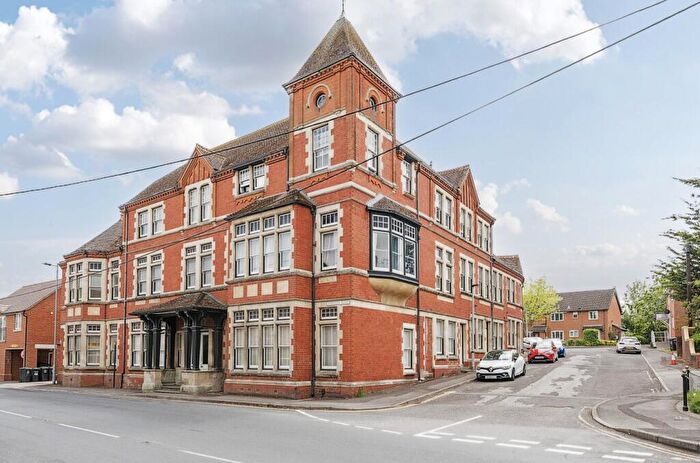
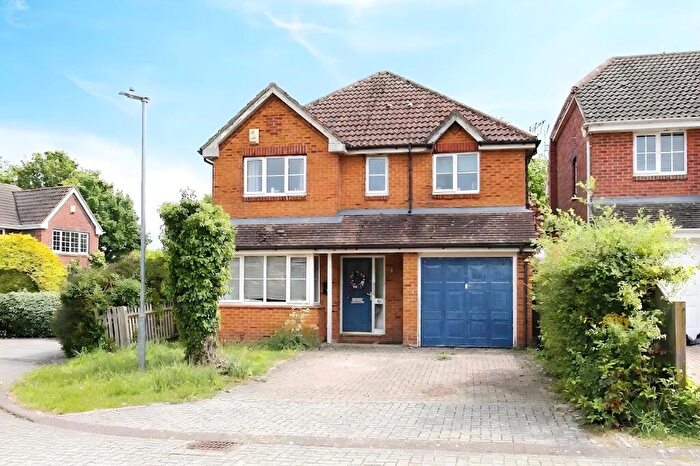
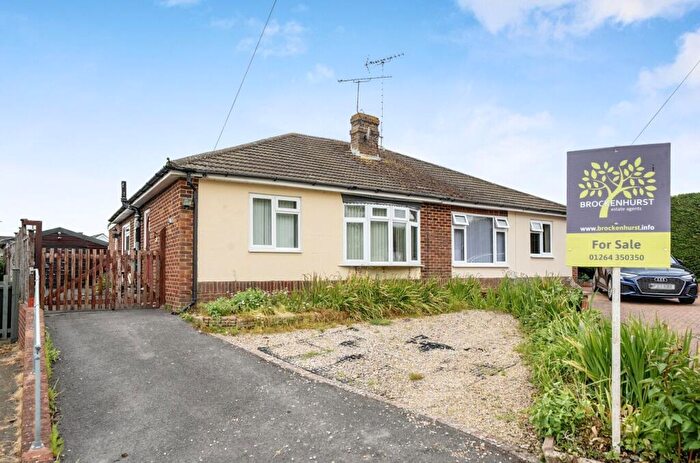
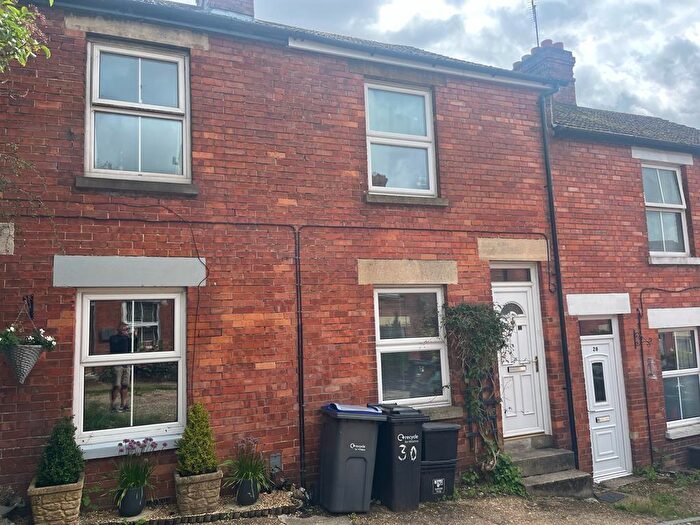
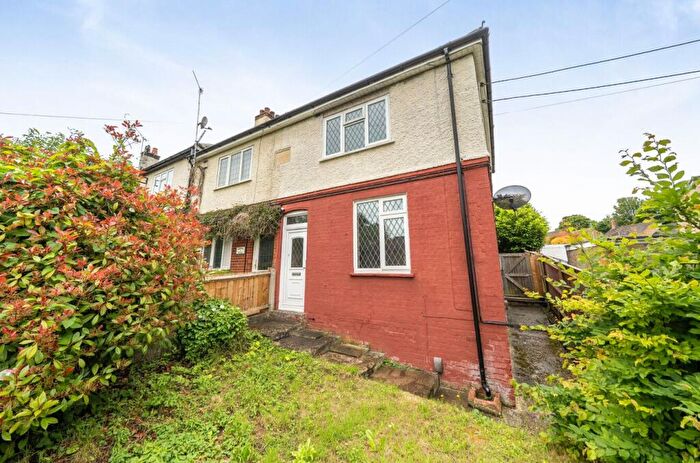
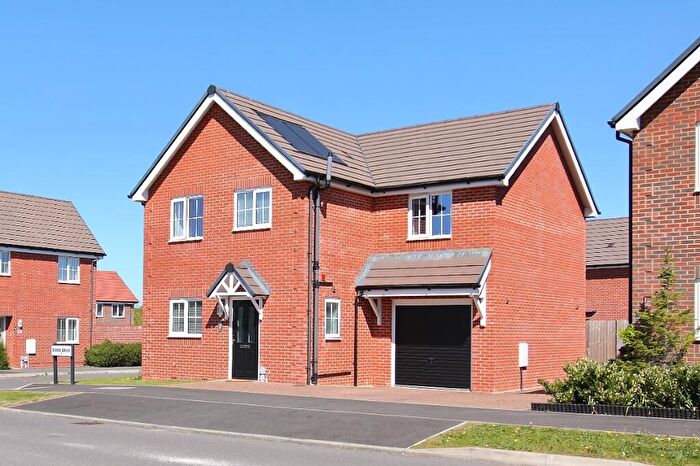
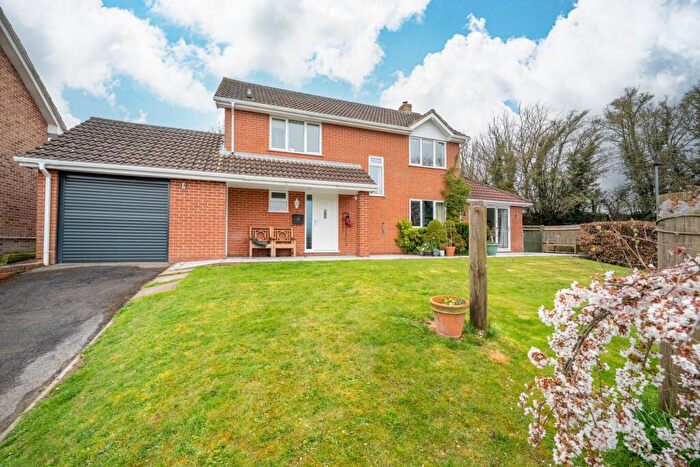
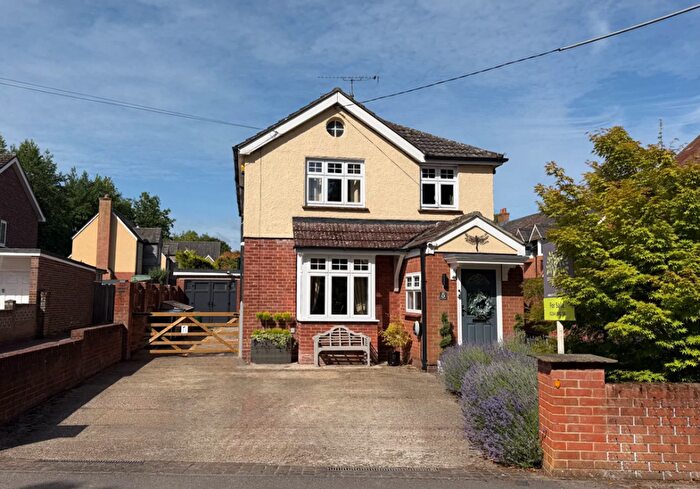
Properties for sale in Andover
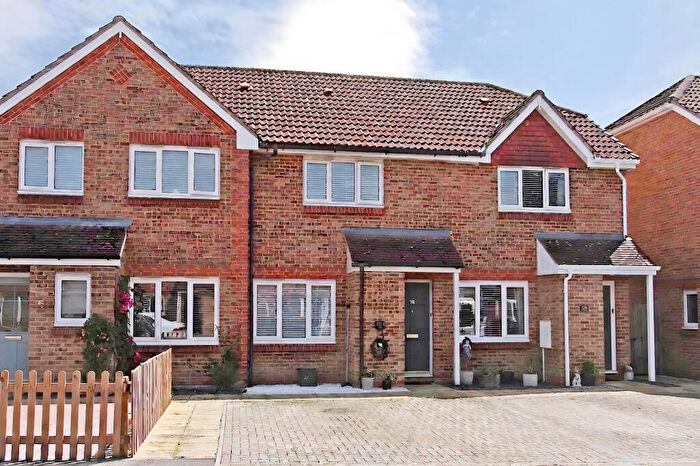
![]()
If you are looking to sell your house, let it out, or receive a property valuation, an expert can help you.
Click the button below to get started.
Neighbourhoods in Andover
Navigate through our locations to find the location of your next house in Andover, Wiltshire for sale or to rent.
Property price trends in Andover
According to the latest Land Registry data, the average home in Andover sold for £896,300 in 2026. That figure comes from 3,196 sales logged over the past 31 years.
Prices have continued to climb over the last three years. Compared with 2023, when the typical sale came in around £257,954, that's a rise of roughly 247.5%.
Looking back five years, average prices are up about 140.8% since 2021, a gain of around £524,038 in cash terms.
Zoom out to the past decade for the fuller picture. Back in 2016, homes here averaged £249,993, so the typical sold price has climbed about 258.5% since then, roughly 13.6% a year. Stretch the view to fifteen years and that annual pace eases back to about 9.1%.
Frequently asked questions about Andover
What is the average price for a property for sale in Andover?
The average price for a property for sale in Andover is £299,555. This amount is 18% lower than the average price in Wiltshire. There are 1,409 property listings for sale in Andover.
What locations have the most expensive properties for sale in Andover?
The location with the most expensive properties for sale in Andover is The Collingbournes And Netheravon at an average of £869,230.
What locations have the most affordable properties for sale in Andover?
The location with the most affordable properties for sale in Andover is Ludgershall And Perham Down at an average of £268,953.
Which train stations are available in or near Andover?
Some of the train stations available in or near Andover are Andover, Grateley and Bedwyn.
Property Price Paid in Andover by Year
The average sold property price by year was:
| Year | Average Sold Price | Price Change |
Sold Properties
|
|---|---|---|---|
| 2026 | £896,300 | 65% |
5 Properties |
| 2025 | £316,445 | 11% |
93 Properties |
| 2024 | £282,360 | 9% |
81 Properties |
| 2023 | £257,954 | -19% |
76 Properties |
| 2022 | £308,241 | -21% |
96 Properties |
| 2021 | £372,262 | 29% |
106 Properties |
| 2020 | £265,581 | -3% |
74 Properties |
| 2019 | £274,272 | 10% |
112 Properties |
| 2018 | £246,632 | -2% |
105 Properties |
| 2017 | £252,095 | 1% |
117 Properties |
Property Price per Property Type in Andover
Here you can find historic sold price data in order to help with your property search.
The average Property Paid Price for specific property types in the last three years are:
| Property Type | Average Sold Price | Sold Properties |
|---|---|---|
| Flat | £151,237.00 | 47 Flats |
| Semi Detached House | £283,823.00 | 72 Semi Detached Houses |
| Detached House | £533,891.00 | 56 Detached Houses |
| Terraced House | £236,815.00 | 80 Terraced Houses |
Transport in Andover
Please see below transportation links in this area:
