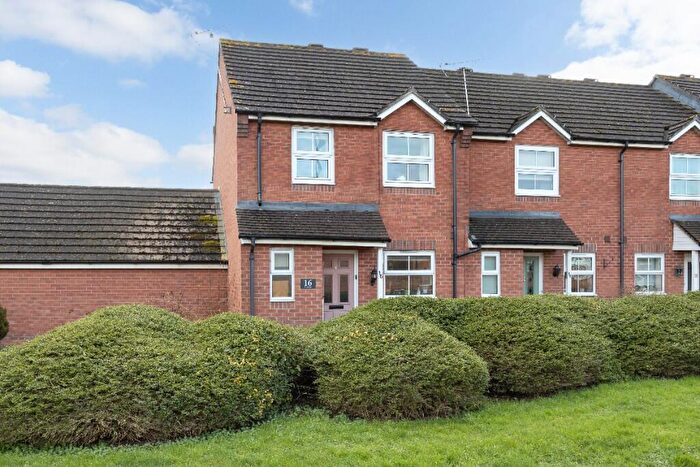
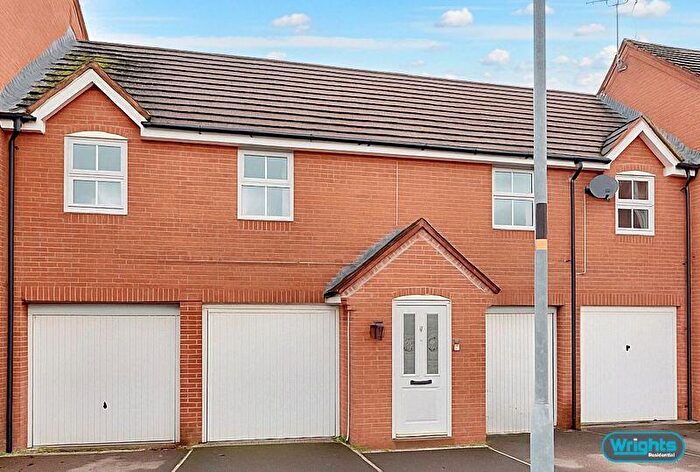
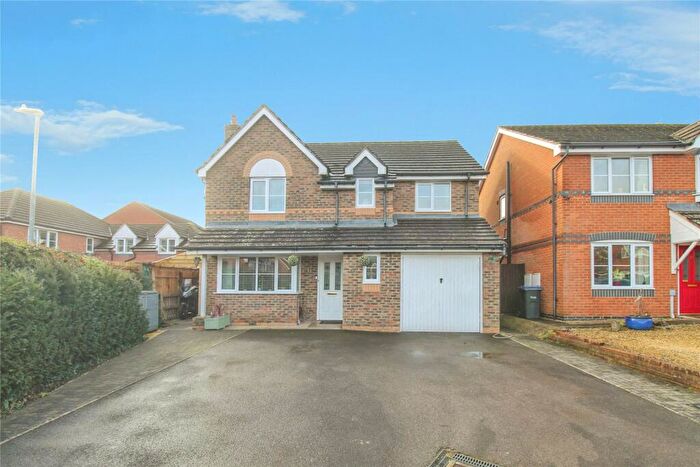
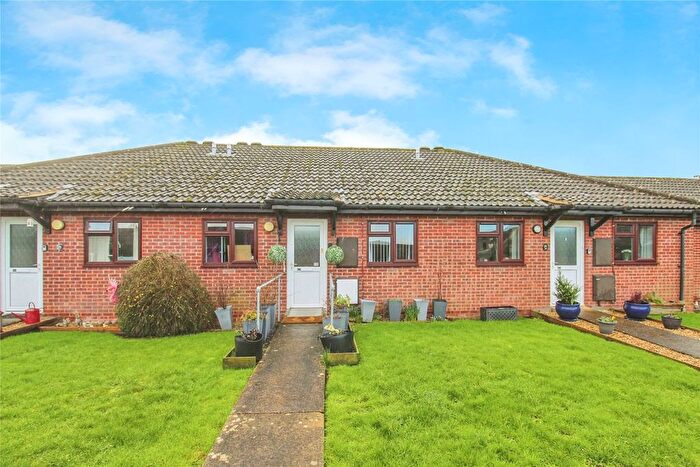
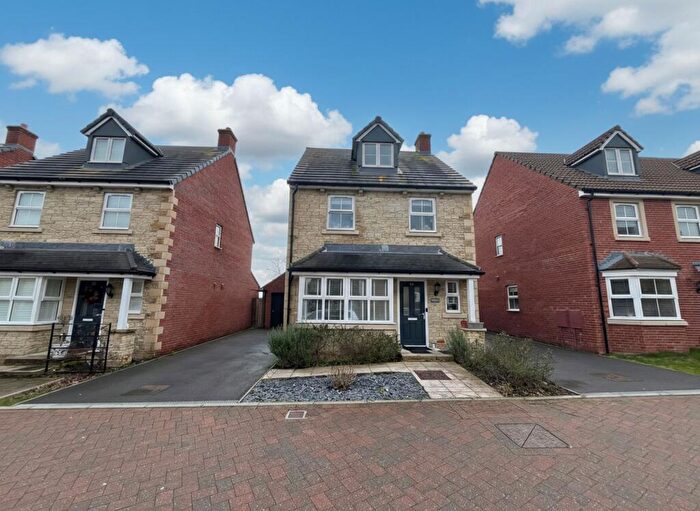
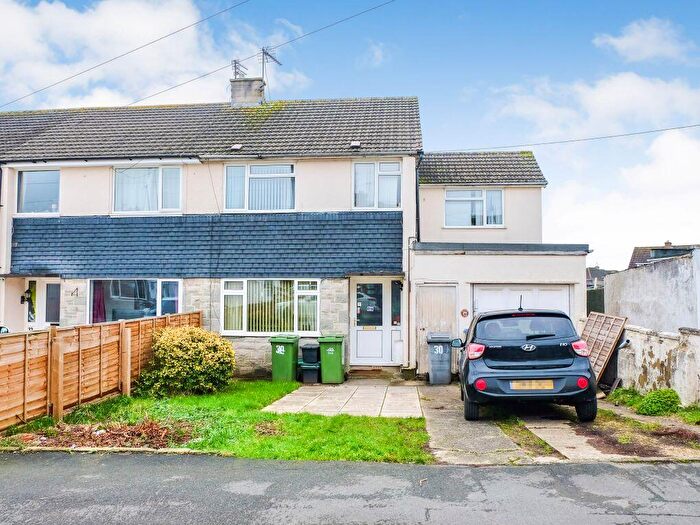
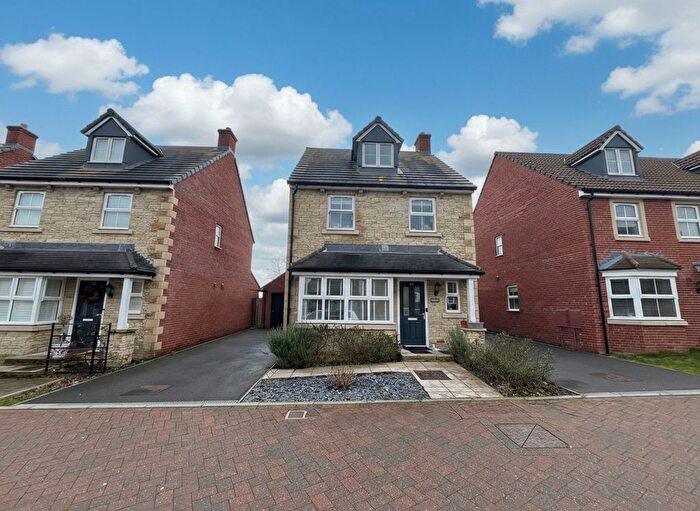
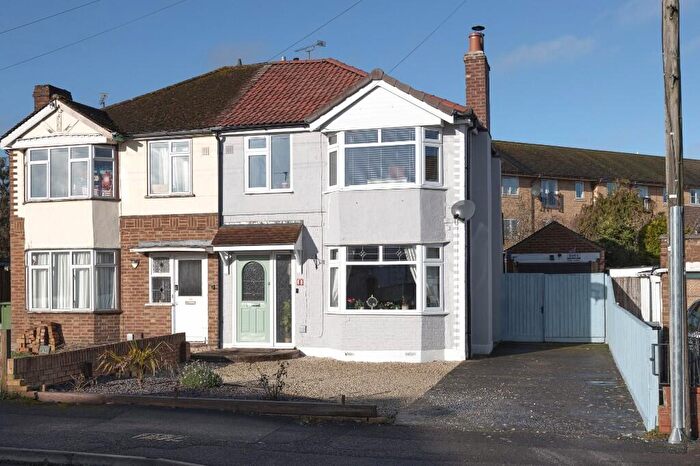
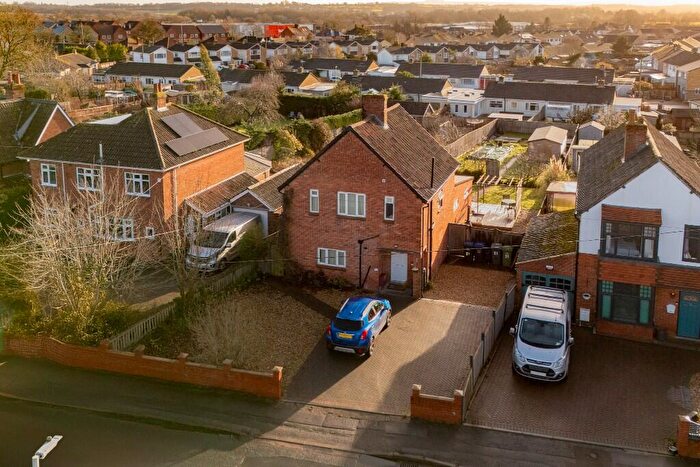
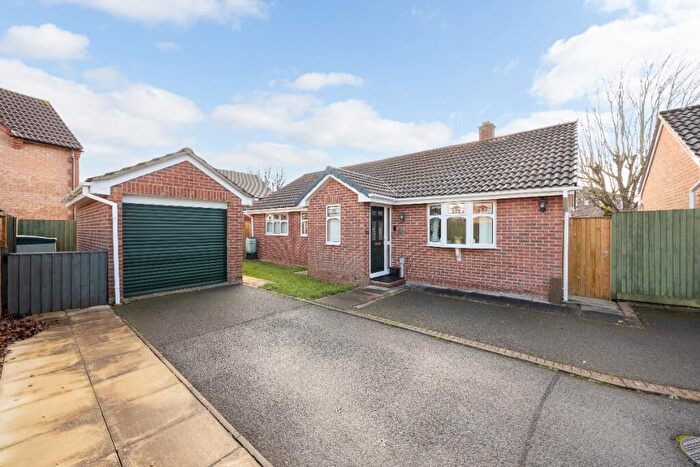
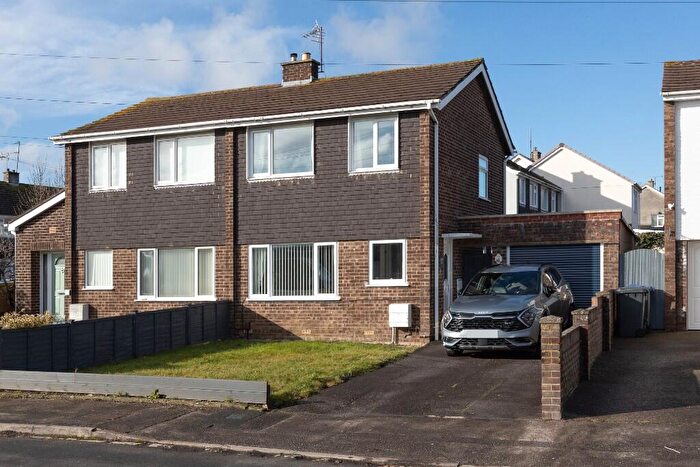
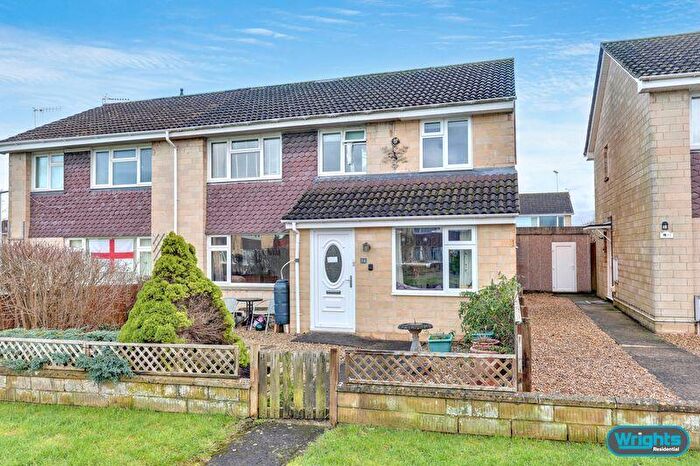
Houses for sale & to rent in Trowbridge Drynham, Trowbridge
House Prices in Trowbridge Drynham
Properties in Trowbridge Drynham have an average house price of £262,935.00 and had 183 Property Transactions within the last 3 years¹.
Trowbridge Drynham is an area in Trowbridge, Wiltshire with 1,727 households², where the most expensive property was sold for £577,500.00.
Properties for sale in Trowbridge Drynham
Roads and Postcodes in Trowbridge Drynham
Navigate through our locations to find the location of your next house in Trowbridge Drynham, Trowbridge for sale or to rent.
| Streets | Postcodes |
|---|---|
| Alderton Way | BA14 0UE BA14 0UF BA14 0UH BA14 0UP |
| Ashmead | BA14 0PA BA14 0PB |
| Ashmead Court | BA14 0QD |
| Baydon Close | BA14 0RS |
| Bradley Road | BA14 0QS BA14 0QT BA14 0QX BA14 0QY BA14 0QZ BA14 0RA BA14 0RB BA14 0RG BA14 0RT BA14 0AZ BA14 0FJ BA14 0RQ |
| Buckleaze Close | BA14 0US |
| Burderop Close | BA14 0UL |
| Burnett Road | BA14 0QA |
| Campion Drive | BA14 0XZ |
| Carlton Row | BA14 0RJ |
| Cavell Court | BA14 0HH |
| Cheverell Close | BA14 0BH |
| Chirton Place | BA14 0XT |
| Clydesdale Close | BA14 0YE |
| Collingbourne Close | BA14 0UY |
| Comfrey Close | BA14 0XP |
| Dilton Close | BA14 0FS |
| Drynham Park | BA14 0PQ |
| Drynham Road | BA14 0PE BA14 0PF BA14 0PJ |
| Dunford Close | BA14 0PW |
| Dursley Road | BA14 0NN BA14 0NP BA14 0NR BA14 0NS BA14 0NW |
| Edington Drive | BA14 0FR |
| Elcombe Close | BA14 0JL |
| Everleigh Close | BA14 0UZ |
| Harmony Place | BA14 0NT |
| Holbrook Lane | BA14 0PP BA14 0PR BA14 0PS BA14 0PT |
| Inglesham Close | BA14 0UD |
| Liddington Way | BA14 0UB |
| Lockeridge Close | BA14 0UT |
| Lydiard Way | BA14 0UG BA14 0UJ BA14 0UN BA14 0UQ BA14 0UW |
| Mallow Close | BA14 0XY |
| Manton Close | BA14 0RZ |
| Marden Walk | BA14 0XR |
| New Road | BA14 0NL |
| Pembroke Close | BA14 0PX |
| Ramsbury Walk | BA14 0UU BA14 0UX |
| Redgrave Close | BA14 0HW |
| Runnymede Gardens | BA14 0FN |
| Rutland Crescent | BA14 0FH BA14 0NU BA14 0NX BA14 0NY |
| Shrewton Close | BA14 0XS |
| Sorrel Close | BA14 0XX |
| Southview Road | BA14 0PY BA14 0PZ |
| Southwick Mews | BA14 0FU |
| Speedwell Close | BA14 0YA |
| Stanton Close | BA14 0UA |
| Studley Rise | BA14 0PD BA14 0PH |
| The Croft | BA14 0RH BA14 0RL BA14 0RN BA14 0RP BA14 0RW |
| The Homestead | BA14 0NZ |
| Wellscote Gardens | BA14 0FP |
| White Horse Close | BA14 0QB |
| Wilcot Close | BA14 0RU |
| Wilton Drive | BA14 0PU |
| Wiltshire Drive | BA14 0RE BA14 0RR BA14 0RX BA14 0RY |
| Windsor Road | BA14 0FY |
| Woodborough Close | BA14 0XU |
| Yarnbrook Gardens | BA14 0FT |
| BA14 0FQ |
Transport near Trowbridge Drynham
-
Trowbridge Station
-
Westbury Station
-
Bradford-On-Avon Station
-
Avoncliff Station
-
Dilton Marsh Station
-
Freshford Station
- FAQ
- Price Paid By Year
- Property Type Price
Frequently asked questions about Trowbridge Drynham
What is the average price for a property for sale in Trowbridge Drynham?
The average price for a property for sale in Trowbridge Drynham is £262,935. This amount is 11% lower than the average price in Trowbridge. There are 1,207 property listings for sale in Trowbridge Drynham.
What streets have the most expensive properties for sale in Trowbridge Drynham?
The streets with the most expensive properties for sale in Trowbridge Drynham are Holbrook Lane at an average of £421,500, Manton Close at an average of £405,000 and Dilton Close at an average of £405,000.
What streets have the most affordable properties for sale in Trowbridge Drynham?
The streets with the most affordable properties for sale in Trowbridge Drynham are Everleigh Close at an average of £167,500, Dursley Road at an average of £172,997 and Lockeridge Close at an average of £200,000.
Which train stations are available in or near Trowbridge Drynham?
Some of the train stations available in or near Trowbridge Drynham are Trowbridge, Westbury and Bradford-On-Avon.
Property Price Paid in Trowbridge Drynham by Year
The average sold property price by year was:
| Year | Average Sold Price | Price Change |
Sold Properties
|
|---|---|---|---|
| 2025 | £277,934 | 4% |
58 Properties |
| 2024 | £266,481 | 9% |
69 Properties |
| 2023 | £243,031 | -7% |
56 Properties |
| 2022 | £261,153 | 2% |
70 Properties |
| 2021 | £254,860 | 2% |
101 Properties |
| 2020 | £249,611 | 13% |
79 Properties |
| 2019 | £217,225 | 3% |
78 Properties |
| 2018 | £210,785 | 4% |
81 Properties |
| 2017 | £202,816 | -8% |
76 Properties |
| 2016 | £218,648 | 18% |
94 Properties |
| 2015 | £178,763 | 8% |
78 Properties |
| 2014 | £163,723 | 10% |
82 Properties |
| 2013 | £147,367 | 0,1% |
71 Properties |
| 2012 | £147,203 | -6% |
53 Properties |
| 2011 | £155,833 | -5% |
49 Properties |
| 2010 | £163,699 | 14% |
53 Properties |
| 2009 | £140,059 | -13% |
63 Properties |
| 2008 | £158,877 | -4% |
62 Properties |
| 2007 | £165,048 | 9% |
85 Properties |
| 2006 | £150,219 | 5% |
108 Properties |
| 2005 | £142,778 | -3% |
109 Properties |
| 2004 | £146,896 | 17% |
152 Properties |
| 2003 | £122,651 | 14% |
102 Properties |
| 2002 | £105,167 | 20% |
121 Properties |
| 2001 | £84,119 | 11% |
124 Properties |
| 2000 | £74,875 | 11% |
100 Properties |
| 1999 | £66,813 | 8% |
138 Properties |
| 1998 | £61,398 | 4% |
134 Properties |
| 1997 | £58,972 | 7% |
122 Properties |
| 1996 | £54,788 | -2% |
104 Properties |
| 1995 | £56,043 | - |
123 Properties |
Property Price per Property Type in Trowbridge Drynham
Here you can find historic sold price data in order to help with your property search.
The average Property Paid Price for specific property types in the last three years are:
| Property Type | Average Sold Price | Sold Properties |
|---|---|---|
| Semi Detached House | £266,818.00 | 65 Semi Detached Houses |
| Detached House | £356,353.00 | 46 Detached Houses |
| Terraced House | £214,903.00 | 60 Terraced Houses |
| Flat | £123,954.00 | 12 Flats |

