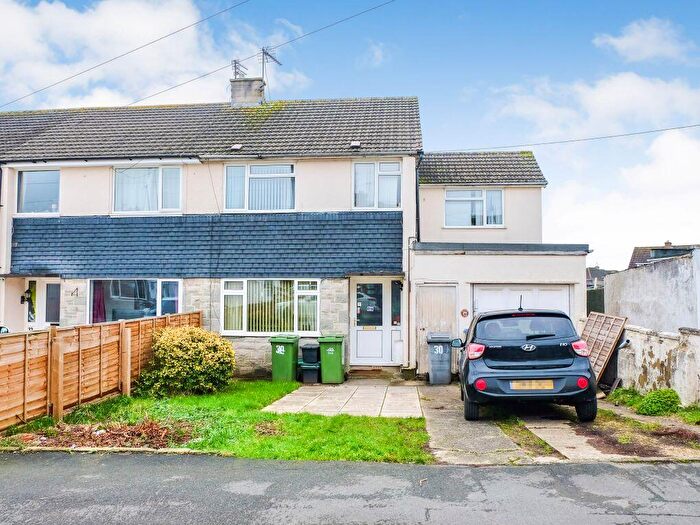
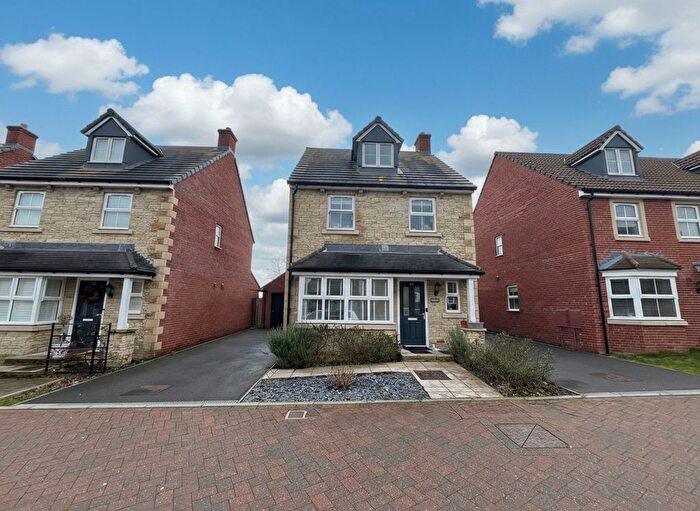
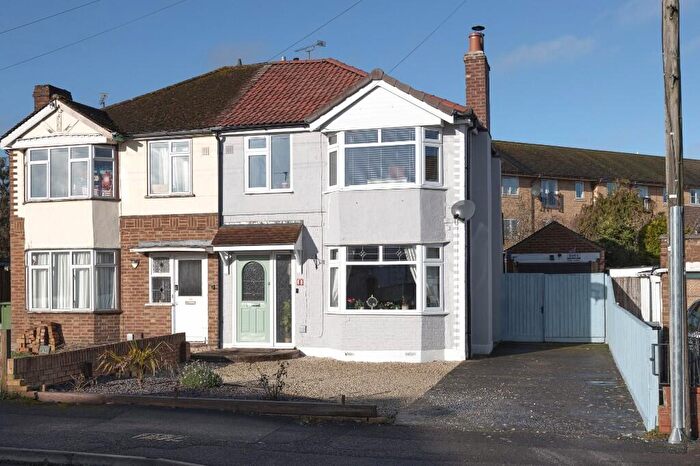
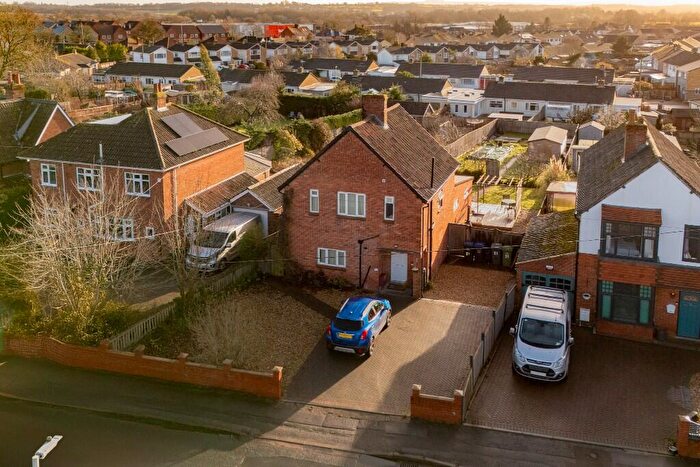
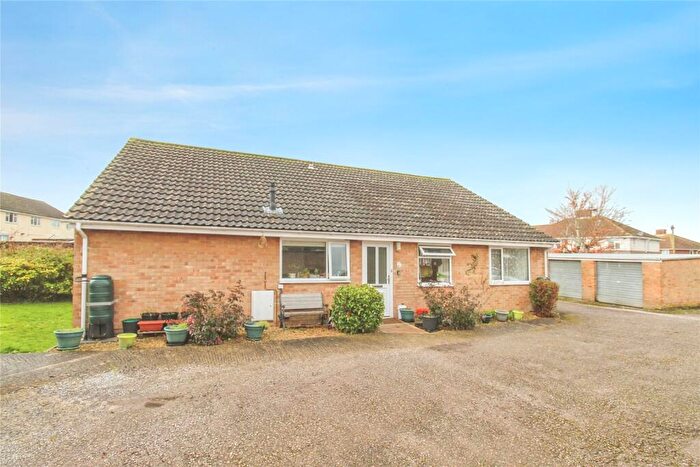
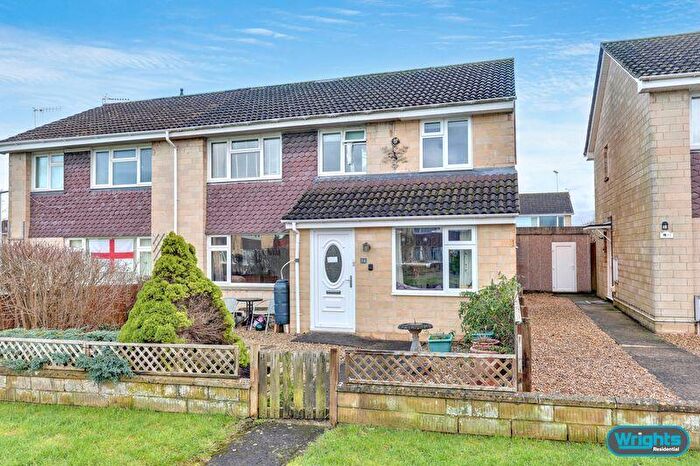
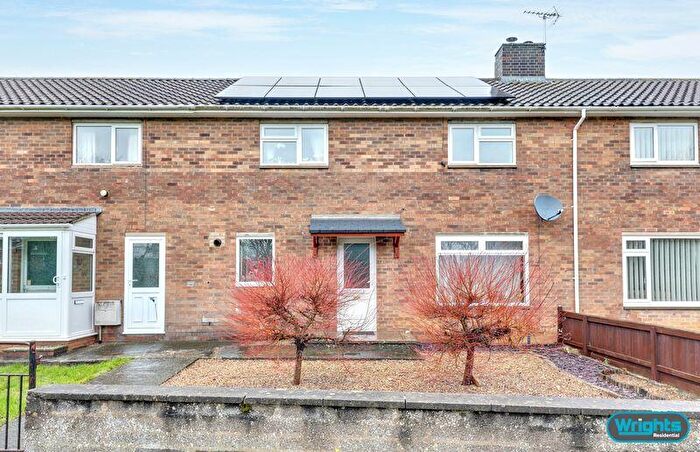
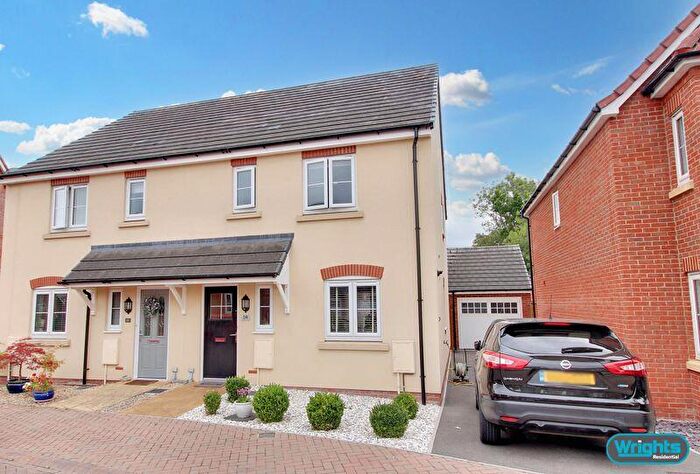
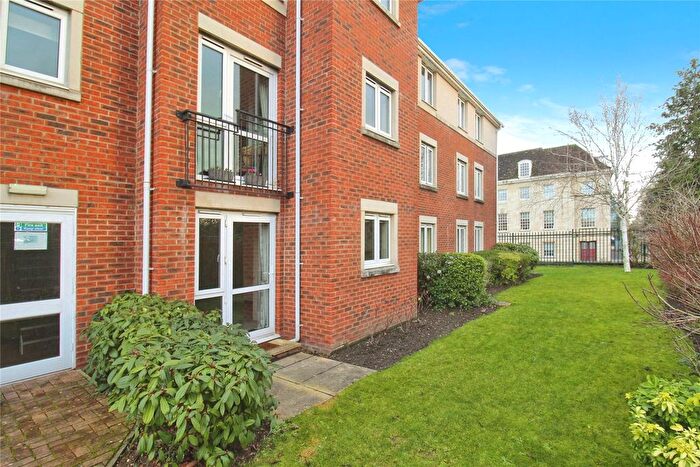
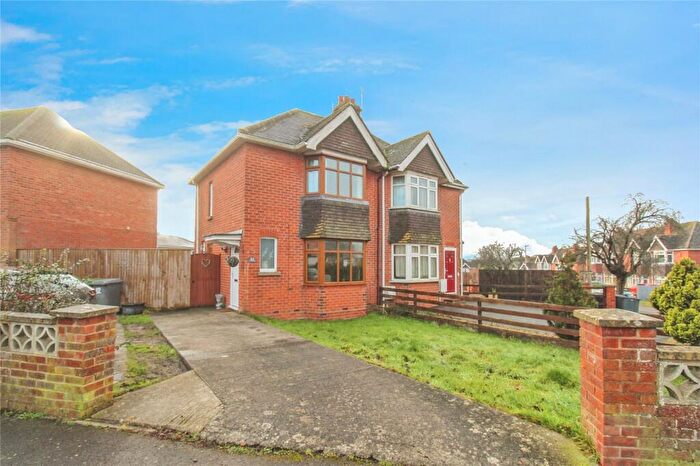
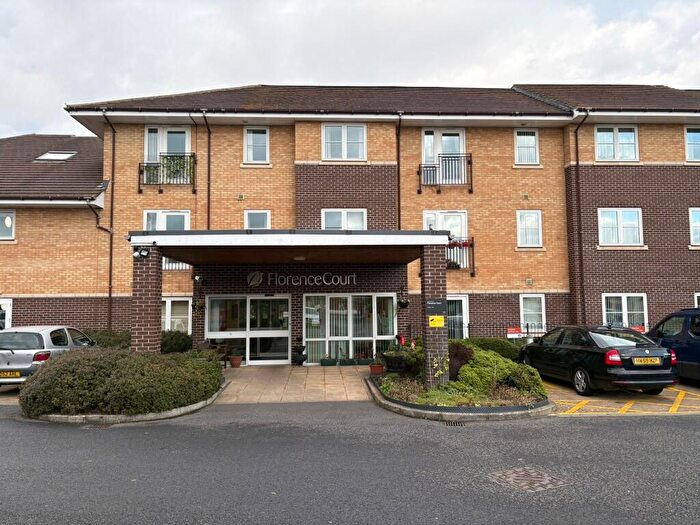
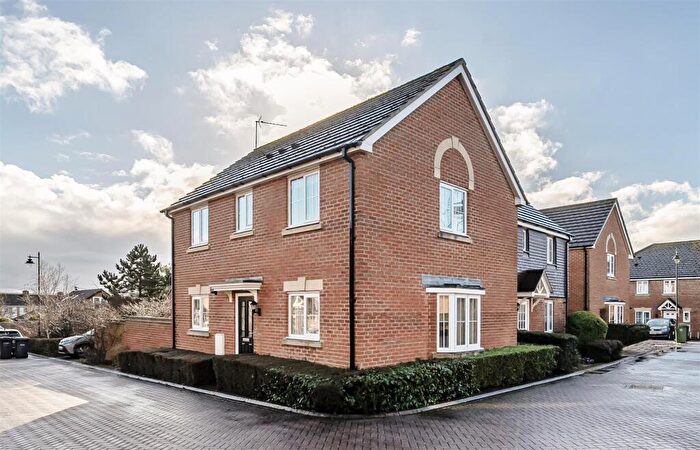
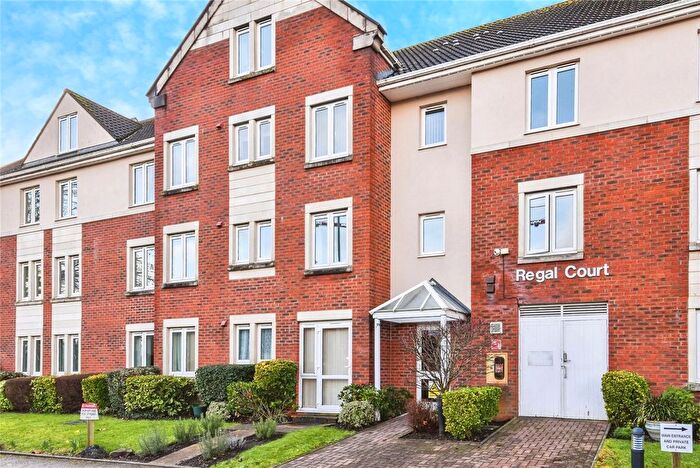
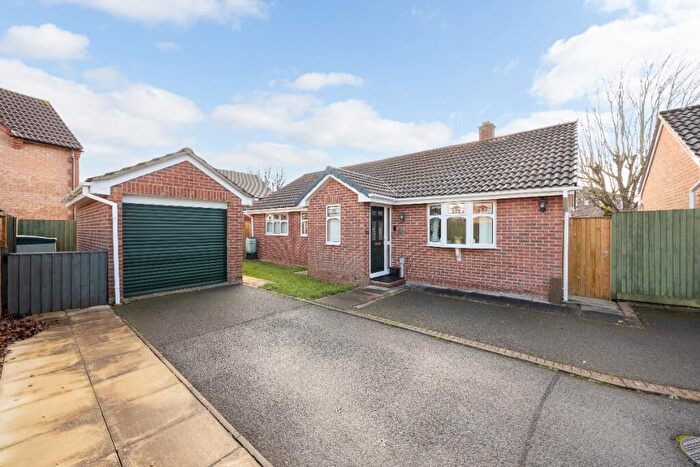
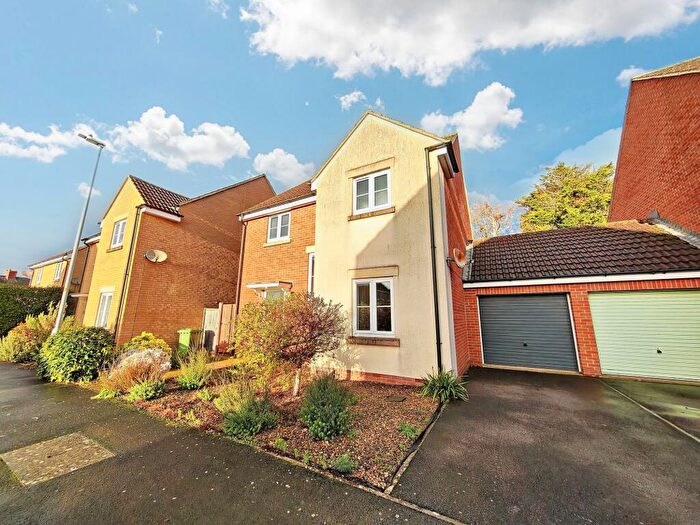
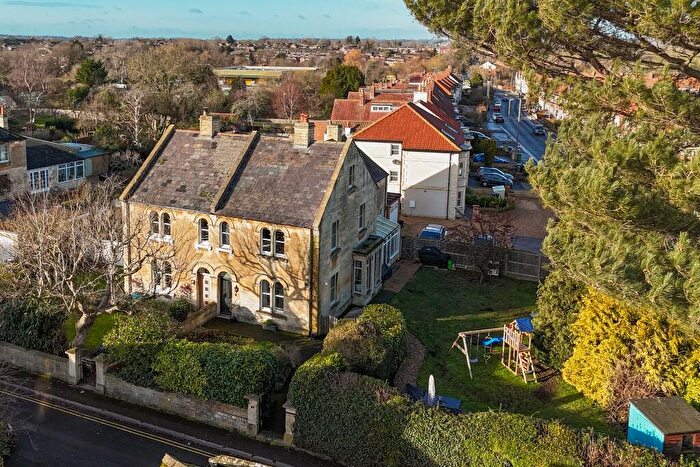
Houses for sale & to rent in Trowbridge Grove, Trowbridge
House Prices in Trowbridge Grove
Properties in Trowbridge Grove have an average house price of £283,062.00 and had 168 Property Transactions within the last 3 years¹.
Trowbridge Grove is an area in Trowbridge, Wiltshire with 1,857 households², where the most expensive property was sold for £550,000.00.
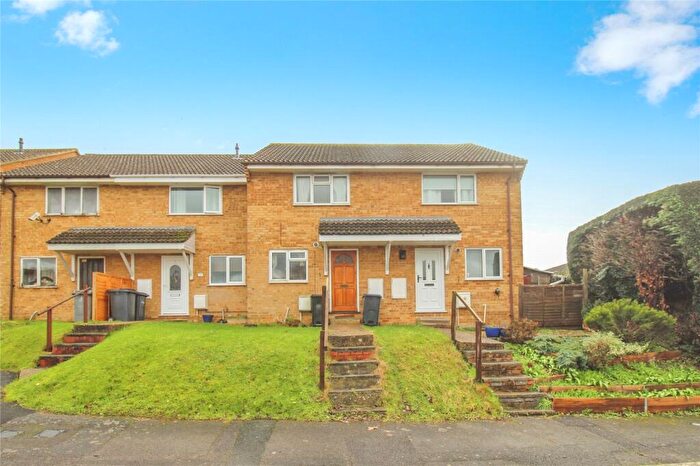
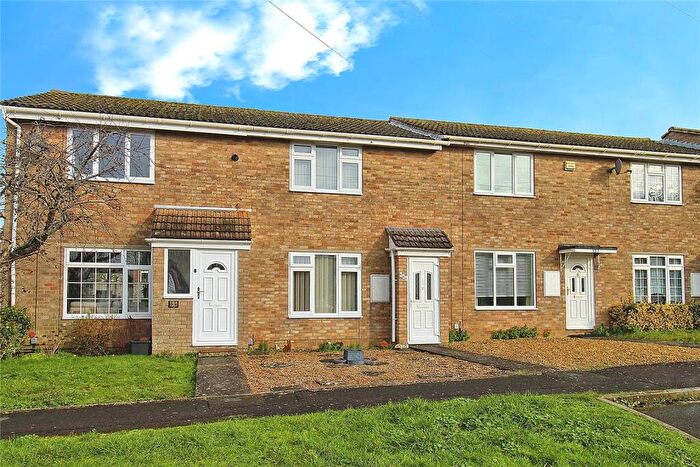
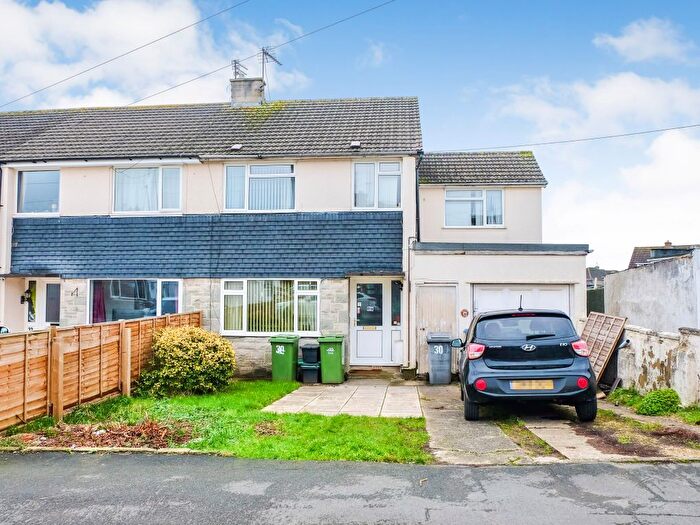
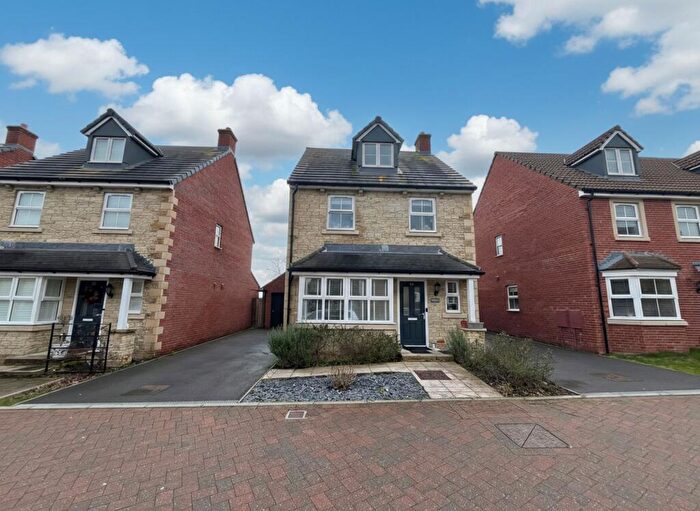
Properties for sale in Trowbridge Grove
Roads and Postcodes in Trowbridge Grove
Navigate through our locations to find the location of your next house in Trowbridge Grove, Trowbridge for sale or to rent.
| Streets | Postcodes |
|---|---|
| Alder Close | BA14 0JJ |
| Allen Road | BA14 0BT |
| Almond Grove | BA14 0HY BA14 0HZ |
| Balmoral Road | BA14 0JS |
| Beech Grove | BA14 0HG BA14 0HQ |
| Bewley Road | BA14 0LN |
| Boundary Walk | BA14 0LT BA14 0LZ |
| Broughton Road | BA14 0LW |
| Cedar Grove | BA14 0HS |
| Chestnut Grove | BA14 0JA |
| Church Fields | BA14 0EJ |
| Church Lane | BA14 0EH |
| College Road | BA14 0EP BA14 0ER BA14 0ET BA14 0EU BA14 0EX BA14 0EY BA14 0EZ BA14 0ES BA14 0EW BA14 0FA |
| Frome Road | BA14 0DL BA14 0DN BA14 0DP BA14 0DR BA14 0DS BA14 0DT BA14 0DU BA14 0DW BA14 0DY BA14 0DZ BA14 0EA BA14 0EB BA14 0ED BA14 0EE BA14 0EF BA14 0DJ |
| Hawthorn Grove | BA14 0JE BA14 0JF |
| Hazel Grove | BA14 0JG |
| Heddington Close | BA14 0LH |
| Holyrood Close | BA14 0JT |
| Hornbeam Road | BA14 0AF |
| Kingsdown Road | BA14 0LA BA14 0LB BA14 0LD |
| Laburnum Grove | BA14 0HP |
| Langley Road | BA14 0LL |
| Larch Grove | BA14 0HX |
| Laurel Grove | BA14 0HT |
| Lilac Grove | BA14 0HB |
| Maple Grove | BA14 0HU |
| Marston Road | BA14 0LP BA14 0LR BA14 0LS BA14 0LU |
| Oldbrick Fields | BA14 0FB |
| Pine Grove | BA14 0FF |
| Pitman Avenue | BA14 0BU BA14 0BX BA14 0BY BA14 0BZ |
| Pitman Court | BA14 0EL |
| Rock Road | BA14 0BS |
| Sandringham Road | BA14 0JU |
| Silver Birch Grove | BA14 0JQ |
| Silver Meadows | BA14 0LF |
| Silver Street Lane | BA14 0JN BA14 0JP BA14 0JR BA14 0JW BA14 0JX BA14 0JY |
| Spring Meadows | BA14 0HD |
| St Margarets Close | BA14 0EN |
| Summerdown Walk | BA14 0LE BA14 0LJ |
| Sycamore Grove | BA14 0JB BA14 0JD BA14 0JH |
| The Moldens | BA14 0FG |
| The Nestings | BA14 0BN |
| The Poplars | BA14 0AG |
| Upper Studley | BA14 0DX |
| Walnut Grove | BA14 0HR |
| Westmead Crescent | BA14 0LY |
| Whiterow Park | BA14 0EG BA14 0EQ |
| Willow Grove | BA14 0HA |
| Windsor Drive | BA14 0JZ |
| Winterslow Road | BA14 0LX |
Transport near Trowbridge Grove
- FAQ
- Price Paid By Year
- Property Type Price
Frequently asked questions about Trowbridge Grove
What is the average price for a property for sale in Trowbridge Grove?
The average price for a property for sale in Trowbridge Grove is £283,062. This amount is 5% lower than the average price in Trowbridge. There are 974 property listings for sale in Trowbridge Grove.
What streets have the most expensive properties for sale in Trowbridge Grove?
The streets with the most expensive properties for sale in Trowbridge Grove are Windsor Drive at an average of £537,500, Sandringham Road at an average of £475,000 and Holyrood Close at an average of £431,333.
What streets have the most affordable properties for sale in Trowbridge Grove?
The streets with the most affordable properties for sale in Trowbridge Grove are Pitman Court at an average of £119,000, Allen Road at an average of £192,500 and Larch Grove at an average of £215,000.
Which train stations are available in or near Trowbridge Grove?
Some of the train stations available in or near Trowbridge Grove are Trowbridge, Westbury and Bradford-On-Avon.
Property Price Paid in Trowbridge Grove by Year
The average sold property price by year was:
| Year | Average Sold Price | Price Change |
Sold Properties
|
|---|---|---|---|
| 2025 | £295,988 | 5% |
50 Properties |
| 2024 | £280,020 | 2% |
63 Properties |
| 2023 | £274,795 | -4% |
55 Properties |
| 2022 | £286,740 | 12% |
59 Properties |
| 2021 | £253,534 | 8% |
84 Properties |
| 2020 | £234,191 | 1% |
62 Properties |
| 2019 | £232,222 | 2% |
65 Properties |
| 2018 | £227,468 | 3% |
82 Properties |
| 2017 | £220,438 | 15% |
63 Properties |
| 2016 | £187,421 | 5% |
80 Properties |
| 2015 | £177,944 | 5% |
66 Properties |
| 2014 | £169,278 | 2% |
72 Properties |
| 2013 | £165,556 | 4% |
60 Properties |
| 2012 | £158,346 | -8% |
64 Properties |
| 2011 | £170,537 | -0,3% |
55 Properties |
| 2010 | £171,101 | 12% |
71 Properties |
| 2009 | £149,783 | -12% |
61 Properties |
| 2008 | £167,061 | -4% |
67 Properties |
| 2007 | £174,000 | 8% |
110 Properties |
| 2006 | £160,154 | 3% |
97 Properties |
| 2005 | £155,157 | 3% |
85 Properties |
| 2004 | £151,038 | 13% |
94 Properties |
| 2003 | £131,053 | 11% |
99 Properties |
| 2002 | £116,696 | 12% |
97 Properties |
| 2001 | £102,969 | 18% |
139 Properties |
| 2000 | £84,318 | 10% |
111 Properties |
| 1999 | £76,299 | 12% |
119 Properties |
| 1998 | £67,256 | 8% |
103 Properties |
| 1997 | £61,617 | 20% |
123 Properties |
| 1996 | £49,531 | -4% |
90 Properties |
| 1995 | £51,356 | - |
70 Properties |
Property Price per Property Type in Trowbridge Grove
Here you can find historic sold price data in order to help with your property search.
The average Property Paid Price for specific property types in the last three years are:
| Property Type | Average Sold Price | Sold Properties |
|---|---|---|
| Semi Detached House | £271,900.00 | 56 Semi Detached Houses |
| Detached House | £380,270.00 | 40 Detached Houses |
| Terraced House | £243,312.00 | 68 Terraced Houses |
| Flat | £143,000.00 | 4 Flats |

