
Houses for sale & to rent in Rock Ferry, Wirral
House Prices in Rock Ferry
Properties in Rock Ferry have an average house price of £245k and had 23 Property Transactions within the last 3 years¹.
Rock Ferry is an area in Wirral, Wirral with 255 households², where the most expensive property was sold for £565k.
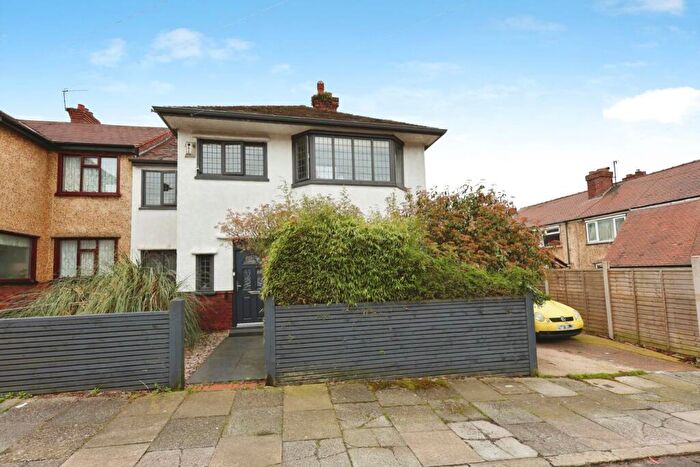
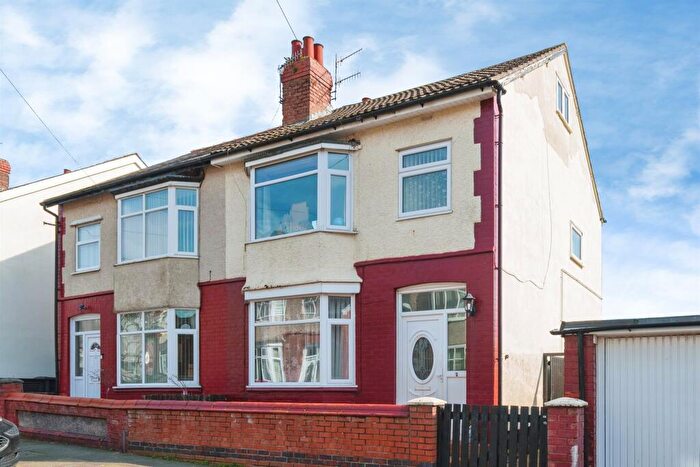
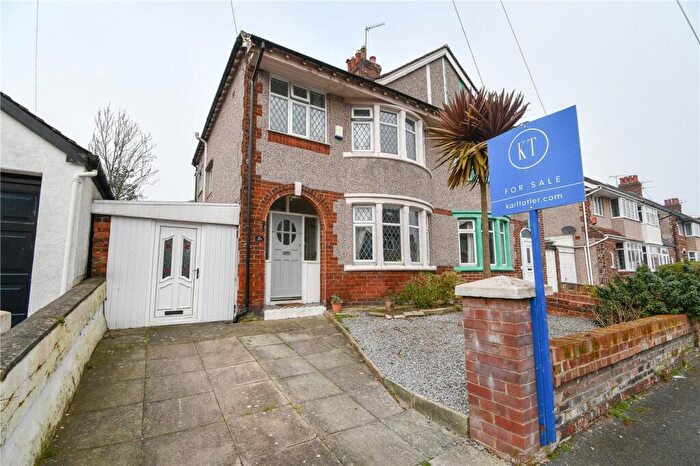
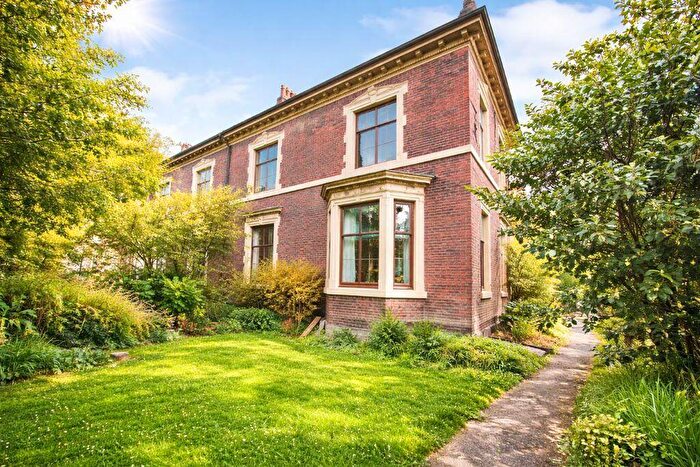
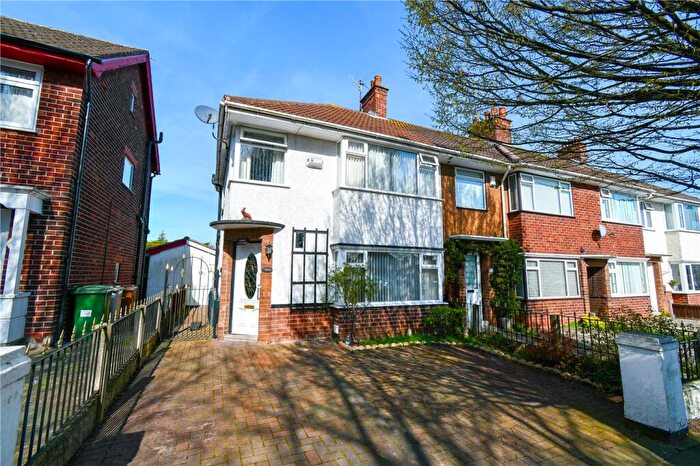
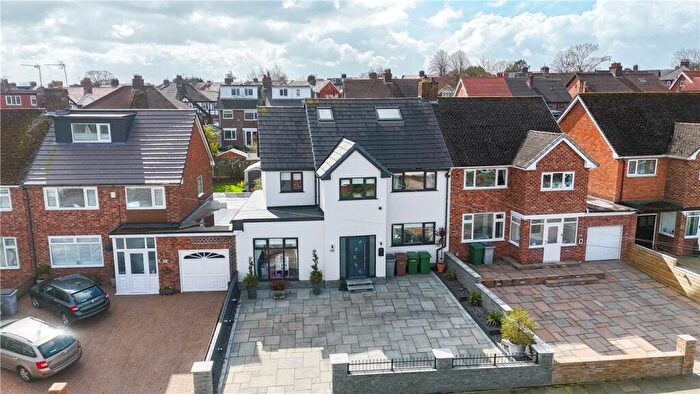
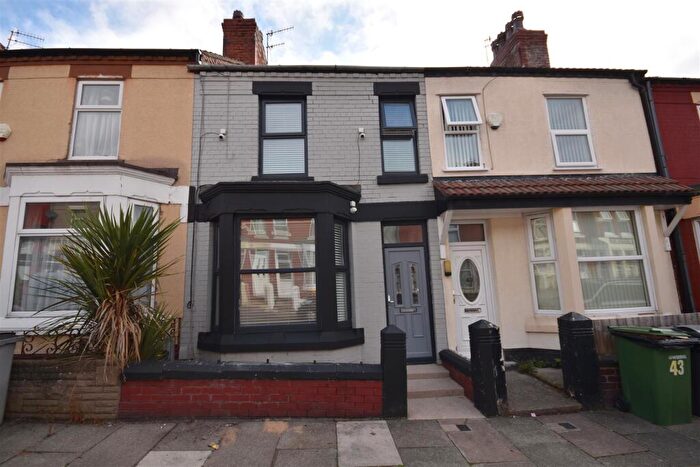
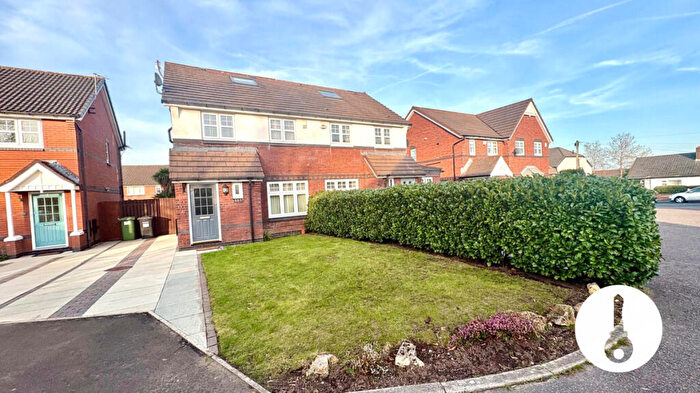
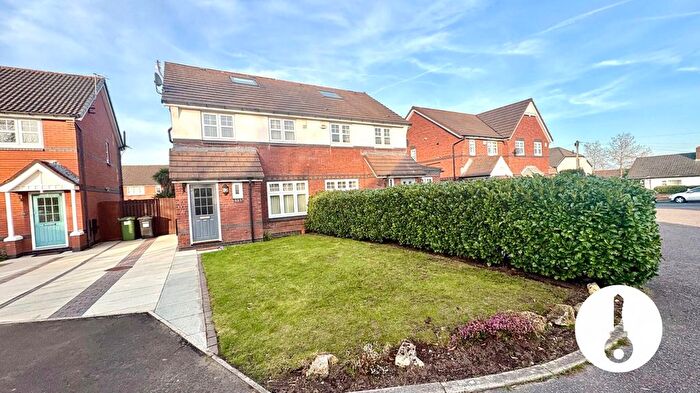
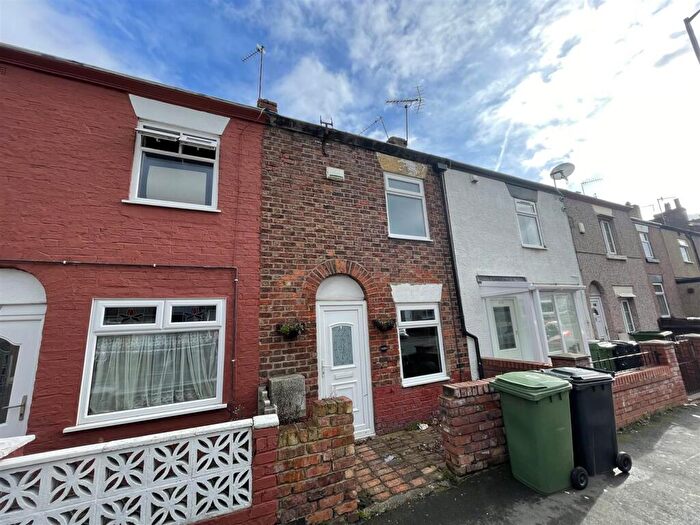
Properties for sale in Rock Ferry
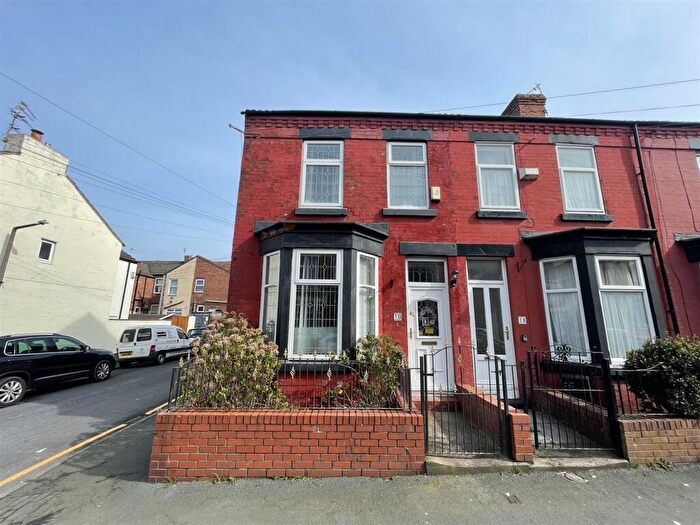
![]()
If you are looking to sell your house, let it out, or receive a property valuation, an expert can help you.
Click the button below to get started.

Roads and Postcodes in Rock Ferry
Navigate through our locations to find the location of your next house in Rock Ferry, Wirral for sale or to rent.
| Streets | Postcodes |
|---|---|
| College Drive | CH63 7LN CH63 7LW |
| Hulmewood | CH63 7LD |
| Old Chester Road | CH63 7LH CH63 7LQ CH63 8NE |
| Raby Grove | CH63 5PX |
| Rocklands Avenue | CH63 7LJ |
| Rydal Bank | CH63 7LL |
| The Close | CH63 5PU |
| Thornton Road | CH63 5PN CH63 5PS |
Transport near Rock Ferry
-
 Bebington Station
 -
Rock Ferry Station
-
Port Sunlight Station
-
Green Lane Station
-
Birkenhead Central Station
-
Spital Station
-
Brunswick Station
-
Conway Park Station
-
Birkenhead Hamilton Square Station
-
Bromborough Rake Station
- FAQ
- Price Paid By Year
- Property Type Price
Frequently asked questions about Rock Ferry
What is the average price for a property for sale in Rock Ferry?
The average price for a property for sale in Rock Ferry is £244,552. This amount is 15% lower than the average price in Wirral. There are 1,105 property listings for sale in Rock Ferry.
What streets have the most expensive properties for sale in Rock Ferry?
The streets with the most expensive properties for sale in Rock Ferry are Thornton Road at an average of £415,373, The Close at an average of £415,000 and Rocklands Avenue at an average of £242,500.
What streets have the most affordable properties for sale in Rock Ferry?
The streets with the most affordable properties for sale in Rock Ferry are Hulmewood at an average of £172,500, College Drive at an average of £175,356 and Old Chester Road at an average of £226,750.
Which train stations are available in or near Rock Ferry?
Some of the train stations available in or near Rock Ferry are Bebington, Rock Ferry and Port Sunlight.
Property Price Paid in Rock Ferry by Year
The average sold property price by year was:
| Year | Average Sold Price | Price Change |
Sold Properties
|
|---|---|---|---|
| 2025 | £258,921 | -1% |
10 Properties |
| 2024 | £261,600 | 17% |
5 Properties |
| 2023 | £215,936 | 4% |
8 Properties |
| 2022 | £206,230 | 6% |
15 Properties |
| 2021 | £193,973 | 20% |
16 Properties |
| 2020 | £154,571 | 1% |
14 Properties |
| 2019 | £153,750 | -5% |
6 Properties |
| 2018 | £161,237 | -16% |
4 Properties |
| 2017 | £186,368 | 23% |
8 Properties |
| 2016 | £143,370 | -21% |
12 Properties |
| 2015 | £172,950 | 25% |
11 Properties |
| 2014 | £129,441 | 7% |
7 Properties |
| 2013 | £120,999 | -23% |
5 Properties |
| 2012 | £148,800 | -13% |
8 Properties |
| 2011 | £168,333 | 7% |
6 Properties |
| 2010 | £156,625 | 21% |
4 Properties |
| 2009 | £122,983 | -27% |
3 Properties |
| 2008 | £156,492 | -2% |
7 Properties |
| 2007 | £160,172 | -12% |
11 Properties |
| 2006 | £179,813 | 21% |
11 Properties |
| 2005 | £142,250 | 10% |
10 Properties |
| 2004 | £128,022 | 22% |
9 Properties |
| 2003 | £99,718 | 25% |
11 Properties |
| 2002 | £74,520 | 0,4% |
15 Properties |
| 2001 | £74,191 | 17% |
18 Properties |
| 2000 | £61,941 | -5% |
12 Properties |
| 1999 | £64,784 | 23% |
14 Properties |
| 1998 | £49,891 | -7% |
14 Properties |
| 1997 | £53,233 | 8% |
6 Properties |
| 1996 | £48,988 | -19% |
9 Properties |
| 1995 | £58,449 | - |
11 Properties |
Property Price per Property Type in Rock Ferry
Here you can find historic sold price data in order to help with your property search.
The average Property Paid Price for specific property types in the last three years are:
| Property Type | Average Sold Price | Sold Properties |
|---|---|---|
| Semi Detached House | £208,095.00 | 18 Semi Detached Houses |
| Terraced House | £150,000.00 | 1 Terraced House |
| Detached House | £432,248.00 | 4 Detached Houses |