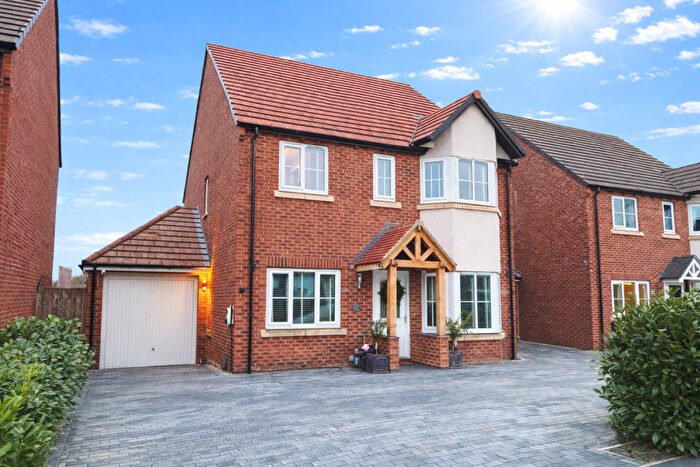
Houses for sale & to rent in Bretforton And Offenham, Evesham
House Prices in Bretforton And Offenham
Properties in Bretforton And Offenham have an average house price of £348,321.00 and had 98 Property Transactions within the last 3 years¹.
Bretforton And Offenham is an area in Evesham, Worcestershire with 1,113 households², where the most expensive property was sold for £1,190,000.00.
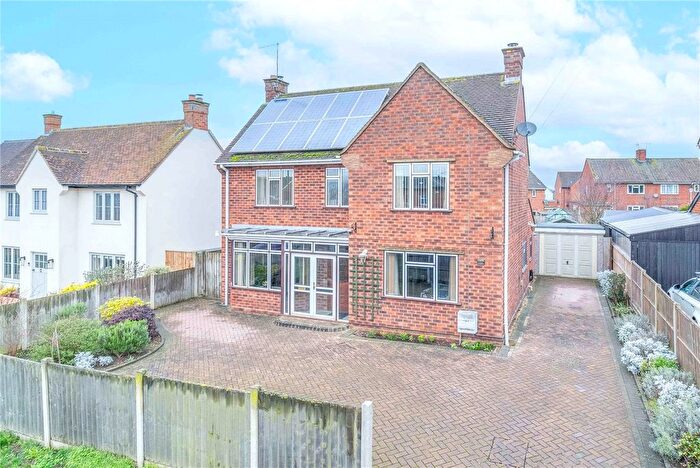
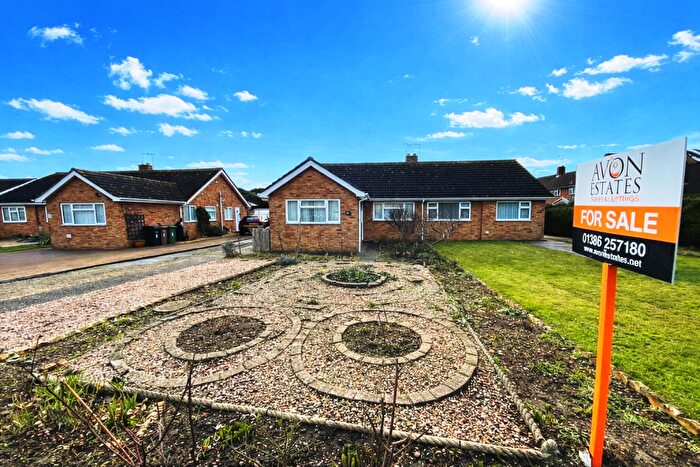
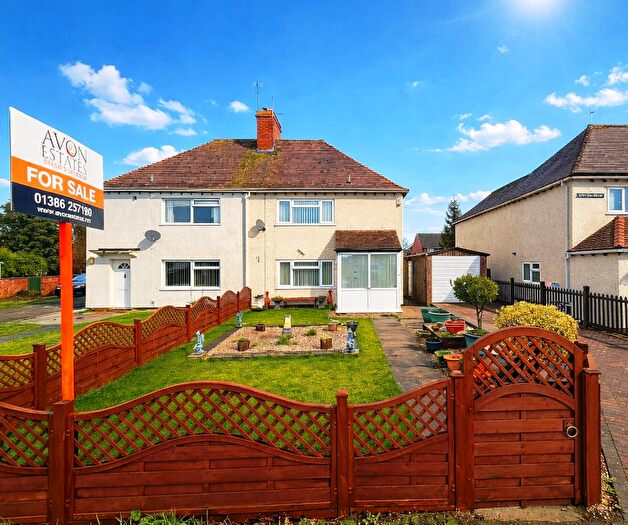
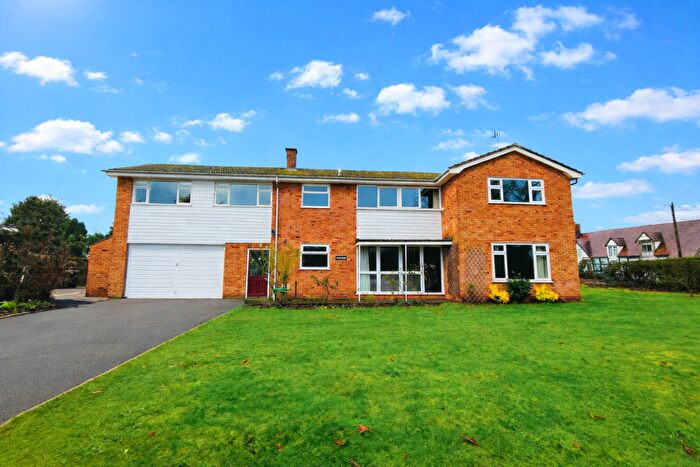
Properties for sale in Bretforton And Offenham
Previously listed properties in Bretforton And Offenham
Roads and Postcodes in Bretforton And Offenham
Navigate through our locations to find the location of your next house in Bretforton And Offenham, Evesham for sale or to rent.
| Streets | Postcodes |
|---|---|
| Ashwin Court | WR11 7HL |
| Avon Court | WR11 8RU |
| Avoncroft | WR11 8QA |
| Back Lane | WR11 7JA WR11 7JB |
| Bennetts Hill | WR11 8RN |
| Bennetts Hill Court | WR11 8TA |
| Blackminster Business Park | WR11 7RE |
| Boat Lane | WR11 8QZ WR11 8RS |
| Bridge Street | WR11 7JD |
| Cedar Walk | WR11 8SZ |
| Cherry Close | WR11 8SQ |
| Chestnut Grange | WR11 8TF |
| Church Street | WR11 8RW |
| Clayfield Road | WR11 7HS |
| Coldicotts Close | WR11 7HT |
| Coldicotts Lane | WR11 7HU |
| Court Lane | WR11 8RP |
| Crabtree Leys | WR11 8SE |
| Drinkwater Lane | WR11 7JQ |
| Evesham Road | WR11 8SA |
| Fallon Lane | WR11 7GZ |
| Ferry Lane | WR11 8RT |
| Gibbs Lane | WR11 8RR |
| Grange Road | WR11 7HR |
| Gras Close | WR11 7JP |
| Hilary Gardens | WR11 7ZE |
| Holly Close | WR11 7GY |
| Honeybourne Road | WR11 7PB |
| Ivy Lane | WR11 7HP |
| Laurels Avenue | WR11 8RD |
| Laurels Road | WR11 8AB WR11 8RE |
| Leasowes Road | WR11 8RQ |
| Main Street | WR11 7JH WR11 7JJ WR11 8QB WR11 8QD WR11 8RL WR11 8RX |
| Manor Lane | WR11 7JR |
| Merry Lane | WR11 8ST |
| Mill Road | WR11 8RF |
| Myatt Road | WR11 8SB WR11 8SD |
| New Road | WR11 8RG |
| New Street | WR11 7HY WR11 7JS |
| Newtown | WR11 8RZ |
| Norval Crescent | WR11 8RH |
| Off Main Street | WR11 8SU |
| Old School Close | WR11 8SF |
| Orchard Close | WR11 7HZ |
| Orchard Grove | WR11 8GZ |
| School Lane | WR11 7JG |
| Shop Lane | WR11 7JF |
| Squires Court | WR11 7QD |
| St Milburgh Close | WR11 8RJ |
| Station Road | WR11 7HX WR11 7TF WR11 8LW WR11 8TG WR11 8JJ WR11 8YH |
| Stoneford Lane | WR11 7HN WR11 7GW |
| The Cross | WR11 7JE WR11 8RB |
| The Quarry | WR11 7YT |
| The Squires | WR11 7XN |
| Three Cocks Lane | WR11 8RY |
| Upper End Court | WR11 7GE |
| Victoria Gardens | WR11 7FR |
| Weston Road | WR11 7HW |
| Whitford Close | WR11 7JW |
| WR11 7TD |
Transport near Bretforton And Offenham
-
Evesham Station
-
Honeybourne Station
-
Pershore Station
-
Stratford-Upon-Avon Station
-
Stratford Pkway Station
- FAQ
- Price Paid By Year
- Property Type Price
Frequently asked questions about Bretforton And Offenham
What is the average price for a property for sale in Bretforton And Offenham?
The average price for a property for sale in Bretforton And Offenham is £348,321. This amount is 8% higher than the average price in Evesham. There are 623 property listings for sale in Bretforton And Offenham.
What streets have the most expensive properties for sale in Bretforton And Offenham?
The streets with the most expensive properties for sale in Bretforton And Offenham are Bridge Street at an average of £740,000, Weston Road at an average of £589,166 and Church Street at an average of £442,500.
What streets have the most affordable properties for sale in Bretforton And Offenham?
The streets with the most affordable properties for sale in Bretforton And Offenham are Avoncroft at an average of £153,500, Holly Close at an average of £167,500 and Stoneford Lane at an average of £220,000.
Which train stations are available in or near Bretforton And Offenham?
Some of the train stations available in or near Bretforton And Offenham are Evesham, Honeybourne and Pershore.
Property Price Paid in Bretforton And Offenham by Year
The average sold property price by year was:
| Year | Average Sold Price | Price Change |
Sold Properties
|
|---|---|---|---|
| 2025 | £341,271 | 6% |
26 Properties |
| 2024 | £320,380 | -23% |
42 Properties |
| 2023 | £393,550 | 13% |
30 Properties |
| 2022 | £341,337 | 5% |
47 Properties |
| 2021 | £324,091 | 6% |
56 Properties |
| 2020 | £304,303 | 4% |
33 Properties |
| 2019 | £291,303 | -11% |
42 Properties |
| 2018 | £322,175 | 13% |
58 Properties |
| 2017 | £280,408 | 5% |
35 Properties |
| 2016 | £265,429 | -14% |
43 Properties |
| 2015 | £301,977 | 11% |
65 Properties |
| 2014 | £267,990 | 21% |
68 Properties |
| 2013 | £211,144 | -12% |
45 Properties |
| 2012 | £236,272 | -2% |
22 Properties |
| 2011 | £241,886 | 4% |
30 Properties |
| 2010 | £231,142 | 15% |
33 Properties |
| 2009 | £195,511 | -17% |
21 Properties |
| 2008 | £227,776 | 2% |
17 Properties |
| 2007 | £223,140 | -25% |
46 Properties |
| 2006 | £279,170 | 26% |
51 Properties |
| 2005 | £205,528 | -8% |
30 Properties |
| 2004 | £221,545 | 15% |
43 Properties |
| 2003 | £187,428 | 15% |
50 Properties |
| 2002 | £160,146 | 20% |
59 Properties |
| 2001 | £128,411 | -17% |
56 Properties |
| 2000 | £149,759 | 25% |
51 Properties |
| 1999 | £113,020 | 27% |
56 Properties |
| 1998 | £82,069 | -10% |
49 Properties |
| 1997 | £90,666 | 19% |
36 Properties |
| 1996 | £73,689 | 10% |
41 Properties |
| 1995 | £66,524 | - |
38 Properties |
Property Price per Property Type in Bretforton And Offenham
Here you can find historic sold price data in order to help with your property search.
The average Property Paid Price for specific property types in the last three years are:
| Property Type | Average Sold Price | Sold Properties |
|---|---|---|
| Semi Detached House | £296,055.00 | 37 Semi Detached Houses |
| Detached House | £445,987.00 | 41 Detached Houses |
| Terraced House | £255,222.00 | 18 Terraced Houses |
| Flat | £151,000.00 | 2 Flats |

