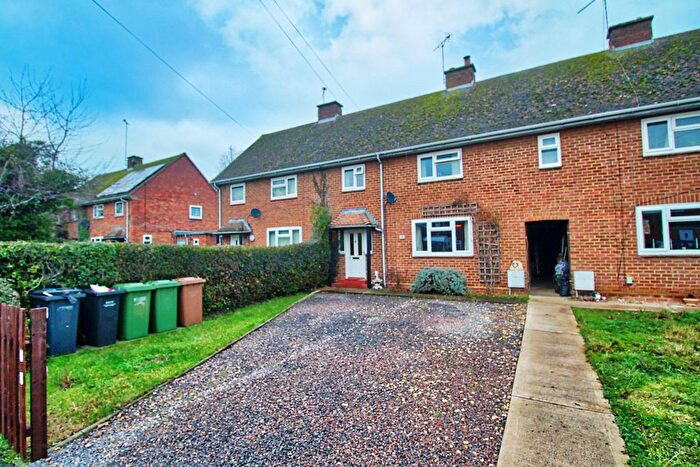
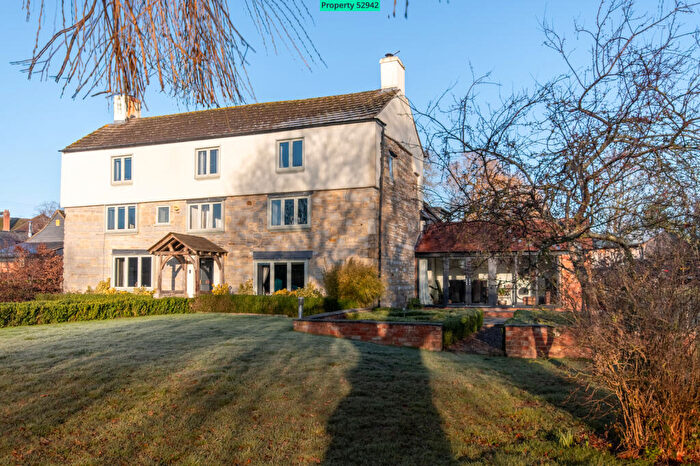
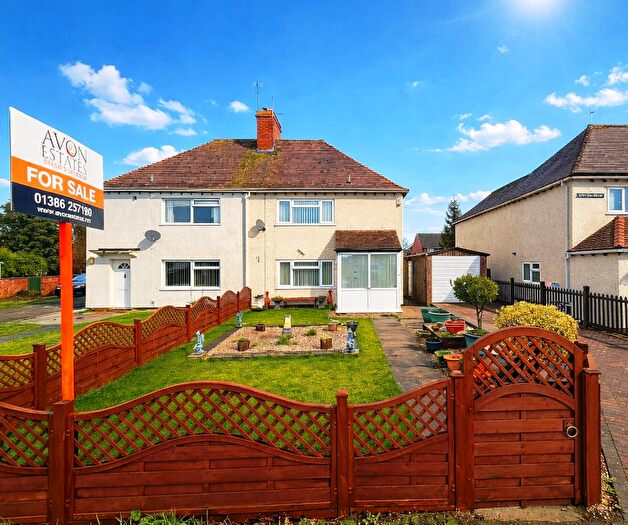
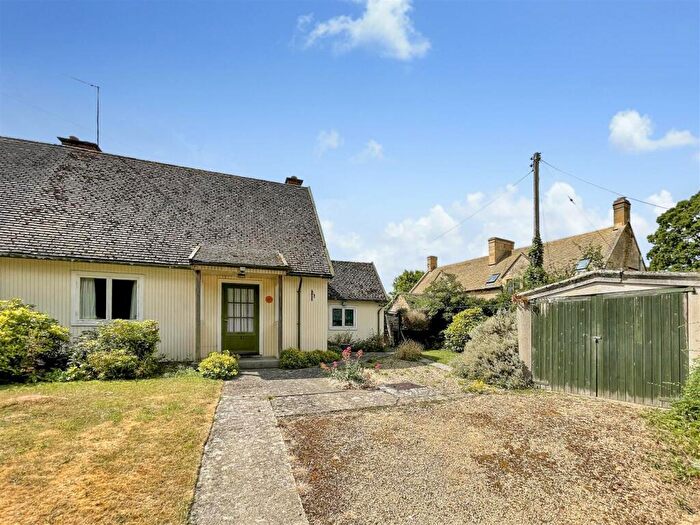
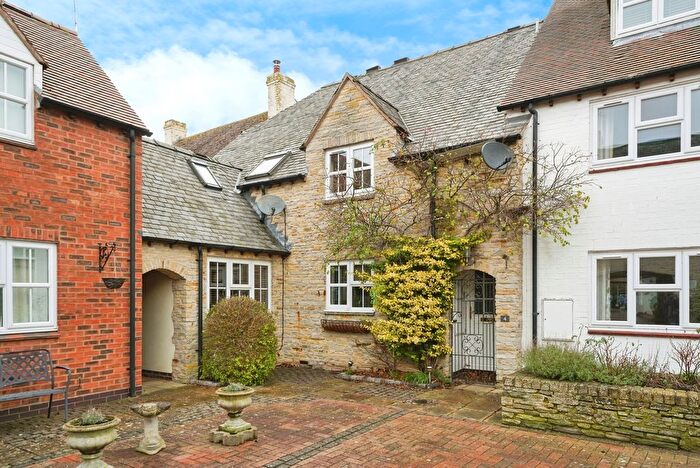
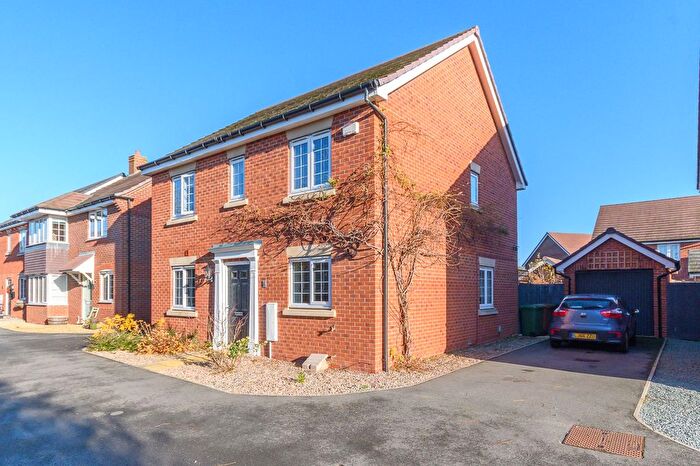
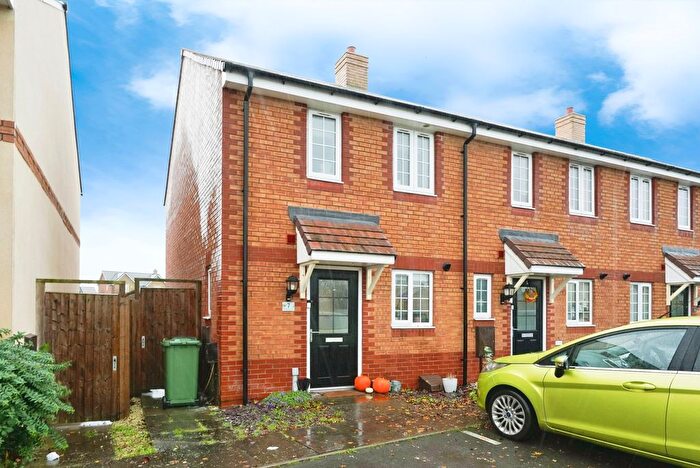
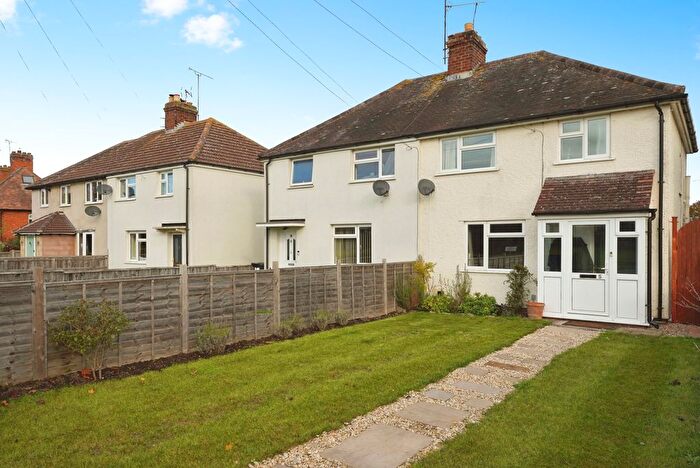
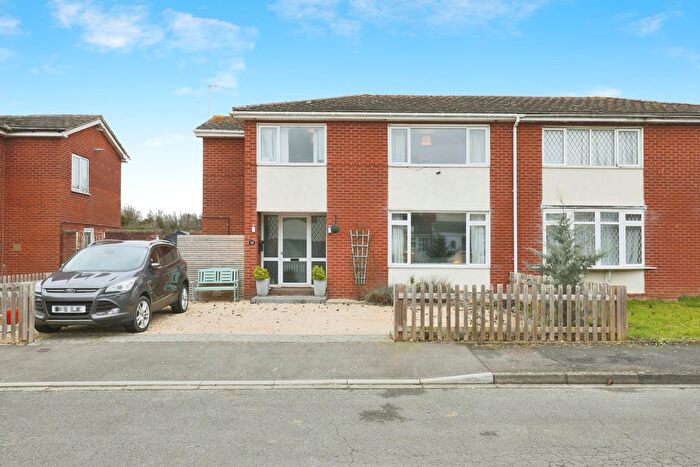
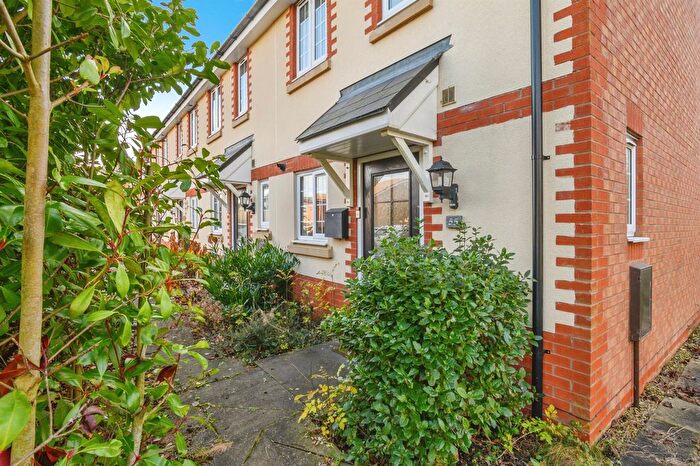
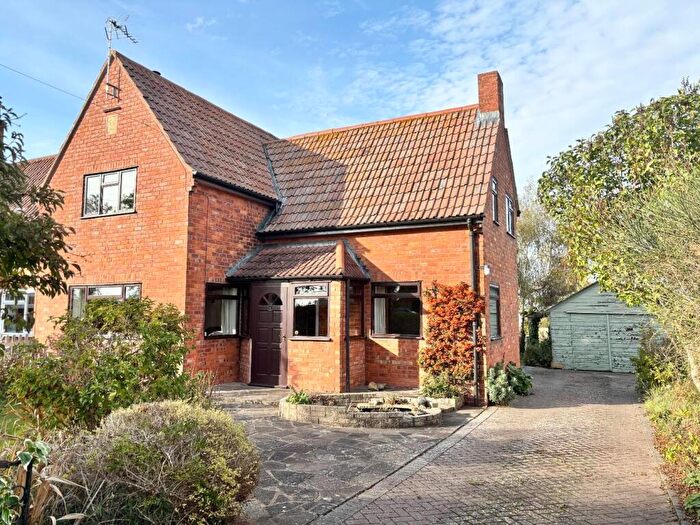
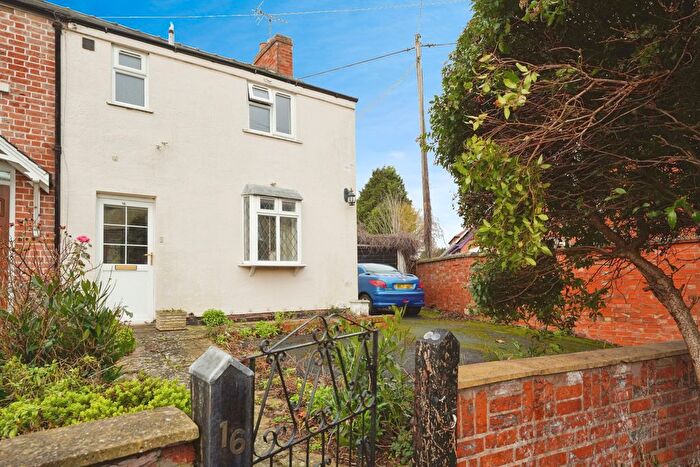
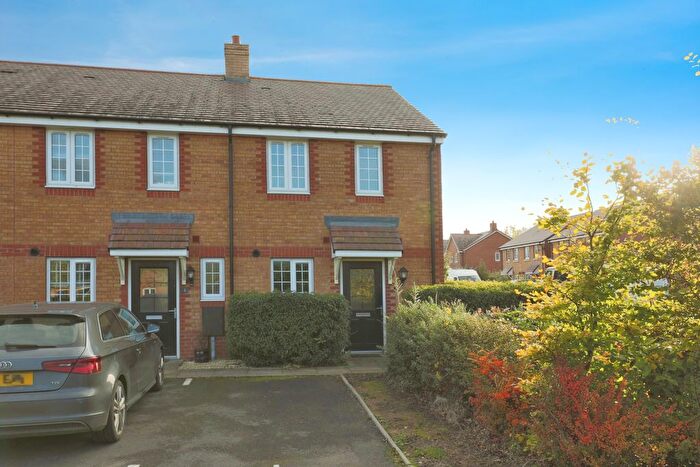
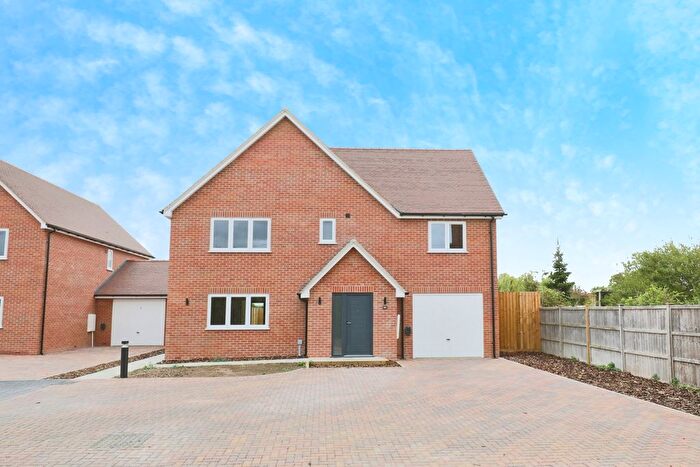
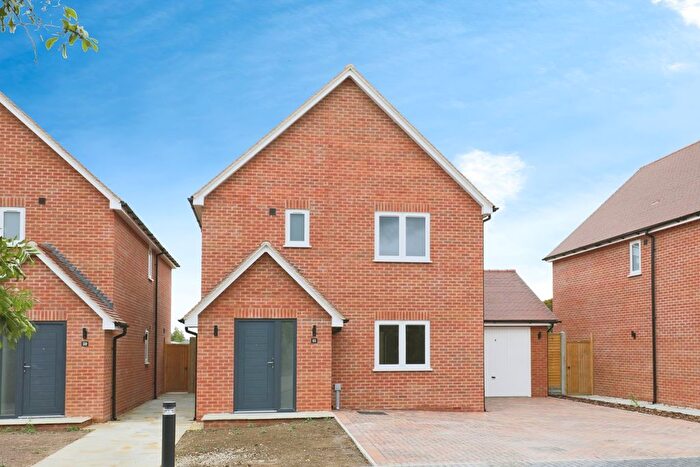
Houses for sale & to rent in Honeybourne And Pebworth, Evesham
House Prices in Honeybourne And Pebworth
Properties in Honeybourne And Pebworth have an average house price of £370,679.00 and had 74 Property Transactions within the last 3 years¹.
Honeybourne And Pebworth is an area in Evesham, Worcestershire with 712 households², where the most expensive property was sold for £995,000.00.
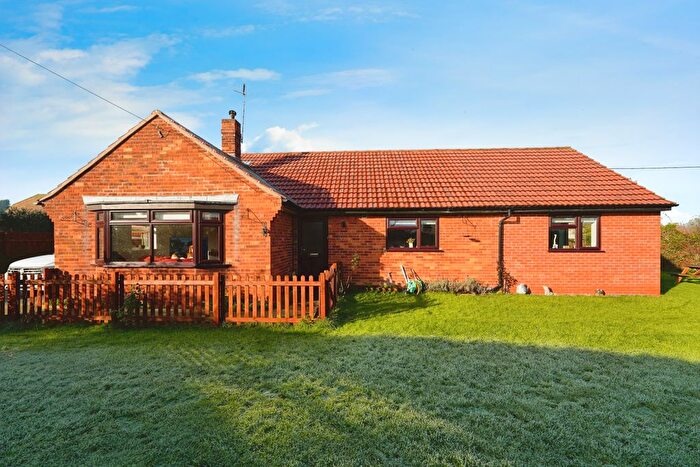
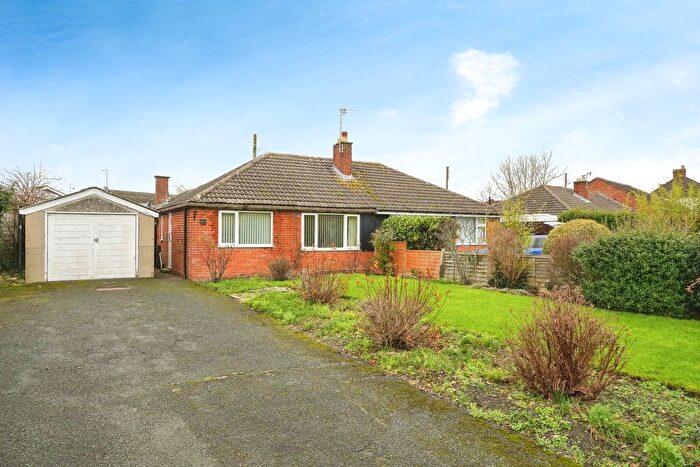
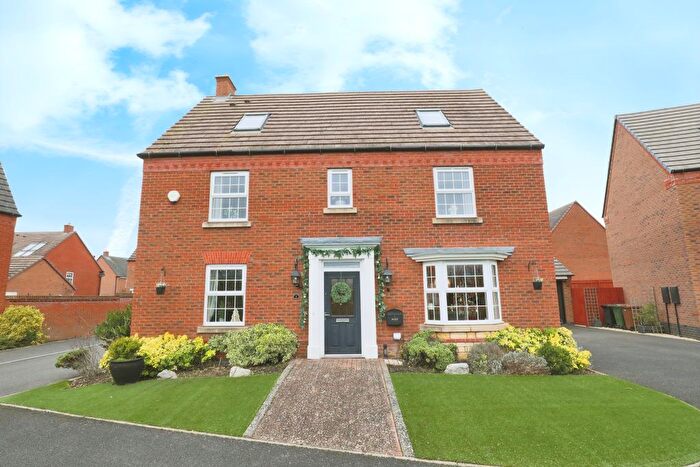
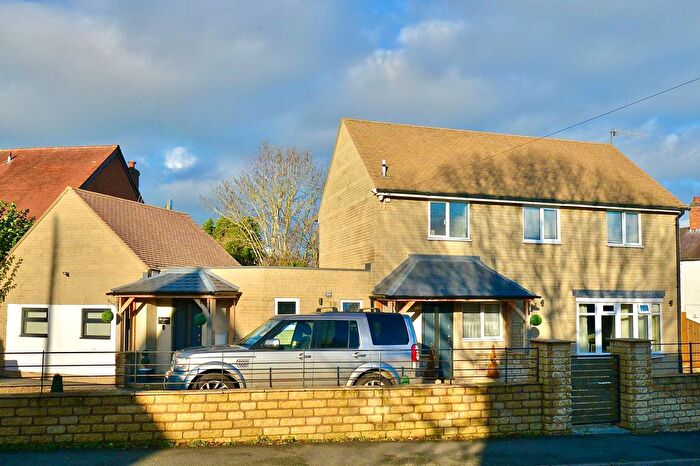
Properties for sale in Honeybourne And Pebworth
Previously listed properties in Honeybourne And Pebworth
Roads and Postcodes in Honeybourne And Pebworth
Navigate through our locations to find the location of your next house in Honeybourne And Pebworth, Evesham for sale or to rent.
| Streets | Postcodes |
|---|---|
| Baldwyn Court | WR11 7DG |
| Beaufort End | WR11 7GD |
| Birch Grove | WR11 7AF |
| Bretforton Road | WR11 7PE |
| Brickwalk | WR11 7PX |
| Brickworks Trading Estate | WR11 8QE |
| Brunel Way | WR11 7GJ |
| Buckle Street | WR11 8PH WR11 8QQ WR11 7QH |
| Chestnut Walk | WR11 7AJ |
| China Corner | WR11 7PH |
| Churchward Close | WR11 7GN |
| Clun Forest Way | WR11 7AP |
| Corner Farm Drive | WR11 7RA |
| Dudley Road | WR11 7QY WR11 7XP WR11 7XR |
| Fallow Field | WR11 7TE |
| Fernihough Avenue | WR11 7XS |
| Gloster Ades Road | WR11 7PD |
| Gooch Close | WR11 7GL |
| Grange Farm Drive | WR11 7RD |
| Green Close | WR11 7PF |
| Grove Avenue | WR11 7PW |
| Harvard Avenue | WR11 7XU |
| Harvest Close | WR11 7RH |
| Hawthorn Close | WR11 7AH |
| Herdwick Drive | WR11 7AN |
| High Street | WR11 7PQ |
| Honeybourne Airfield Trading Estate | WR11 7QF |
| Hudson Close | WR11 7GB |
| Manor Close | WR11 7RB |
| Meadow Walk | WR11 7AG |
| Mickleton Road | WR11 7PN WR11 7PS |
| Pebworth Road | WR11 8QG |
| Perrie Drive | WR11 7XT |
| Reades Piece | WR11 7GA |
| School Street | WR11 7PJ WR11 7PL |
| Shepherds Walk | WR11 7AL |
| St Ecgwins Gardens | WR11 7AT |
| Station Road | WR11 7QG WR11 7PR WR11 7QZ |
| Stephenson Way | WR11 7GH |
| Stratford Road | WR11 7PP WR11 8PR |
| Sycamore Drive | WR11 7AE |
| The Green | WR11 7PG |
| Westbourne | WR11 7PT |
| Weston Road | WR11 7QA WR11 7QJ WR11 7QL WR11 7PY |
| WR11 8QH WR11 8QJ |
Transport near Honeybourne And Pebworth
-
Honeybourne Station
-
Evesham Station
-
Stratford-Upon-Avon Station
-
Stratford Pkway Station
-
Moreton-In-Marsh Station
-
Wilmcote Station
- FAQ
- Price Paid By Year
- Property Type Price
Frequently asked questions about Honeybourne And Pebworth
What is the average price for a property for sale in Honeybourne And Pebworth?
The average price for a property for sale in Honeybourne And Pebworth is £370,679. This amount is 15% higher than the average price in Evesham. There are 248 property listings for sale in Honeybourne And Pebworth.
What streets have the most expensive properties for sale in Honeybourne And Pebworth?
The streets with the most expensive properties for sale in Honeybourne And Pebworth are Pebworth Road at an average of £995,000, Sycamore Drive at an average of £485,000 and Weston Road at an average of £478,333.
What streets have the most affordable properties for sale in Honeybourne And Pebworth?
The streets with the most affordable properties for sale in Honeybourne And Pebworth are China Corner at an average of £247,500, Fallow Field at an average of £259,607 and Bretforton Road at an average of £265,000.
Which train stations are available in or near Honeybourne And Pebworth?
Some of the train stations available in or near Honeybourne And Pebworth are Honeybourne, Evesham and Stratford-Upon-Avon.
Property Price Paid in Honeybourne And Pebworth by Year
The average sold property price by year was:
| Year | Average Sold Price | Price Change |
Sold Properties
|
|---|---|---|---|
| 2025 | £387,250 | -17% |
22 Properties |
| 2024 | £451,909 | 30% |
18 Properties |
| 2023 | £316,952 | -9% |
34 Properties |
| 2022 | £344,430 | 14% |
31 Properties |
| 2021 | £297,306 | -27% |
33 Properties |
| 2020 | £378,540 | 22% |
36 Properties |
| 2019 | £295,741 | -29% |
31 Properties |
| 2018 | £380,757 | 16% |
27 Properties |
| 2017 | £320,639 | 12% |
38 Properties |
| 2016 | £282,141 | -9% |
97 Properties |
| 2015 | £306,353 | 15% |
62 Properties |
| 2014 | £261,334 | -14% |
41 Properties |
| 2013 | £297,227 | 28% |
18 Properties |
| 2012 | £212,611 | -21% |
21 Properties |
| 2011 | £256,830 | 1% |
18 Properties |
| 2010 | £253,648 | 20% |
27 Properties |
| 2009 | £203,765 | -34% |
16 Properties |
| 2008 | £273,609 | 8% |
11 Properties |
| 2007 | £252,184 | 8% |
32 Properties |
| 2006 | £231,322 | 16% |
31 Properties |
| 2005 | £193,811 | -1% |
27 Properties |
| 2004 | £196,639 | 9% |
32 Properties |
| 2003 | £178,537 | -2% |
31 Properties |
| 2002 | £181,412 | 18% |
41 Properties |
| 2001 | £148,002 | -2% |
60 Properties |
| 2000 | £150,692 | 33% |
55 Properties |
| 1999 | £101,209 | - |
22 Properties |
| 1998 | £101,217 | 27% |
29 Properties |
| 1997 | £73,938 | -12% |
31 Properties |
| 1996 | £83,080 | 3% |
33 Properties |
| 1995 | £80,732 | - |
28 Properties |
Property Price per Property Type in Honeybourne And Pebworth
Here you can find historic sold price data in order to help with your property search.
The average Property Paid Price for specific property types in the last three years are:
| Property Type | Average Sold Price | Sold Properties |
|---|---|---|
| Semi Detached House | £283,796.00 | 27 Semi Detached Houses |
| Detached House | £510,689.00 | 29 Detached Houses |
| Terraced House | £275,430.00 | 18 Terraced Houses |

