
Houses for sale & to rent in Aberdeen, Aberdeen City
House Prices in Aberdeen
Properties in Aberdeen have an average house price of £151k and had 6,773 Property Transactions within the last 3 years.¹
Aberdeen is an area in Aberdeen City with 99,965 households², where the most expensive property was sold for £1.03M.
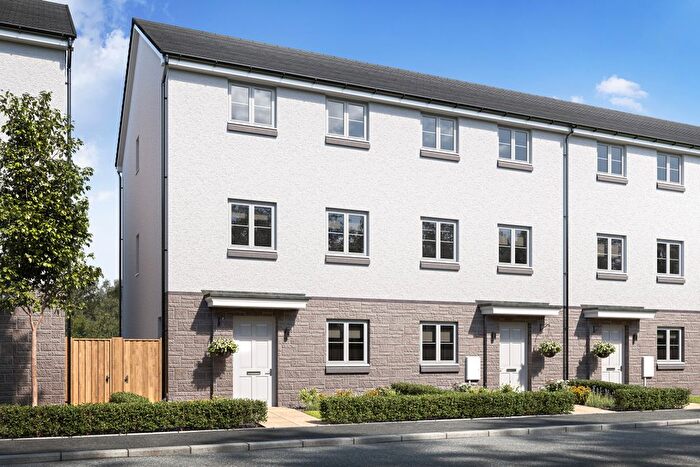
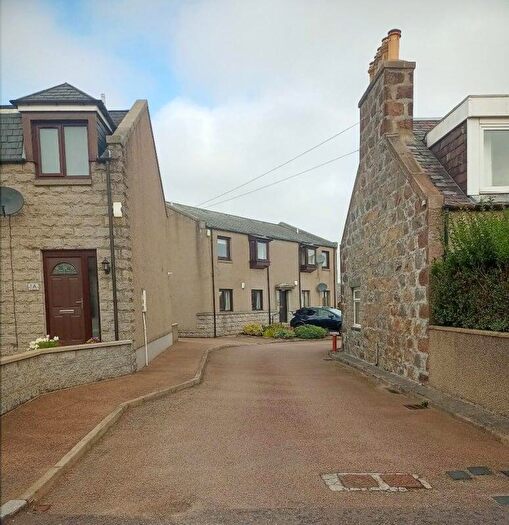
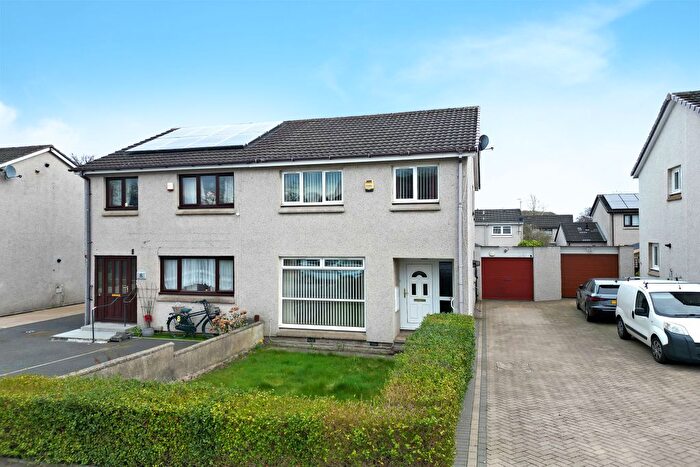
Properties for sale in Aberdeen
![]()
If you are looking to sell your house, let it out, or receive a property valuation, an expert can help you.
Click the button below to get started.
Neighbourhoods in Aberdeen
Navigate through our locations to find the location of your next house in Aberdeen, Aberdeen City for sale or to rent.
- George St/Harbour
- Midstocket/Rosemount
- Hazlehead/Queens Cross/Countesswells
- Kincorth/Nigg/Cove
- Torry/Ferryhill
- Airyhall/Broomhill/Garthdee
- Kingswells/Sheddocksley/Summerhill
- Lower Deeside
- Dyce/Bucksburn/Danestone
- Hilton/Woodside/Stockethill
- Northfield/Mastrick North
- Bridge of Don
- Tillydrone/Seaton/Old Aberdeen
Transport in Aberdeen
Please see below transportation links in this area:

- FAQ
- Price Paid By Year
Frequently asked questions about Aberdeen
What is the average price for a property for sale in Aberdeen?
The average price for a property for sale in Aberdeen is £151,283. This amount is 1% lower than the average price in Aberdeen City. There are 4,619 property listings for sale in Aberdeen.
What locations have the most expensive properties for sale in Aberdeen?
The locations with the most expensive properties for sale in Aberdeen are Lower Deeside at an average of £298,164, Hazlehead/Queens Cross/Countesswells at an average of £233,978 and Kingswells/Sheddocksley/Summerhill at an average of £186,310.
What locations have the most affordable properties for sale in Aberdeen?
The locations with the most affordable properties for sale in Aberdeen are George St/Harbour at an average of £84,311, Tillydrone/Seaton/Old Aberdeen at an average of £102,589 and Torry/Ferryhill at an average of £112,952.
Which train stations are available in or near Aberdeen?
Some of the train stations available in or near Aberdeen are Aberdeen, Dyce and Portlethen.
Property Price Paid in Aberdeen by Year
The average sold property price by year was:
| Year | Average Sold Price | Price Change |
Sold Properties
|
|---|---|---|---|
| 2025 | £148,915 | -2% |
2,401 Properties |
| 2024 | £152,398 | -0,2% |
2,060 Properties |
| 2023 | £152,750 | -16% |
2,312 Properties |
| 2022 | £177,271 | -6% |
4,503 Properties |
| 2021 | £187,382 | 2% |
4,623 Properties |
| 2020 | £182,973 | -4% |
3,142 Properties |
| 2019 | £190,421 | -1% |
3,854 Properties |
| 2018 | £192,132 | -2% |
3,797 Properties |
| 2017 | £196,040 | -2% |
3,889 Properties |
| 2016 | £200,898 | -10% |
3,997 Properties |
| 2015 | £221,269 | 2% |
5,053 Properties |
| 2014 | £215,997 | 7% |
5,355 Properties |
| 2013 | £200,108 | 5% |
5,594 Properties |
| 2012 | £190,208 | 2% |
4,648 Properties |
| 2011 | £186,355 | -4% |
4,146 Properties |
| 2010 | £193,897 | 12% |
4,299 Properties |
| 2009 | £170,943 | -5% |
4,216 Properties |
| 2008 | £179,970 | 1% |
5,243 Properties |
| 2007 | £178,479 | -55% |
6,721 Properties |
| 2006 | £276,935 | 58% |
7,135 Properties |
| 2005 | £117,415 | 8% |
7,173 Properties |
| 2004 | £107,886 | 16% |
6,774 Properties |
| 2003 | £90,860 | 4% |
6,635 Properties |
| 2002 | £87,092 | -54% |
6,860 Properties |
| 2001 | £133,987 | 29% |
449 Properties |
| 2000 | £95,000 | - |
1 Property |