
Houses for sale & to rent in Alford, Aberdeenshire
House Prices in Alford
Properties in Alford have an average house price of £234k and had 107 Property Transactions within the last 3 years.¹
Alford is an area in Aberdeenshire with 2,180 households², where the most expensive property was sold for £700k.
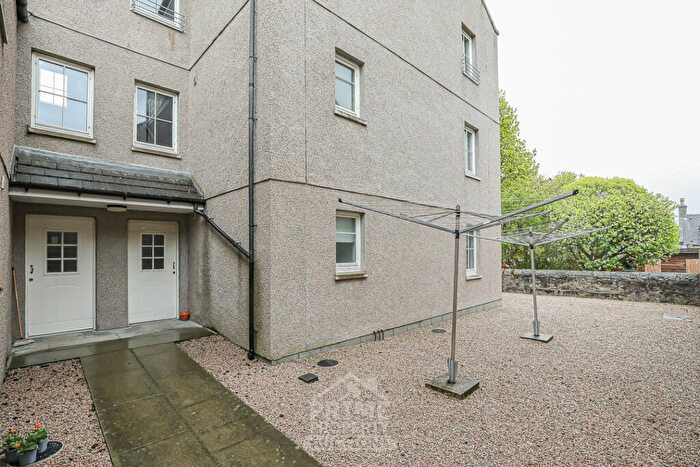
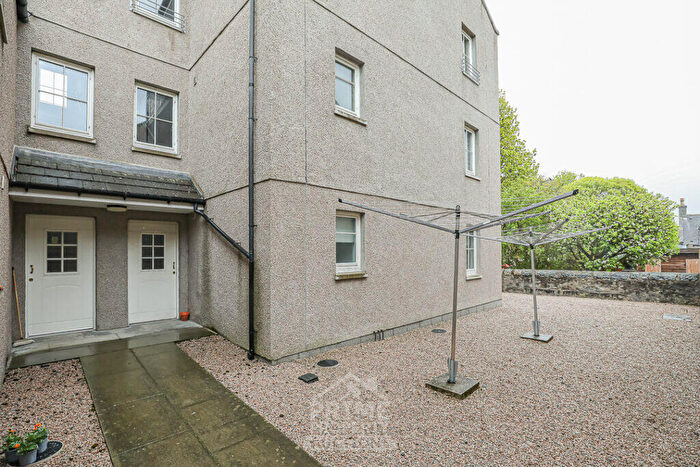
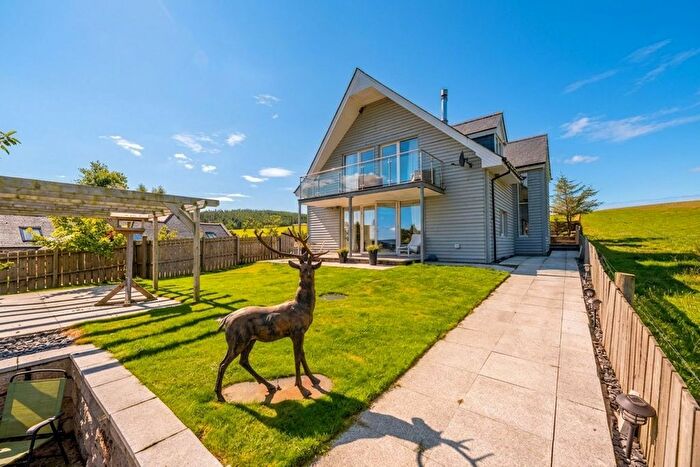
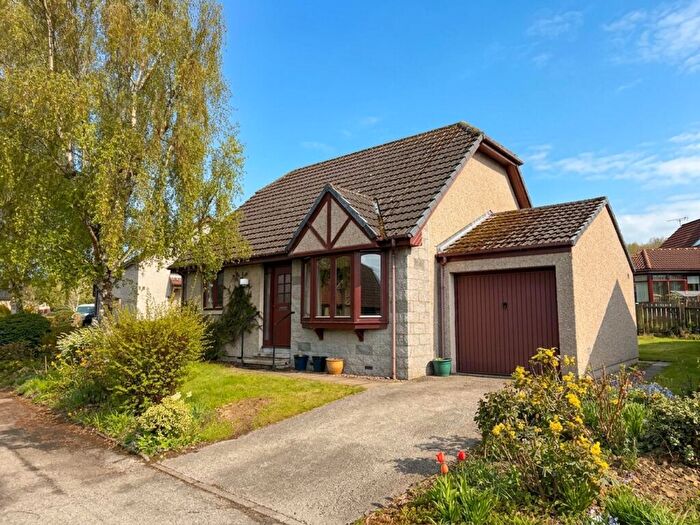
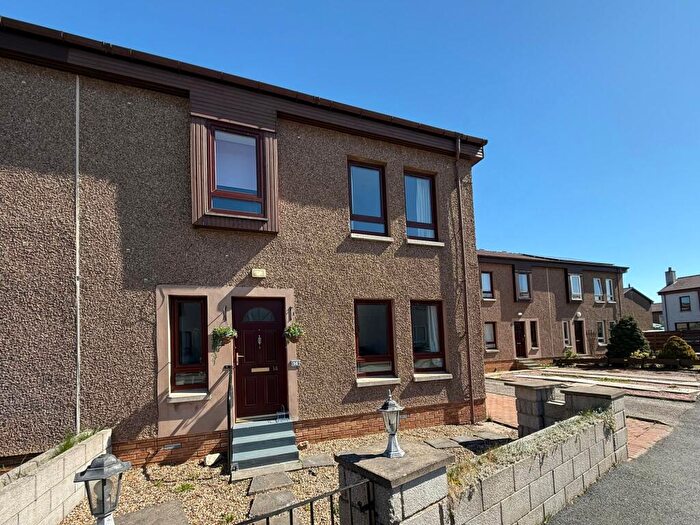
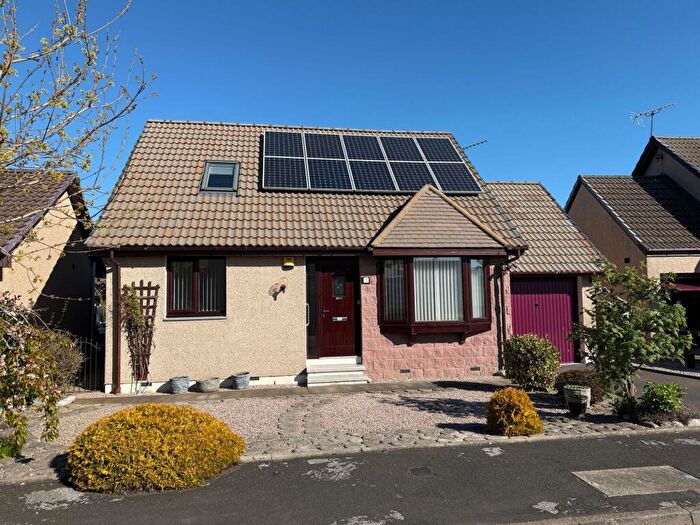
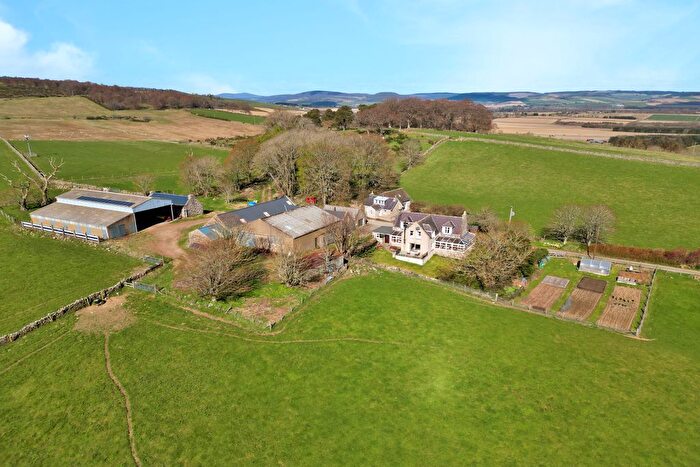
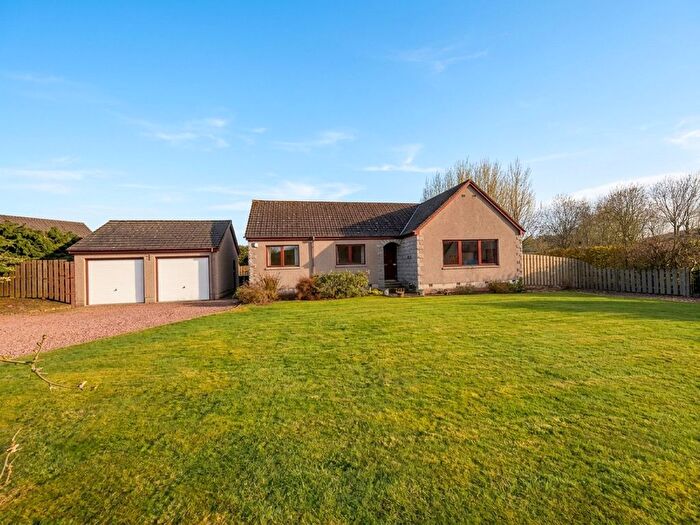
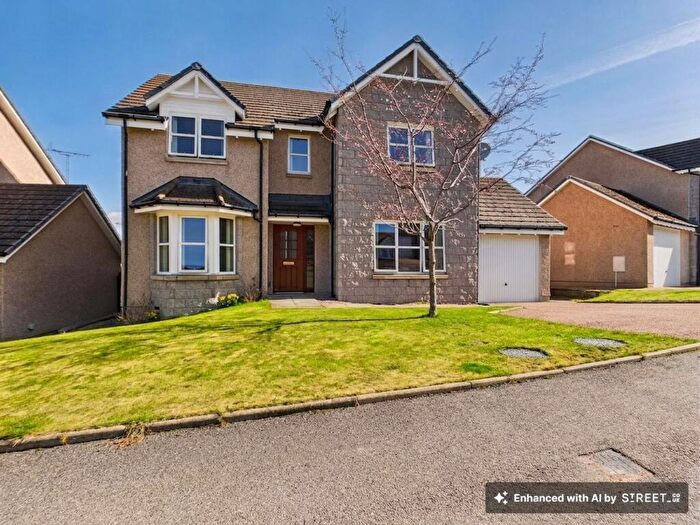
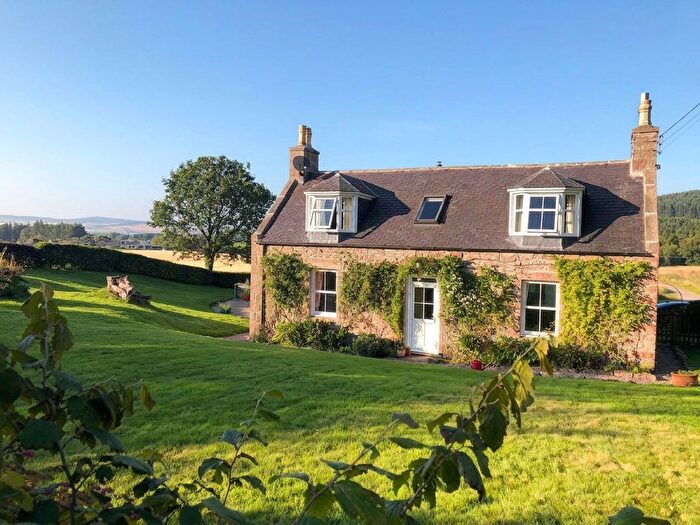
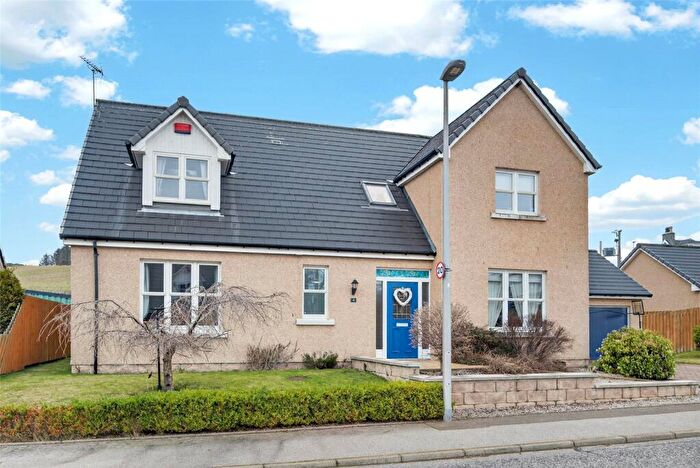
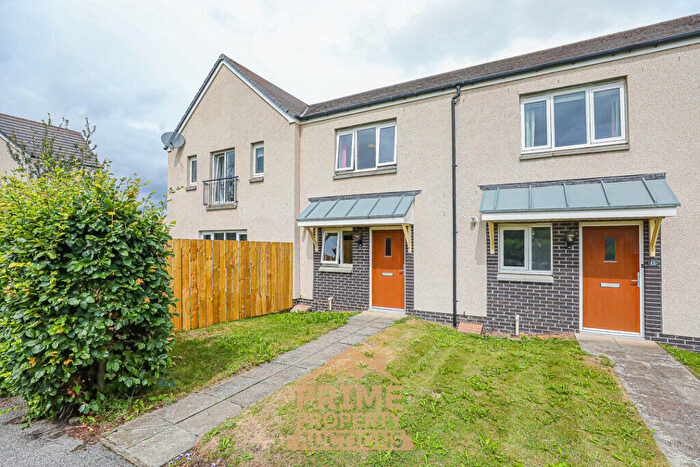
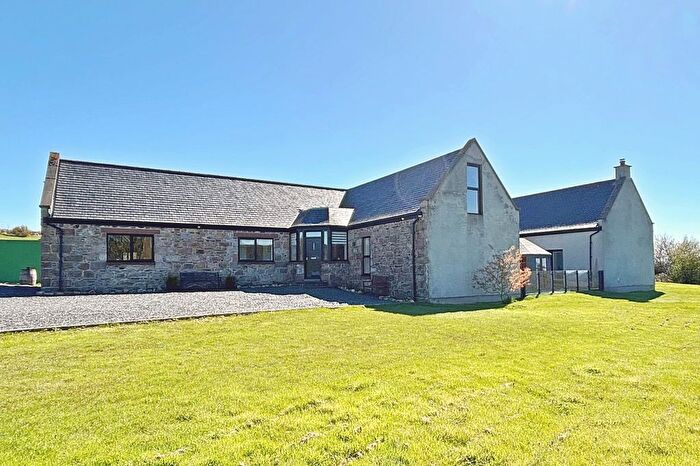
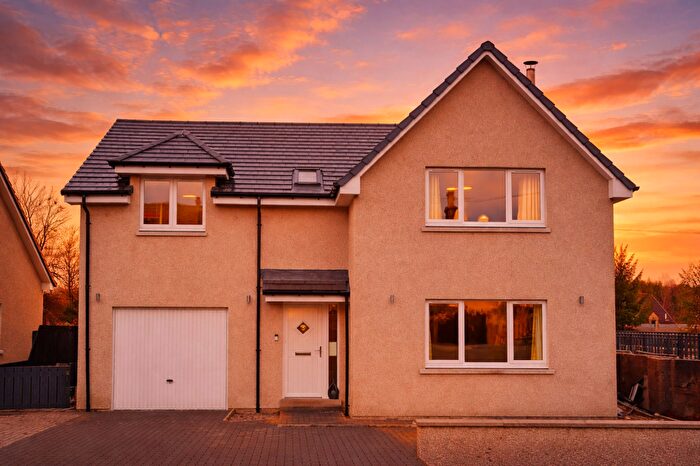
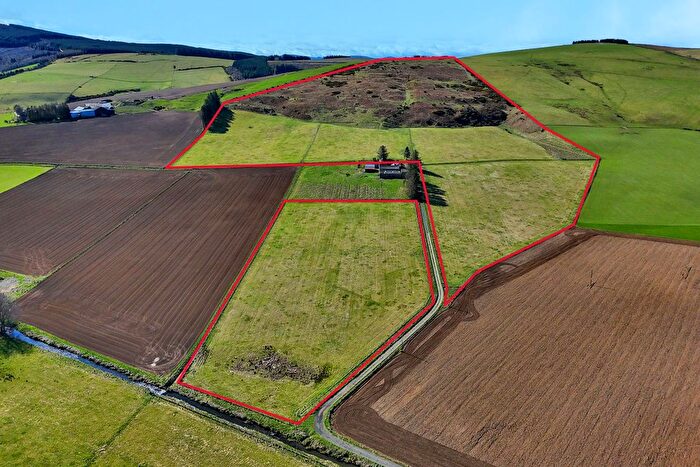
Properties for sale in Alford

![]()
If you are looking to sell your house, let it out, or receive a property valuation, an expert can help you.
Click the button below to get started.
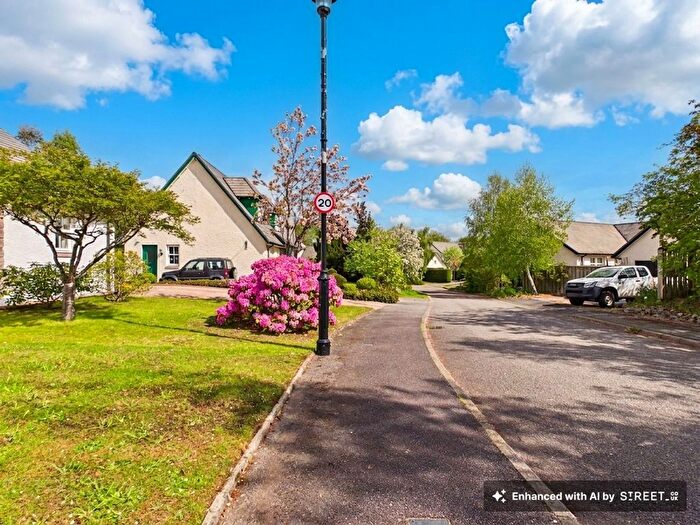


Neighbourhoods in Alford
Navigate through our locations to find the location of your next house in Alford, Aberdeenshire for sale or to rent.
Transport in Alford
Please see below transportation links in this area:

- FAQ
- Price Paid By Year
Frequently asked questions about Alford
What is the average price for a property for sale in Alford?
The average price for a property for sale in Alford is £233,865. This amount is 17% higher than the average price in Aberdeenshire. There are 524 property listings for sale in Alford.
What locations have the most expensive properties for sale in Alford?
The location with the most expensive properties for sale in Alford is Aboyne, Upper Deeside and Donside at an average of £258,166.
What locations have the most affordable properties for sale in Alford?
The location with the most affordable properties for sale in Alford is Huntly, Strathbogie and Howe of Alford at an average of £232,421.
Which train stations are available in or near Alford?
Some of the train stations available in or near Alford are Insch, Inverurie and Huntly.
Property Price Paid in Alford by Year
The average sold property price by year was:
| Year | Average Sold Price | Price Change |
Sold Properties
|
|---|---|---|---|
| 2025 | £240,267 | 10% |
36 Properties |
| 2024 | £215,260 | -10% |
20 Properties |
| 2023 | £236,642 | -16% |
51 Properties |
| 2022 | £273,572 | 7% |
152 Properties |
| 2021 | £254,011 | 5% |
150 Properties |
| 2020 | £240,263 | 8% |
95 Properties |
| 2019 | £222,047 | -5% |
111 Properties |
| 2018 | £233,666 | -1% |
112 Properties |
| 2017 | £235,673 | 4% |
104 Properties |
| 2016 | £225,779 | -5% |
101 Properties |
| 2015 | £237,409 | -5% |
142 Properties |
| 2014 | £250,191 | 10% |
156 Properties |
| 2013 | £225,097 | 4% |
119 Properties |
| 2012 | £215,368 | -13% |
88 Properties |
| 2011 | £243,927 | 4% |
83 Properties |
| 2010 | £233,928 | 6% |
63 Properties |
| 2009 | £219,292 | 20% |
72 Properties |
| 2008 | £176,376 | -25% |
70 Properties |
| 2007 | £219,876 | 31% |
102 Properties |
| 2006 | £152,491 | -4% |
85 Properties |
| 2005 | £158,628 | -1% |
101 Properties |
| 2004 | £160,992 | 33% |
110 Properties |
| 2003 | £108,121 | 11% |
125 Properties |
| 2002 | £96,717 | -22% |
118 Properties |
| 2001 | £118,197 | - |
9 Properties |