
Houses for sale & to rent in Laurencekirk, Aberdeenshire
House Prices in Laurencekirk
Properties in Laurencekirk have an average house price of £233k and had 130 Property Transactions within the last 3 years.¹
Laurencekirk is an area in Aberdeenshire with 2,904 households², where the most expensive property was sold for £433k.
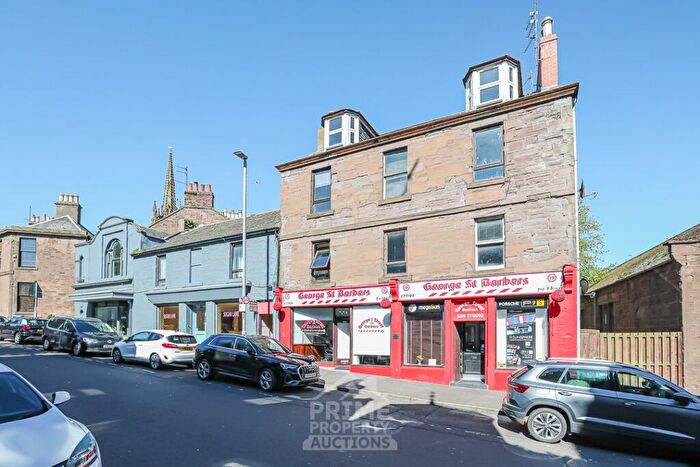
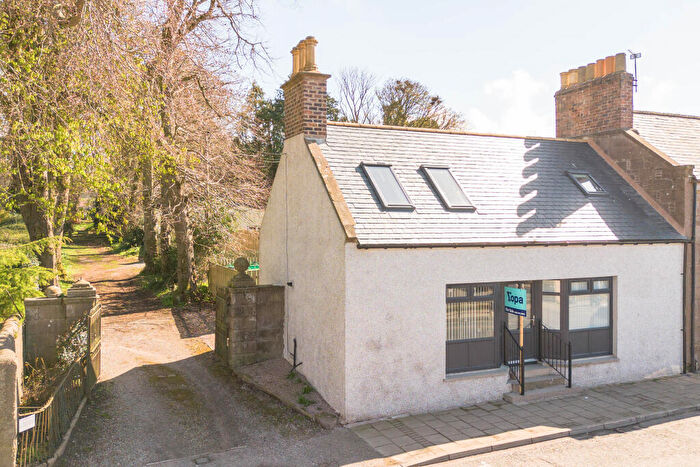
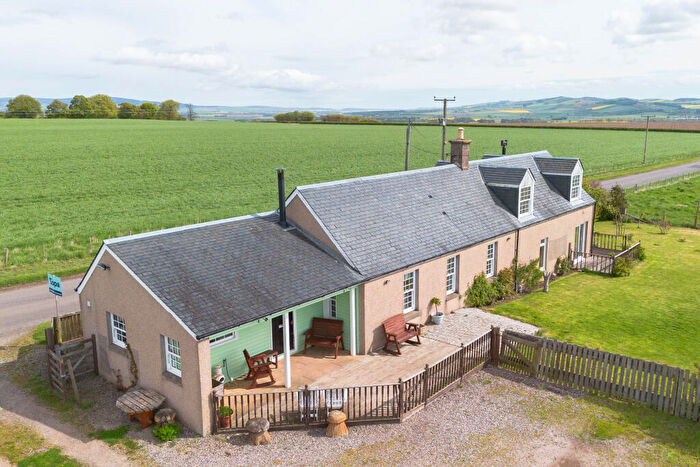
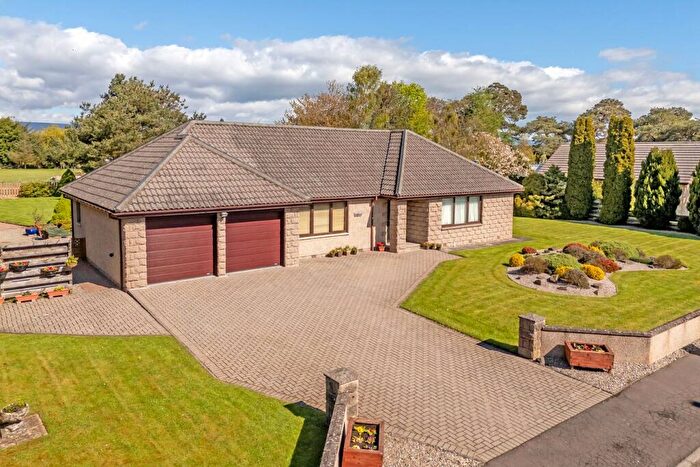
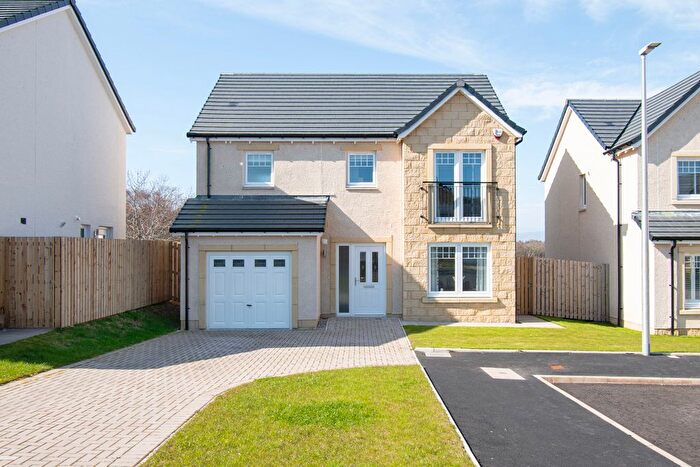
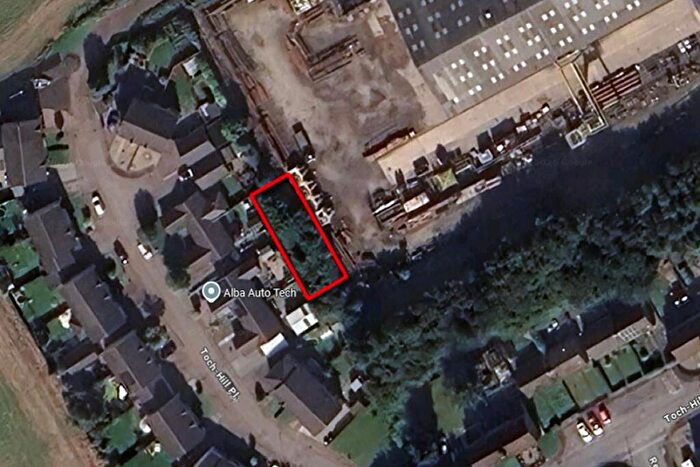
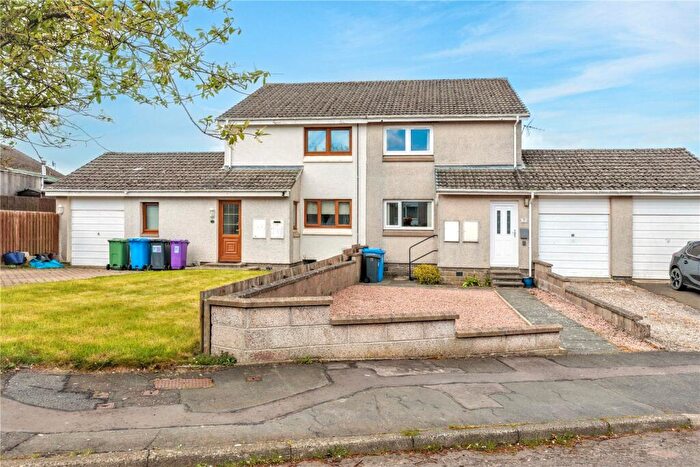
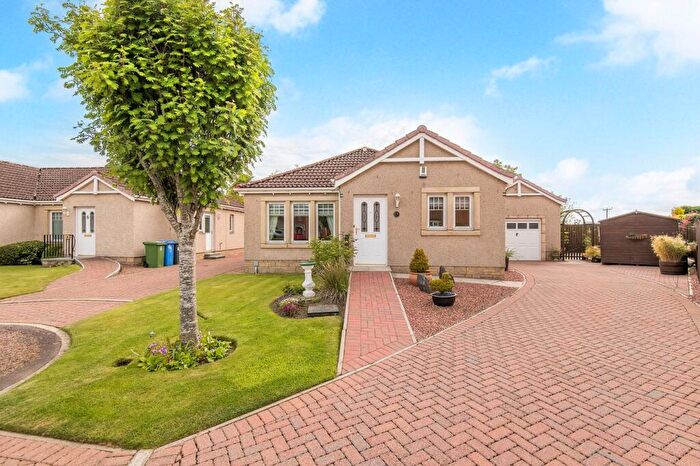
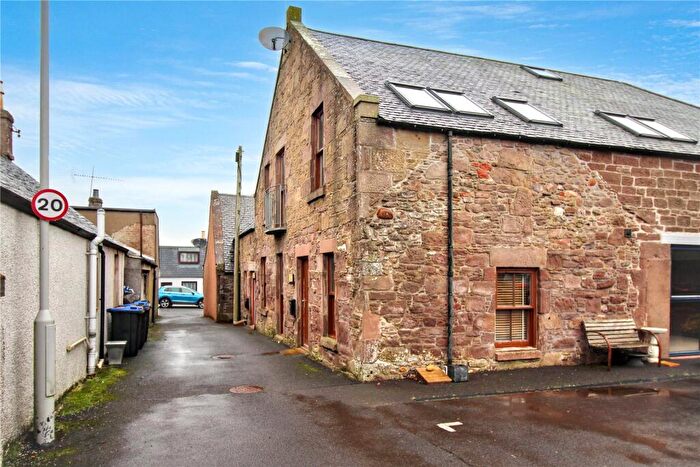
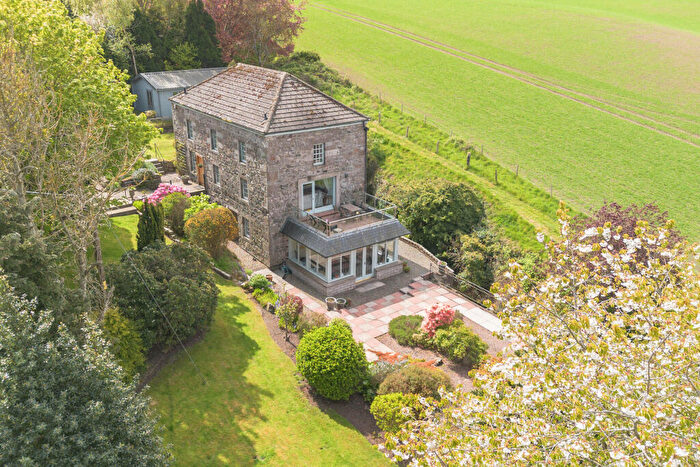
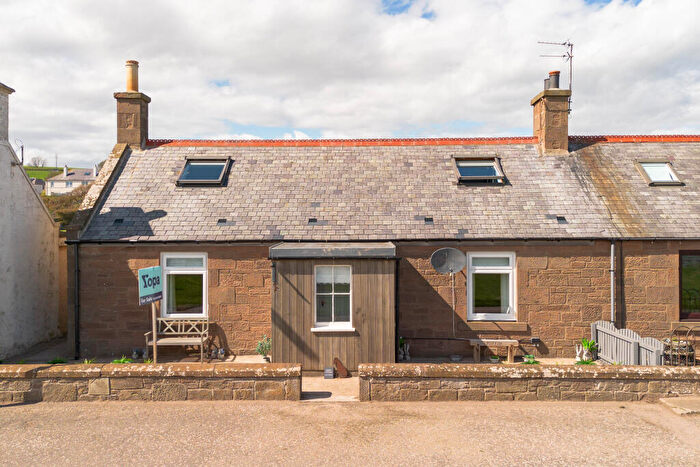
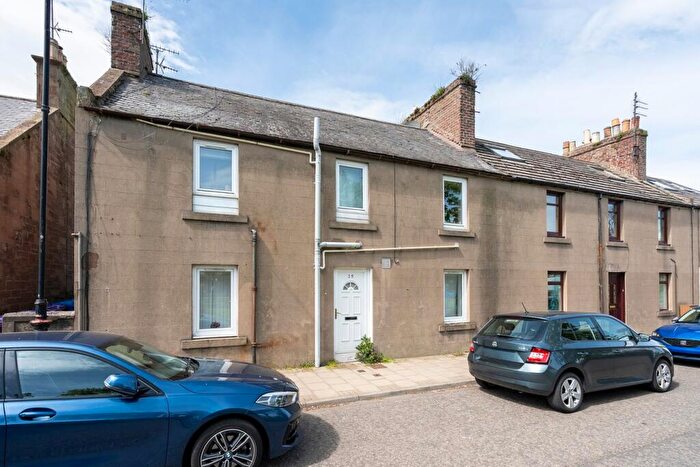
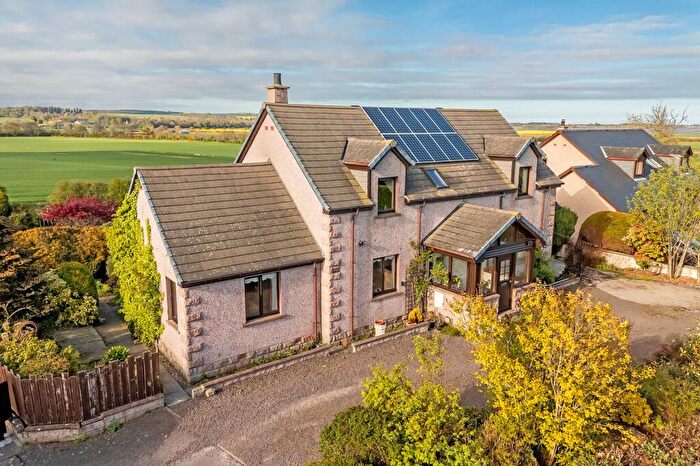
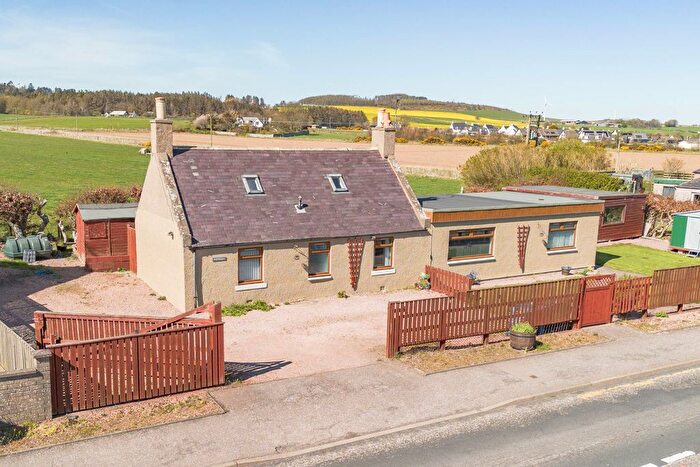
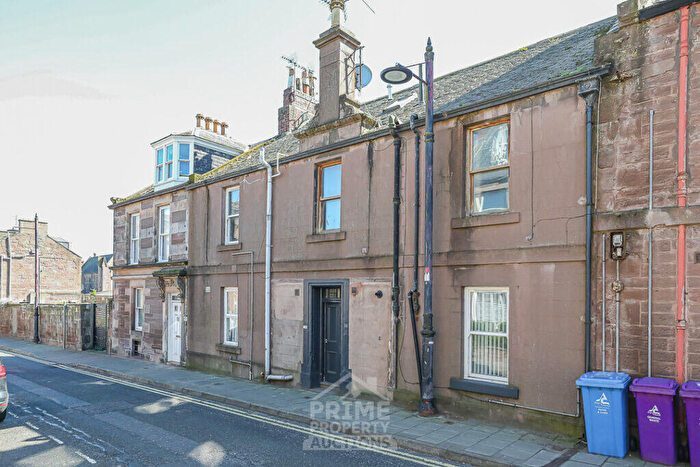
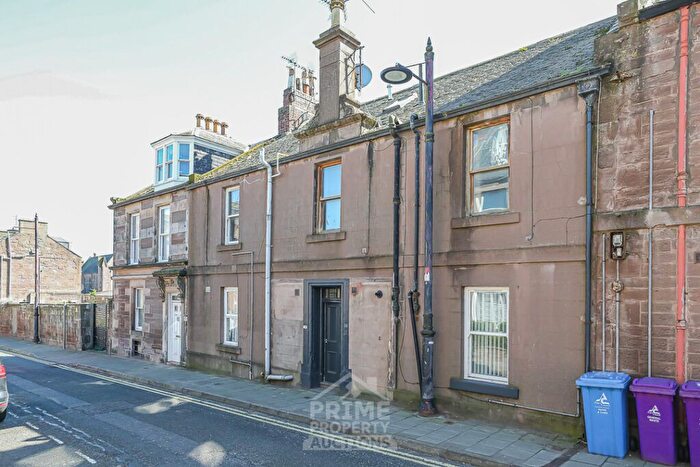
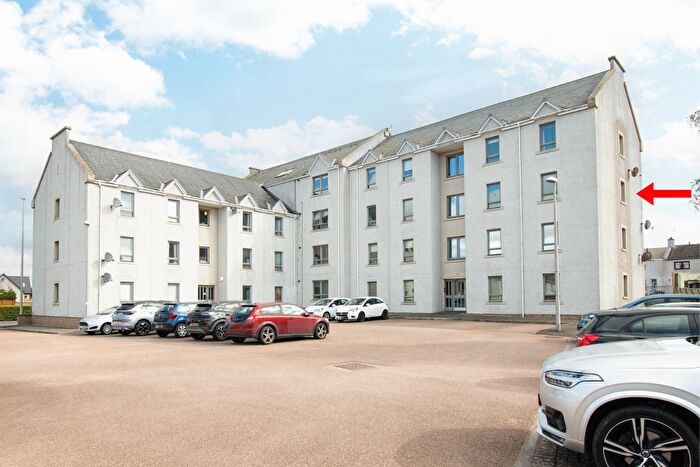
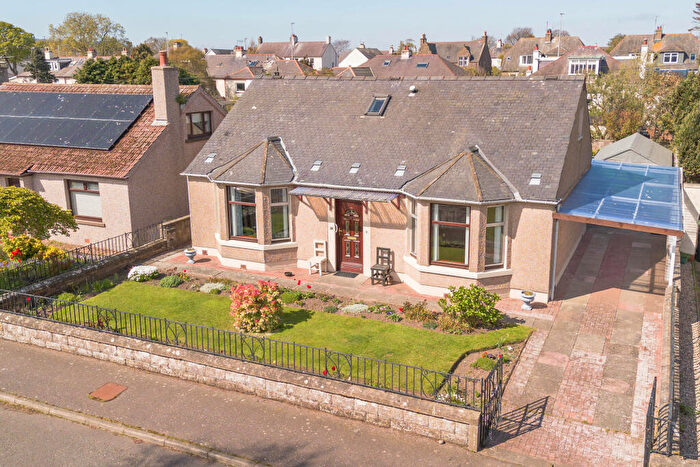
Properties for sale in Laurencekirk

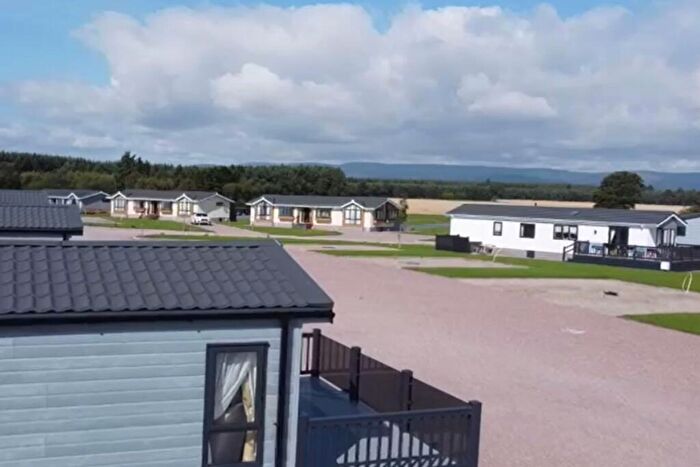
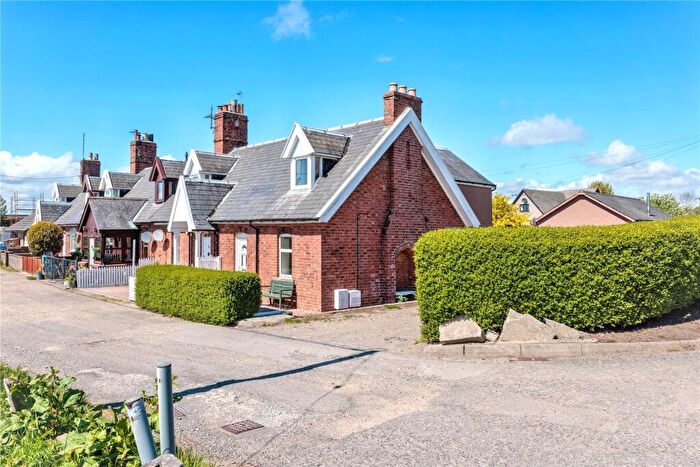
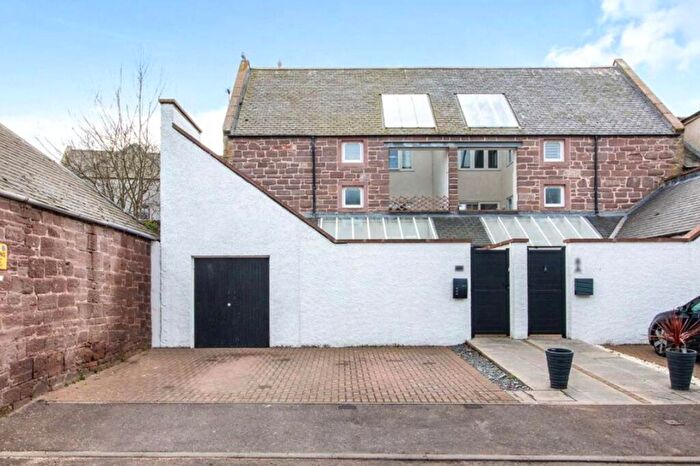
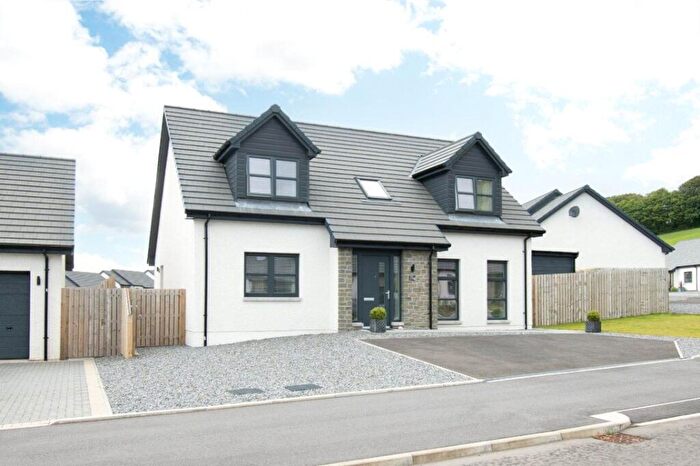
![]()
If you are looking to sell your house, let it out, or receive a property valuation, an expert can help you.
Click the button below to get started.

Neighbourhoods in Laurencekirk
Navigate through our locations to find the location of your next house in Laurencekirk, Aberdeenshire for sale or to rent.
Transport in Laurencekirk
Please see below transportation links in this area:

- FAQ
- Price Paid By Year
Frequently asked questions about Laurencekirk
What is the average price for a property for sale in Laurencekirk?
The average price for a property for sale in Laurencekirk is £233,069. This amount is 16% higher than the average price in Aberdeenshire. There are 1,766 property listings for sale in Laurencekirk.
Which train stations are available in or near Laurencekirk?
Some of the train stations available in or near Laurencekirk are Laurencekirk, Montrose and Stonehaven.
Property Price Paid in Laurencekirk by Year
The average sold property price by year was:
| Year | Average Sold Price | Price Change |
Sold Properties
|
|---|---|---|---|
| 2025 | £215,333 | -14% |
36 Properties |
| 2024 | £244,846 | 4% |
44 Properties |
| 2023 | £235,476 | -9% |
50 Properties |
| 2022 | £255,522 | 12% |
118 Properties |
| 2021 | £225,922 | 3% |
178 Properties |
| 2020 | £219,802 | 3% |
126 Properties |
| 2019 | £213,680 | -2% |
124 Properties |
| 2018 | £218,495 | 4% |
108 Properties |
| 2017 | £209,334 | -6% |
157 Properties |
| 2016 | £220,992 | -0,5% |
134 Properties |
| 2015 | £222,072 | -6% |
148 Properties |
| 2014 | £235,823 | 11% |
151 Properties |
| 2013 | £209,324 | 8% |
170 Properties |
| 2012 | £192,757 | -5% |
111 Properties |
| 2011 | £201,719 | 3% |
135 Properties |
| 2010 | £196,224 | 10% |
143 Properties |
| 2009 | £175,989 | -17% |
130 Properties |
| 2008 | £206,553 | 13% |
112 Properties |
| 2007 | £178,673 | 14% |
155 Properties |
| 2006 | £154,248 | -1% |
149 Properties |
| 2005 | £156,027 | 31% |
142 Properties |
| 2004 | £107,138 | 21% |
141 Properties |
| 2003 | £84,736 | -4% |
151 Properties |
| 2002 | £88,464 | 52% |
160 Properties |
| 2001 | £42,837 | - |
12 Properties |