
Houses for sale & to rent in Campbeltown, Argyll and Bute
House Prices in Campbeltown
Properties in Campbeltown have an average house price of £116k and had 168 Property Transactions within the last 3 years.¹
Campbeltown is an area in Argyll and Bute with 3,539 households², where the most expensive property was sold for £558k.
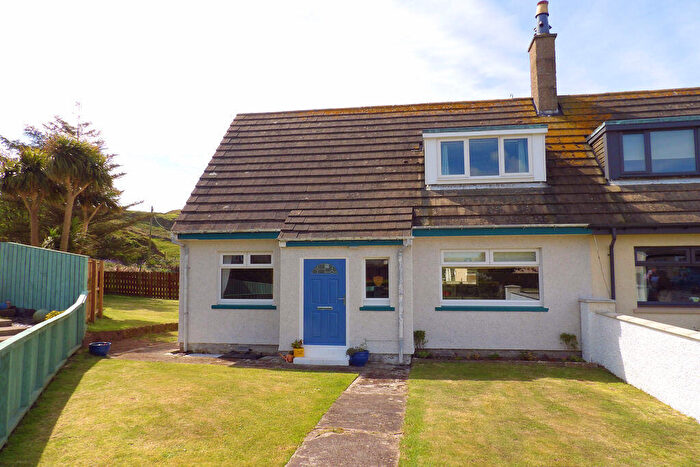
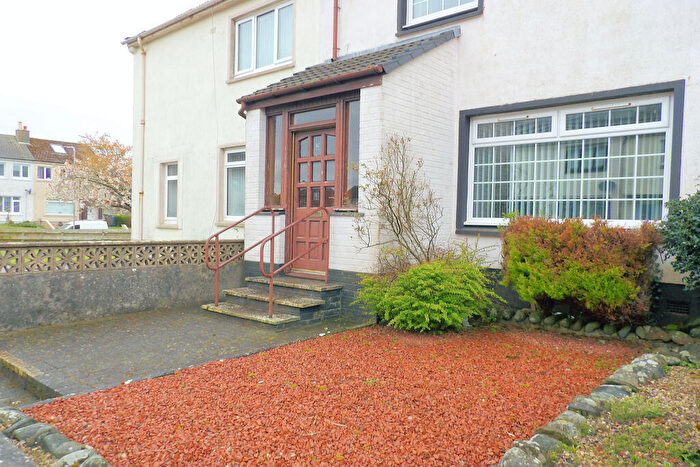
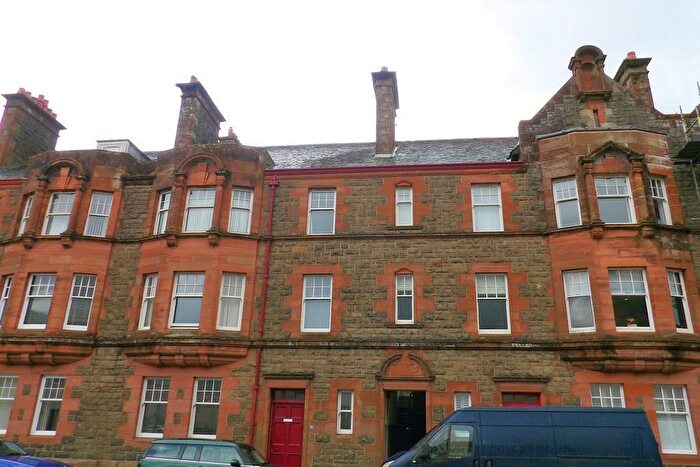
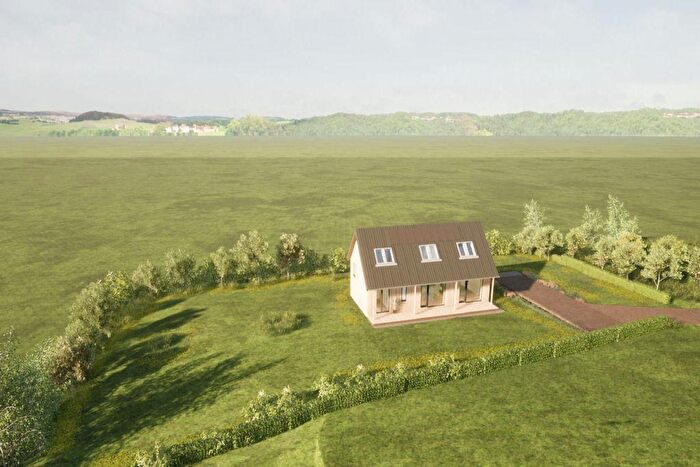
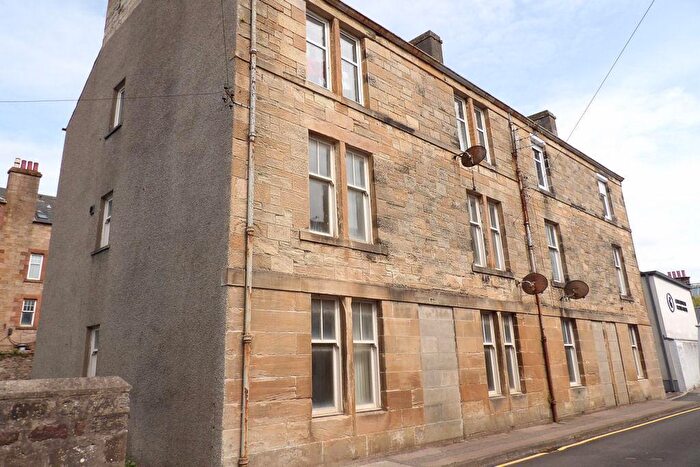
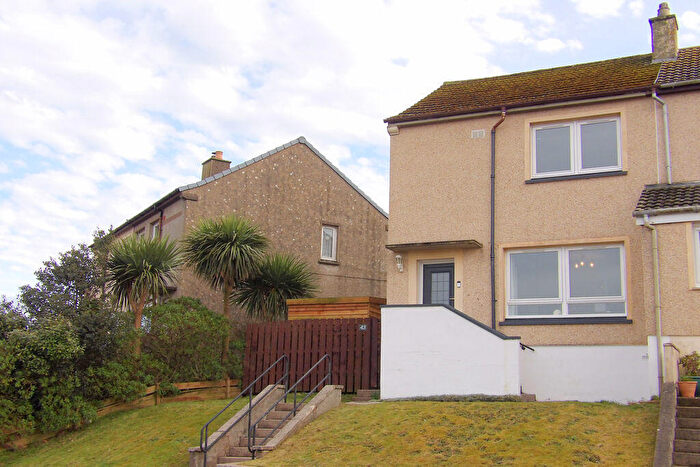
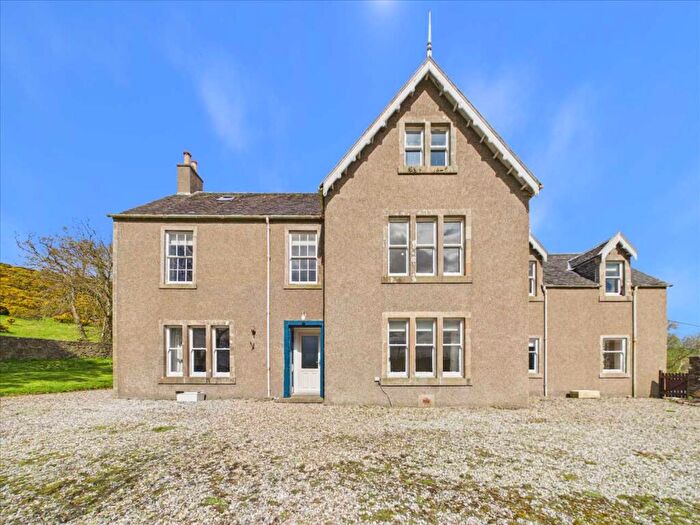
Properties for sale in Campbeltown
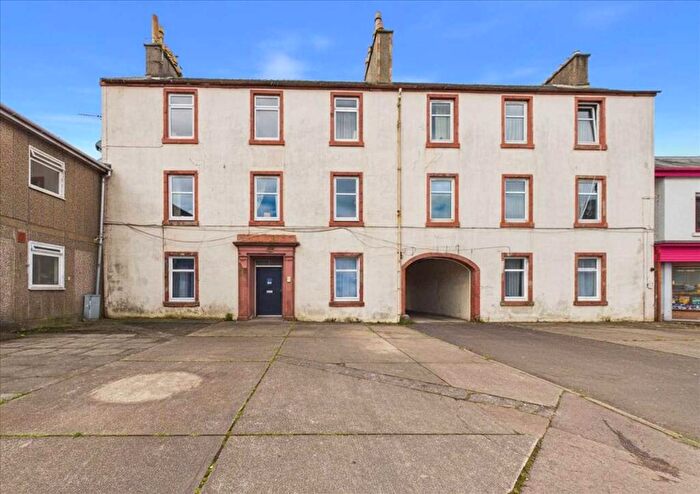
![]()
If you are looking to sell your house, let it out, or receive a property valuation, an expert can help you.
Click the button below to get started.
Neighbourhoods in Campbeltown
Navigate through our locations to find the location of your next house in Campbeltown, Argyll and Bute for sale or to rent.
Transport in Campbeltown
Please see below transportation links in this area:
-
 Girvan Station
 -
Ardrossan Harbour Station
-
Ardrossan Town Station
-
West Kilbride Station
-
Ardrossan South Beach Station
-
Saltcoats Station
-
Stevenston Station
-
Fairlie Station
-
Maybole Station
-
Largs Station
- FAQ
- Price Paid By Year
Frequently asked questions about Campbeltown
What is the average price for a property for sale in Campbeltown?
The average price for a property for sale in Campbeltown is £115,572. This amount is 45% lower than the average price in Argyll and Bute. There are 390 property listings for sale in Campbeltown.
What locations have the most expensive properties for sale in Campbeltown?
The location with the most expensive properties for sale in Campbeltown is Kintyre and the Islands at an average of £150,909.
What locations have the most affordable properties for sale in Campbeltown?
The location with the most affordable properties for sale in Campbeltown is South Kintyre at an average of £113,096.
Which train stations are available in or near Campbeltown?
Some of the train stations available in or near Campbeltown are Girvan, Ardrossan Harbour and Ardrossan Town.
Property Price Paid in Campbeltown by Year
The average sold property price by year was:
| Year | Average Sold Price | Price Change |
Sold Properties
|
|---|---|---|---|
| 2025 | £125,885 | 21% |
51 Properties |
| 2024 | £99,375 | -21% |
52 Properties |
| 2023 | £120,438 | -11% |
65 Properties |
| 2022 | £134,131 | 19% |
159 Properties |
| 2021 | £108,062 | -5% |
176 Properties |
| 2020 | £113,242 | 14% |
119 Properties |
| 2019 | £97,865 | -9% |
110 Properties |
| 2018 | £107,002 | -4% |
116 Properties |
| 2017 | £110,954 | 17% |
137 Properties |
| 2016 | £91,632 | -20% |
118 Properties |
| 2015 | £109,659 | 24% |
123 Properties |
| 2014 | £83,481 | -18% |
111 Properties |
| 2013 | £98,534 | -2% |
95 Properties |
| 2012 | £100,698 | -5% |
93 Properties |
| 2011 | £106,064 | 6% |
95 Properties |
| 2010 | £99,691 | 4% |
89 Properties |
| 2009 | £95,601 | 7% |
115 Properties |
| 2008 | £89,232 | -8% |
146 Properties |
| 2007 | £96,001 | 15% |
184 Properties |
| 2006 | £81,341 | 11% |
183 Properties |
| 2005 | £72,164 | 24% |
189 Properties |
| 2004 | £55,038 | 18% |
211 Properties |
| 2003 | £45,133 | -2% |
216 Properties |
| 2002 | £46,075 | 1% |
195 Properties |
| 2001 | £45,696 | - |
14 Properties |