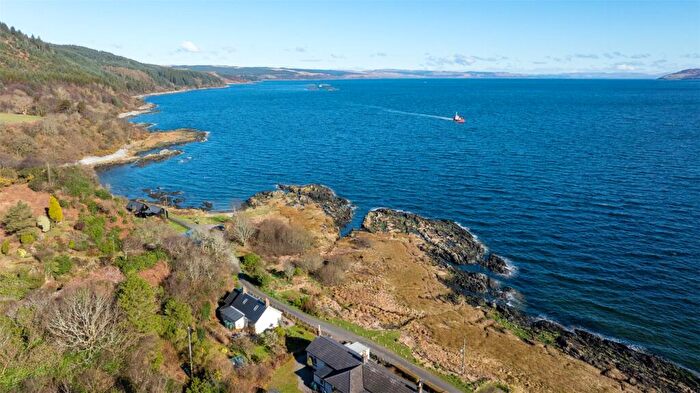
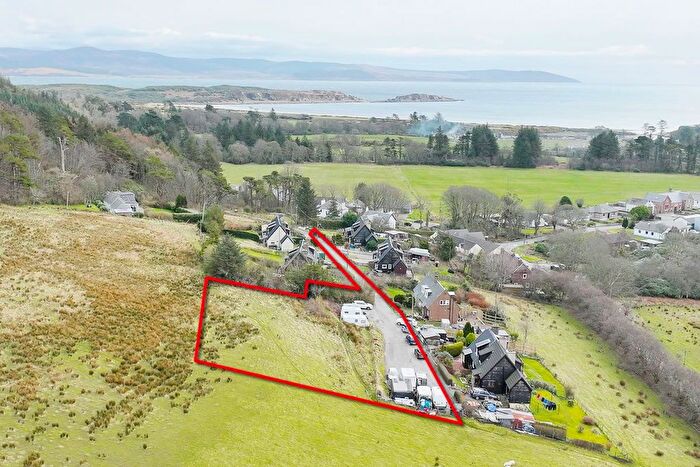
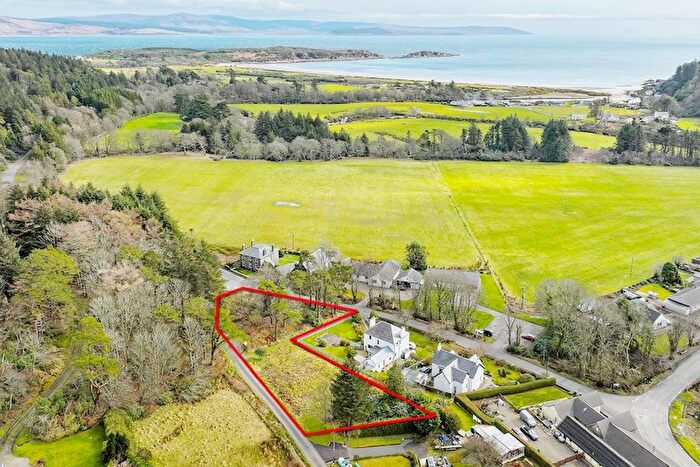
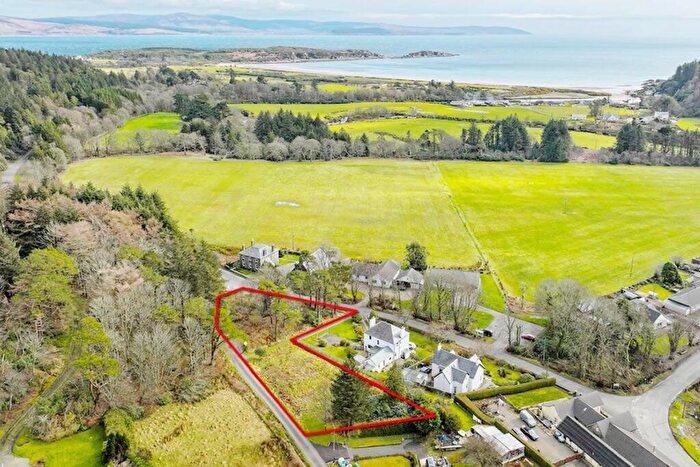
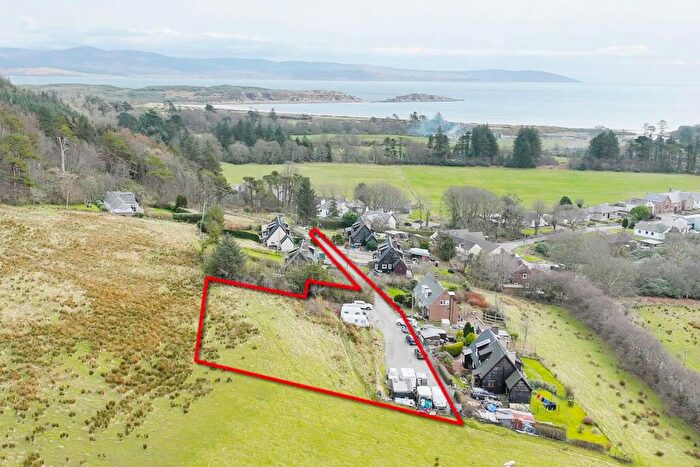
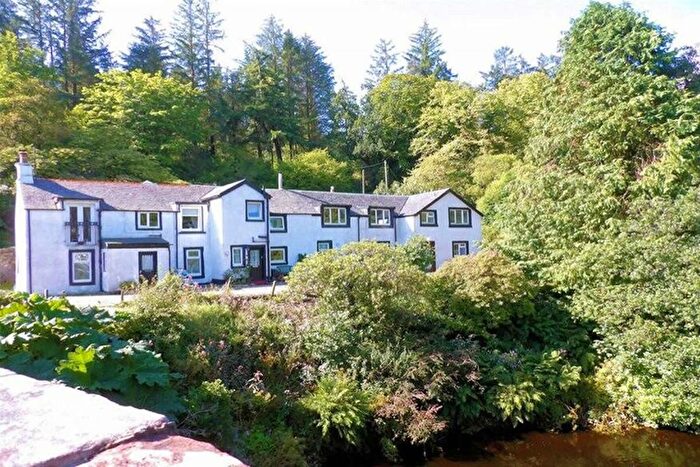
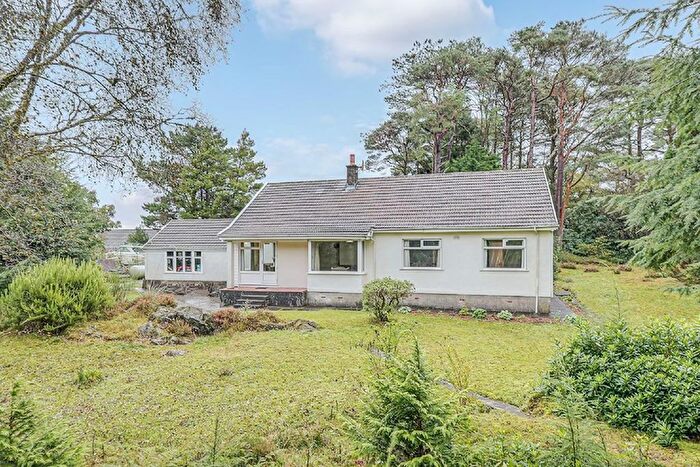
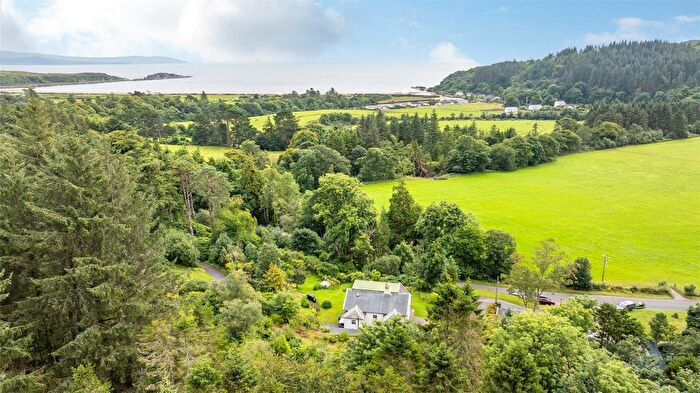
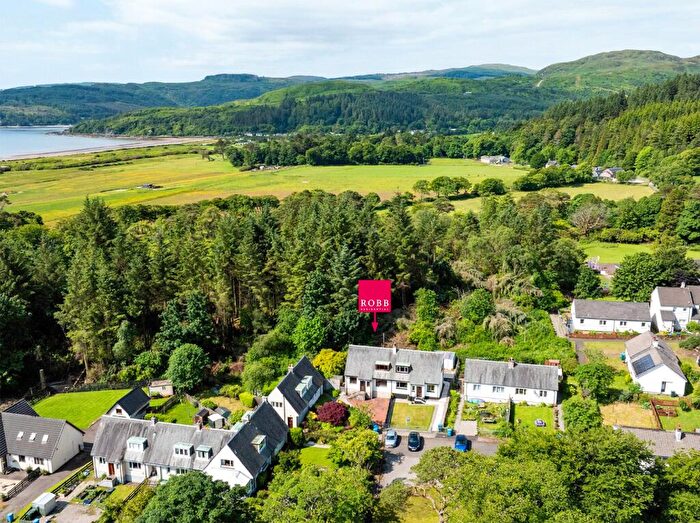
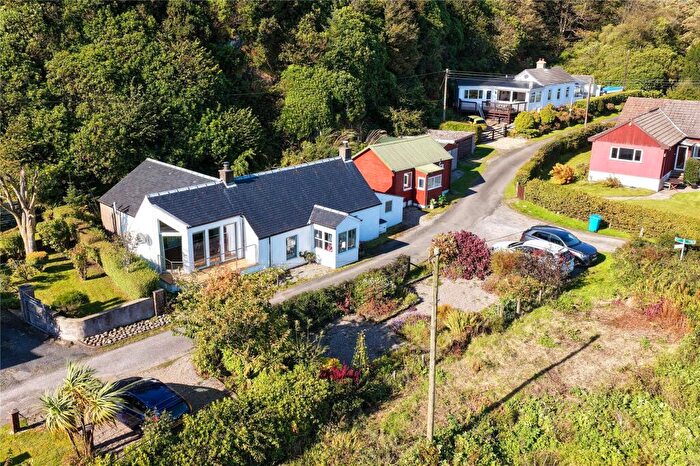
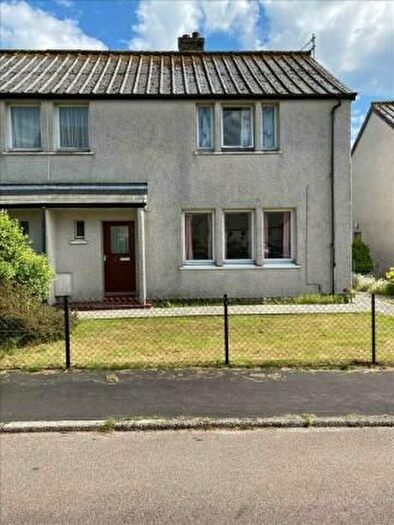
Houses for sale & to rent in Kintyre and the Islands, Campbeltown
House Prices in Kintyre and the Islands
Properties in Kintyre and the Islands have an average house price of £315,000.00 and had 1 Property Transaction within the last 3 years¹.
Kintyre and the Islands is an area in Campbeltown, Argyll and Bute with 248 households², where the most expensive property was sold for £315,000.00.
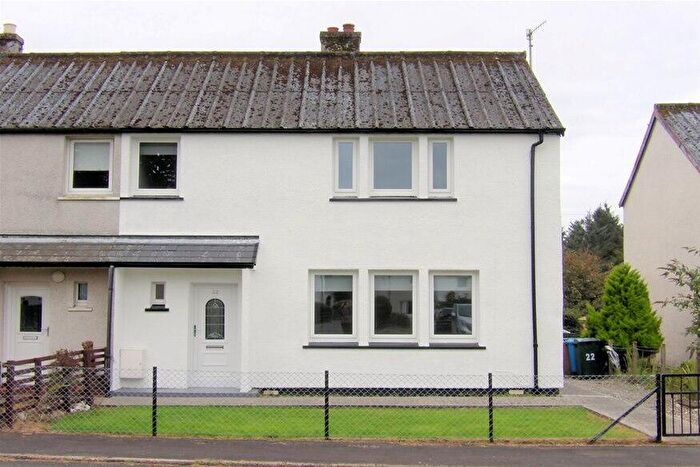
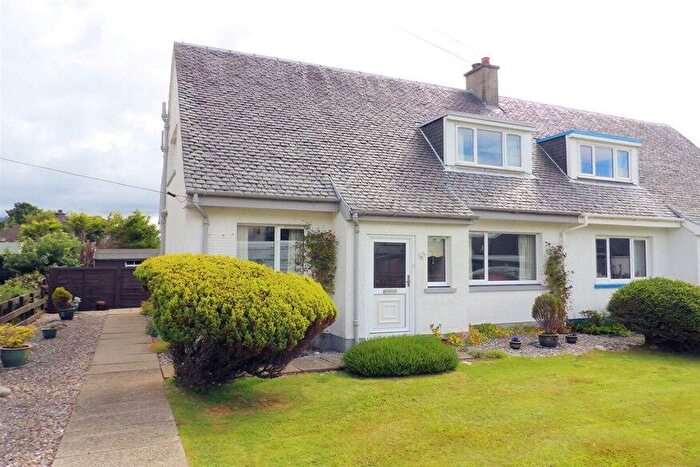
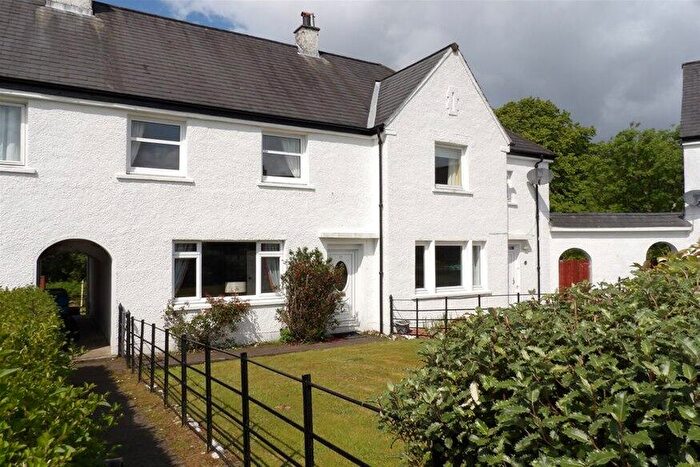
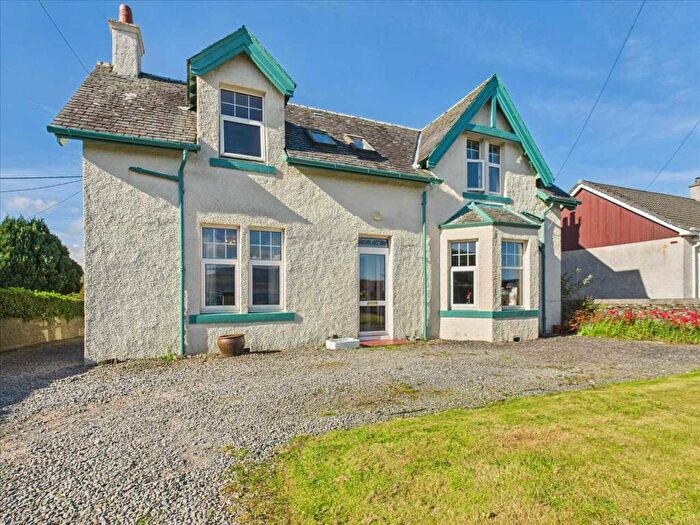
Properties for sale in Kintyre and the Islands
Previously listed properties in Kintyre and the Islands
Roads and Postcodes in Kintyre and the Islands
Navigate through our locations to find the location of your next house in Kintyre and the Islands, Campbeltown for sale or to rent.
| Streets | Postcodes |
|---|---|
| Airds | PA28 6RY |
| Broomfield | PA28 6RZ |
| High Airds | PA28 6SA |
| Hillside Road | PA28 6SF |
| Lochpark | PA28 6SG |
| Port Righ | PA28 6SE |
| Shore Road | PA28 6SH |
| The Pier | PA28 6SQ |
| Tormhor | PA28 6SD |
| Toshs Park | PA28 6QN |
| Woodside | PA28 6SB |
| PA28 6GX PA28 6QG PA28 6QJ PA28 6QL PA28 6QQ PA28 6QT PA28 6QU PA28 6QX PA28 6QY |
Transport near Kintyre and the Islands
-
West Kilbride Station
-
Ardrossan Harbour Station
-
Ardrossan Town Station
-
Ardrossan South Beach Station
-
Fairlie Station
-
Saltcoats Station
-
Largs Station
-
Stevenston Station
- FAQ
- Price Paid By Year
Frequently asked questions about Kintyre and the Islands
What is the average price for a property for sale in Kintyre and the Islands?
The average price for a property for sale in Kintyre and the Islands is £315,000. This amount is 110% higher than the average price in Campbeltown. There are 48 property listings for sale in Kintyre and the Islands.
Which train stations are available in or near Kintyre and the Islands?
Some of the train stations available in or near Kintyre and the Islands are West Kilbride, Ardrossan Harbour and Ardrossan Town.
Property Price Paid in Kintyre and the Islands by Year
The average sold property price by year was:
| Year | Average Sold Price | Price Change |
Sold Properties
|
|---|---|---|---|
| 2023 | £315,000 | 46% |
1 Property |
| 2022 | £171,173 | -7% |
13 Properties |
| 2021 | £182,388 | -2% |
9 Properties |
| 2020 | £186,250 | 34% |
8 Properties |
| 2019 | £123,400 | -17% |
10 Properties |
| 2018 | £144,327 | -15% |
9 Properties |
| 2017 | £166,336 | 37% |
17 Properties |
| 2016 | £104,733 | -92% |
22 Properties |
| 2015 | £201,041 | 47% |
12 Properties |
| 2014 | £106,357 | 3% |
14 Properties |
| 2013 | £103,563 | -1% |
11 Properties |
| 2012 | £104,428 | -14% |
7 Properties |
| 2011 | £118,526 | 22% |
9 Properties |
| 2010 | £92,083 | -33% |
6 Properties |
| 2009 | £122,383 | 3% |
12 Properties |
| 2008 | £119,207 | -1% |
11 Properties |
| 2007 | £119,818 | 62% |
20 Properties |
| 2006 | £45,080 | -159% |
2 Properties |
| 2005 | £116,697 | 39% |
12 Properties |
| 2004 | £71,566 | -2% |
15 Properties |
| 2003 | £72,951 | 28% |
9 Properties |
| 2002 | £52,282 | 26% |
19 Properties |
| 2001 | £38,578 | - |
2 Properties |

