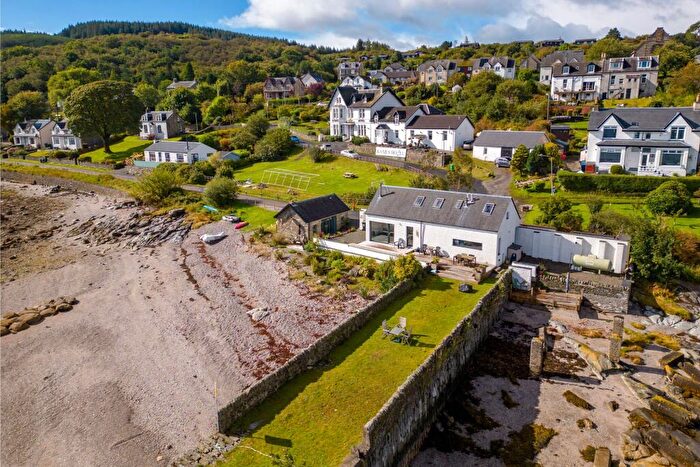
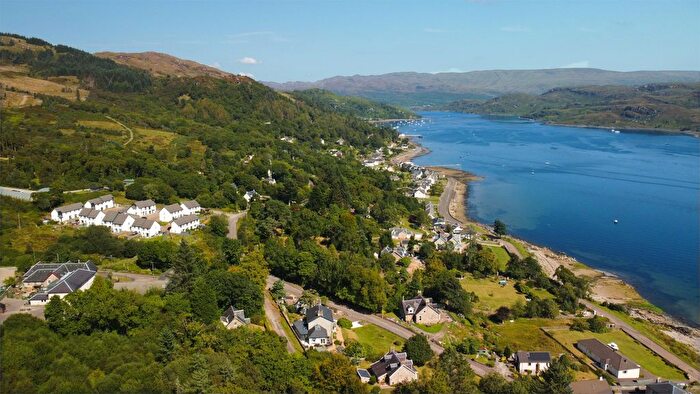
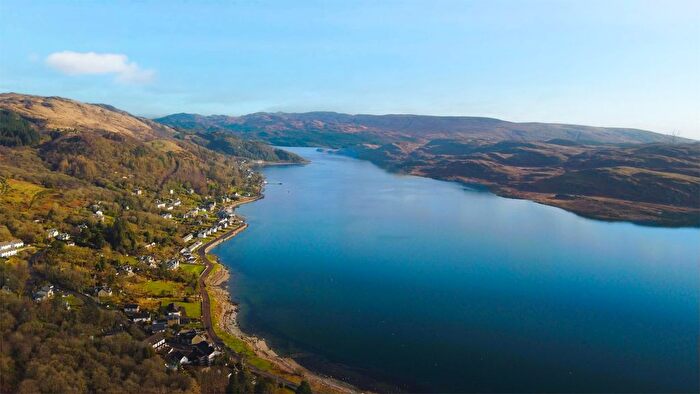
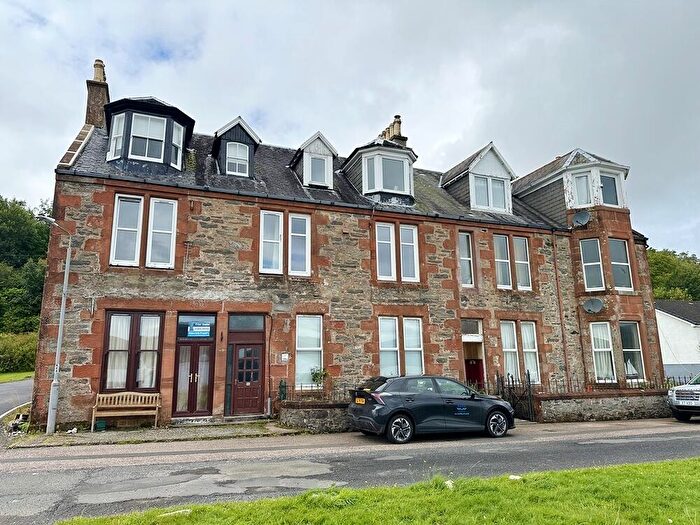
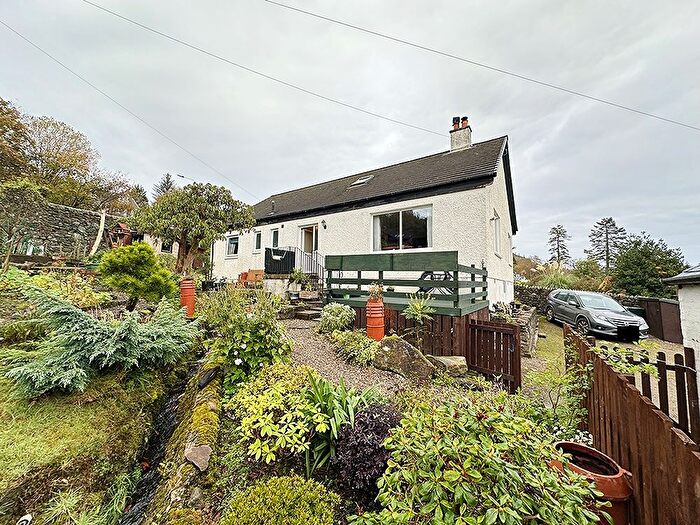
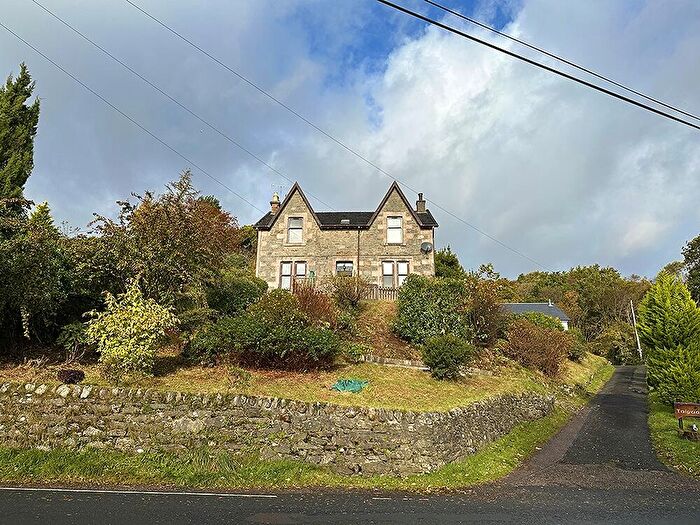
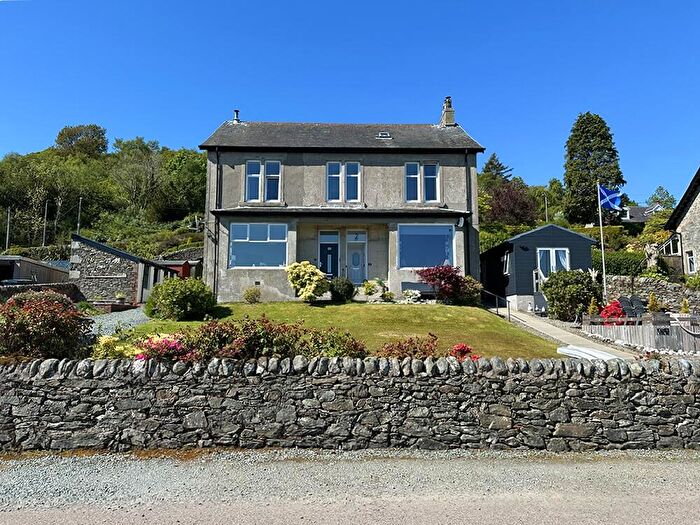
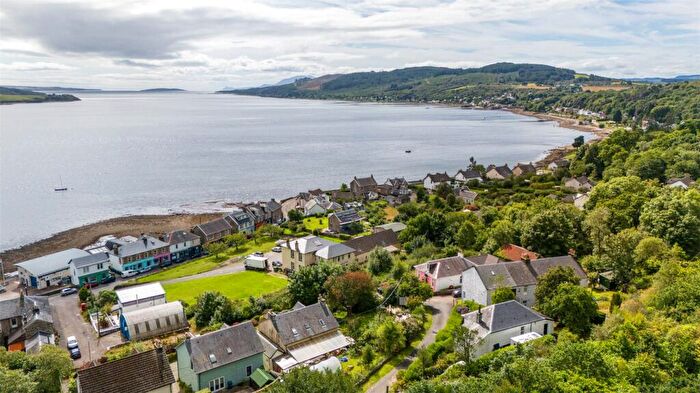
Houses for sale & to rent in Cowal, Tighnabruaich
House Prices in Cowal
Properties in Cowal have an average house price of £276,000.00 and had 7 Property Transactions within the last 3 years¹.
Cowal is an area in Tighnabruaich, Argyll and Bute with 413 households², where the most expensive property was sold for £553,000.00.
Properties for sale in Cowal
Previously listed properties in Cowal
Roads and Postcodes in Cowal
Navigate through our locations to find the location of your next house in Cowal, Tighnabruaich for sale or to rent.
| Streets | Postcodes |
|---|---|
| Berryburn | PA21 2BQ |
| Cowal Terrace | PA21 2BZ |
| Highfield | PA21 2AQ |
| Kyles Court | PA21 2AJ |
| Manor Way | PA21 2BF |
| Otter Ferry | PA21 2DH |
| PA21 2AA PA21 2AB PA21 2AD PA21 2AE PA21 2AF PA21 2AG PA21 2AH PA21 2BA PA21 2BB PA21 2BD PA21 2BE PA21 2BG PA21 2BH PA21 2BJ PA21 2BL PA21 2BN PA21 2BP PA21 2BS PA21 2BT PA21 2BU PA21 2BW PA21 2BX PA21 2BY PA21 2DA PA21 2DR PA21 2DS PA21 2DT PA21 2DU PA21 2DX PA21 2DY PA21 2EA PA21 2EB PA21 2ED PA21 2EE PA21 2EG PA21 2EH PA21 2EJ PA21 2EP PA21 2ER PA21 2YY PA21 2DB |
Transport near Cowal
-
Wemyss Bay Station
-
Inverkip Station
-
IBM Station
-
Largs Station
-
Gourock Station
-
Branchton Station
-
Fort Matilda Station
-
Fairlie Station
-
Drumfrochar Station
-
Greenock West Station
- FAQ
- Price Paid By Year
Frequently asked questions about Cowal
What is the average price for a property for sale in Cowal?
The average price for a property for sale in Cowal is £276,000. There are 133 property listings for sale in Cowal.
Which train stations are available in or near Cowal?
Some of the train stations available in or near Cowal are Wemyss Bay, Inverkip and IBM.
Property Price Paid in Cowal by Year
The average sold property price by year was:
| Year | Average Sold Price | Price Change |
Sold Properties
|
|---|---|---|---|
| 2023 | £276,000 | 9% |
7 Properties |
| 2022 | £250,785 | 18% |
28 Properties |
| 2021 | £206,353 | -13% |
43 Properties |
| 2020 | £233,636 | 25% |
22 Properties |
| 2019 | £174,091 | 7% |
33 Properties |
| 2018 | £161,480 | -6% |
25 Properties |
| 2017 | £170,398 | 20% |
31 Properties |
| 2016 | £136,024 | -0,1% |
30 Properties |
| 2015 | £136,227 | -25% |
25 Properties |
| 2014 | £170,217 | 19% |
24 Properties |
| 2013 | £138,500 | -35% |
23 Properties |
| 2012 | £187,345 | 33% |
23 Properties |
| 2011 | £125,773 | -49% |
21 Properties |
| 2010 | £187,422 | 34% |
10 Properties |
| 2009 | £123,340 | 6% |
15 Properties |
| 2008 | £115,500 | -54% |
20 Properties |
| 2007 | £178,309 | -42% |
29 Properties |
| 2006 | £253,940 | 42% |
30 Properties |
| 2005 | £146,821 | -10% |
36 Properties |
| 2004 | £161,235 | 54% |
40 Properties |
| 2003 | £74,337 | 1% |
29 Properties |
| 2002 | £73,528 | 59% |
36 Properties |
| 2001 | £30,000 | - |
1 Property |

