
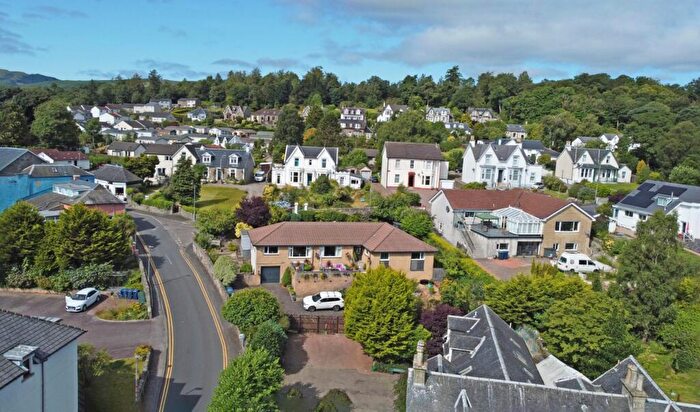
Houses for sale in Dunoon, Dunoon
House Prices in Dunoon
Properties in Dunoon have an average house price of £153k and had 147 Property Transactions within the last 3 years¹.
Dunoon is an area in Dunoon, Argyll and Bute with 3,727 households², where the most expensive property was sold for £470k.
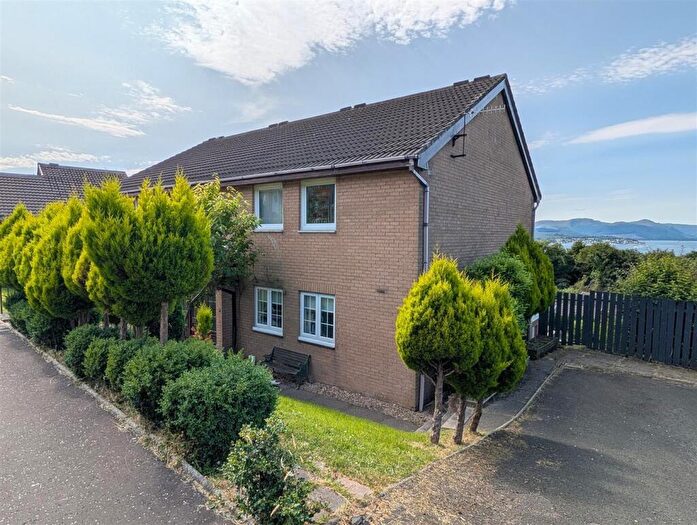
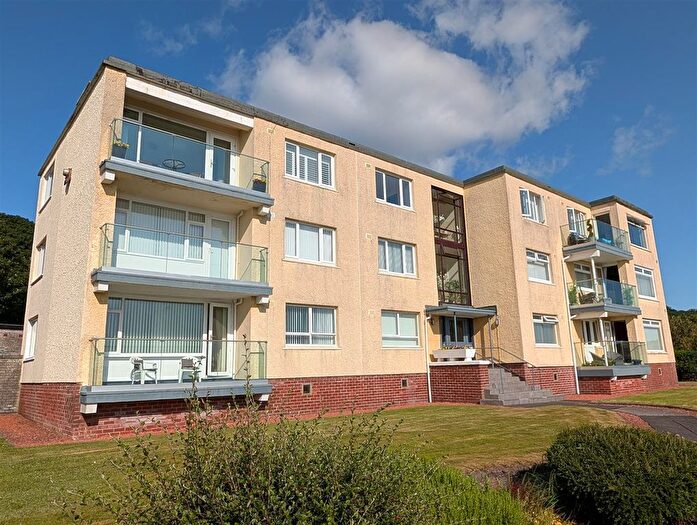
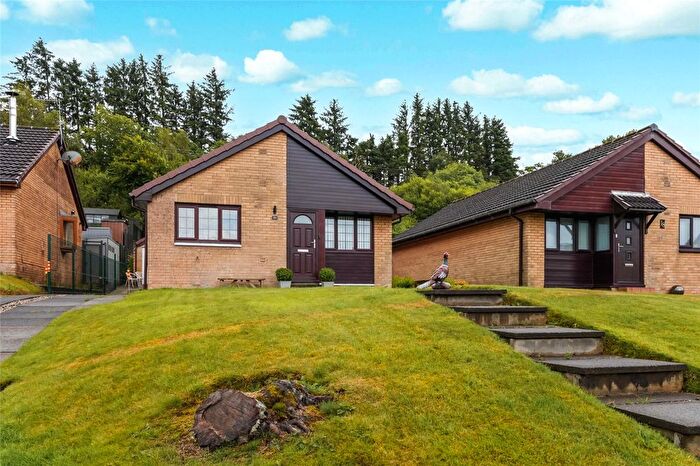
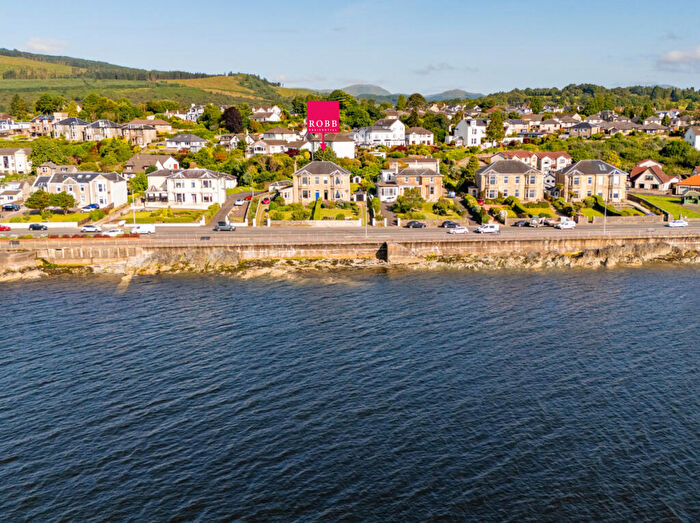
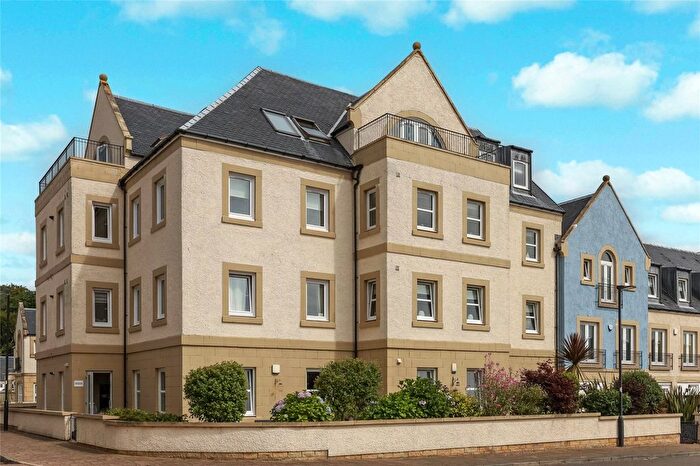
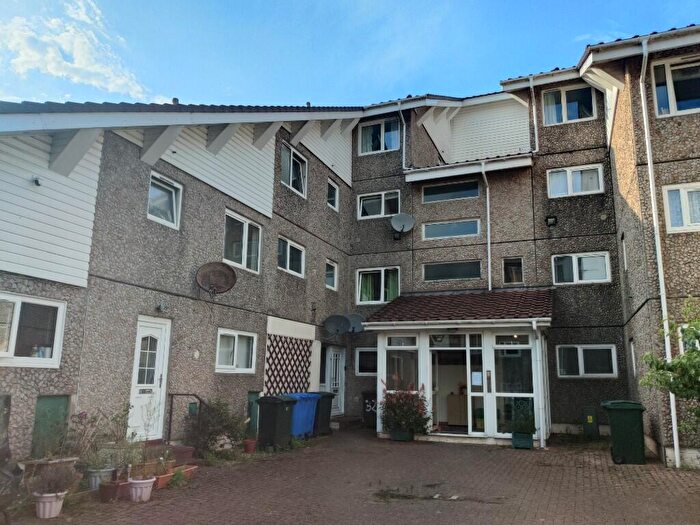
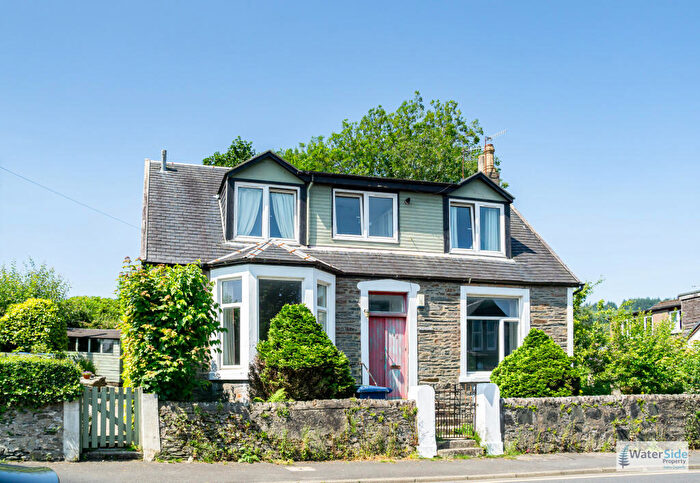
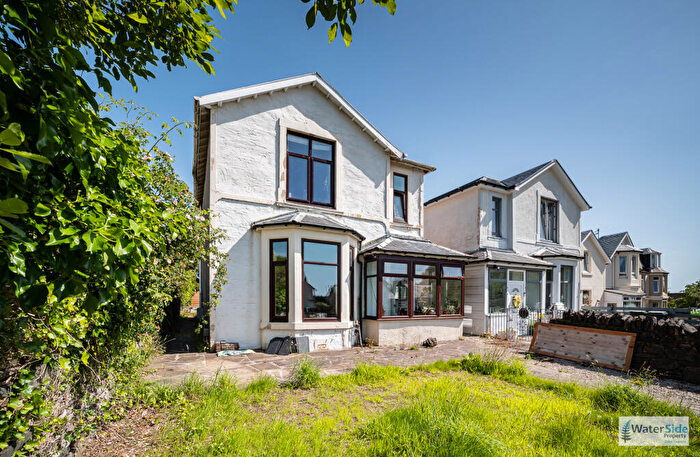
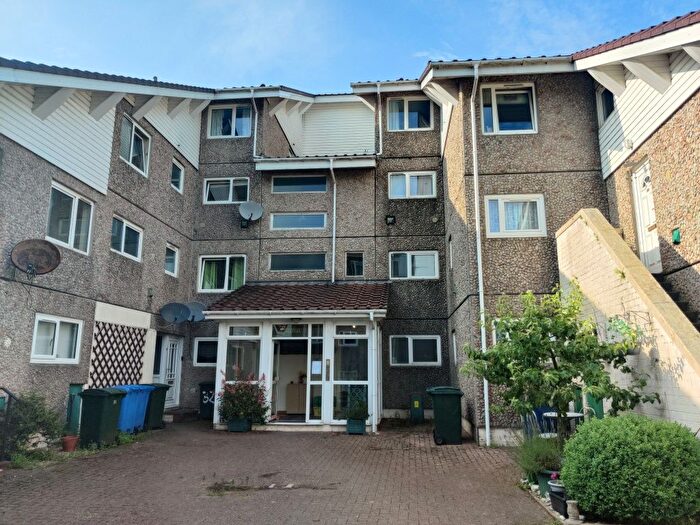
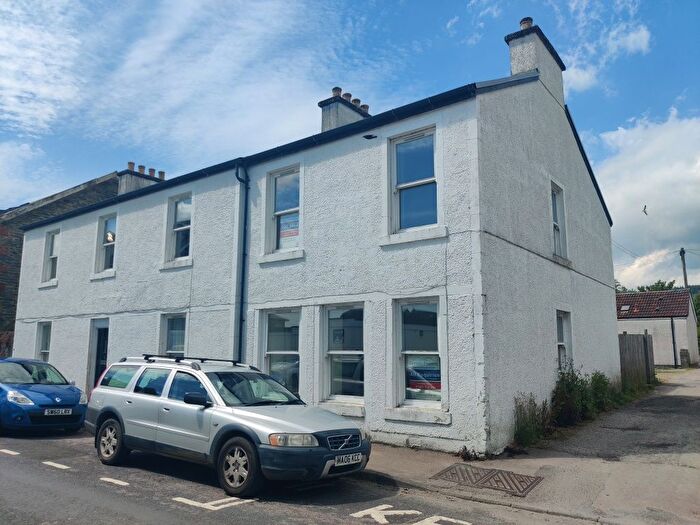
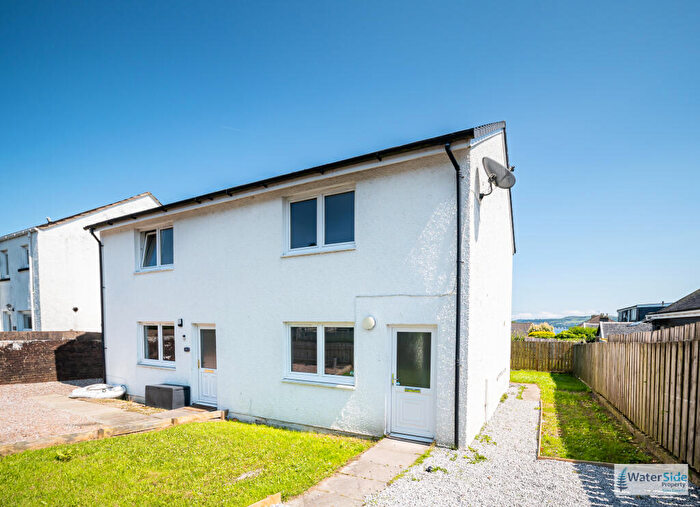
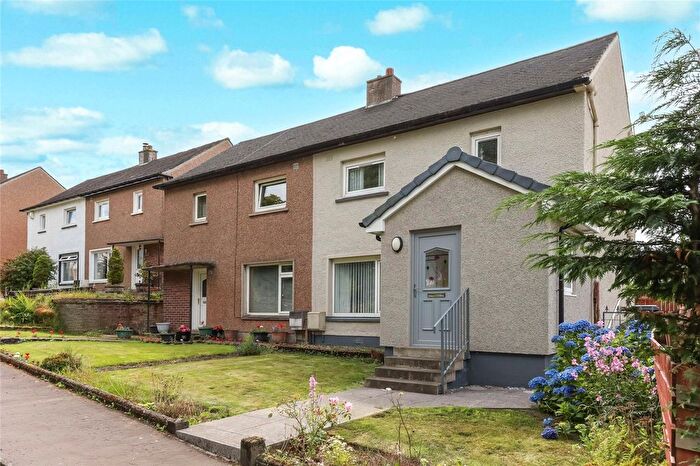
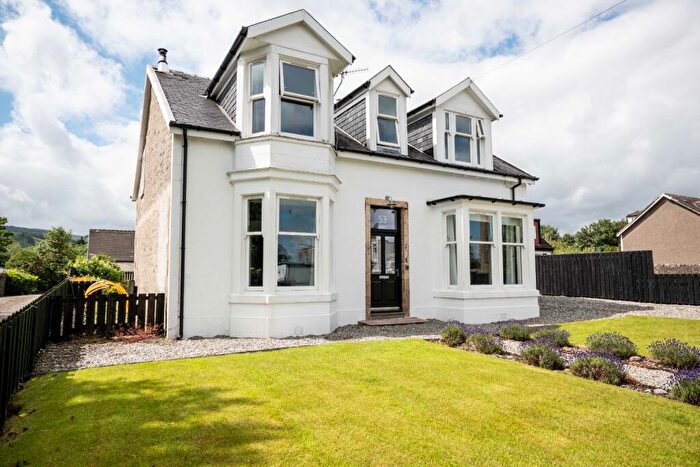
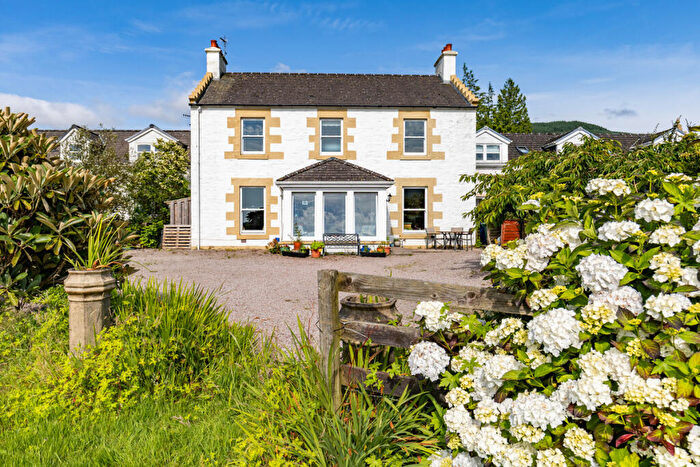
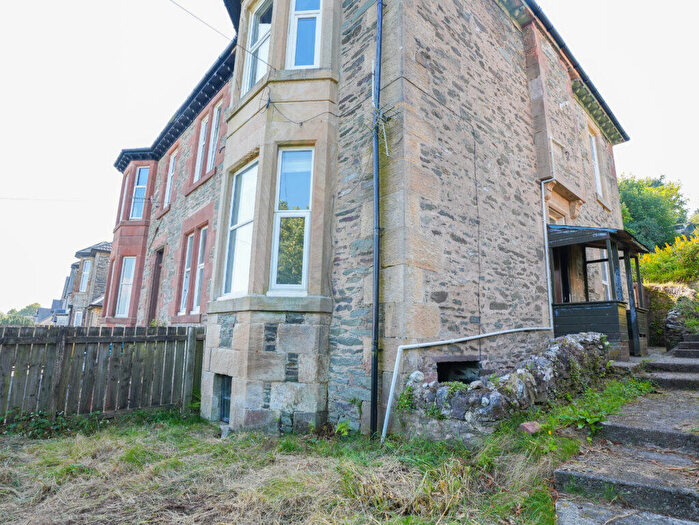
Properties for sale in Dunoon
![]()
If you are looking to sell your house, let it out, or receive a property valuation, an expert can help you.
Click the button below to get started.
Roads and Postcodes in Dunoon
Navigate through our locations to find the location of your next house in Dunoon, Dunoon for sale or to rent.
Property price trends in Dunoon
According to the latest Registers of Scotland data, the average home in Dunoon sold for £178,418 in 2025. That figure comes from 3,835 sales logged over the past 24 years.
Prices have continued to climb over the last three years. Compared with 2022, when the typical sale came in around £156,975, that's a rise of roughly 13.7%.
Looking back five years, average prices are up about 27.6% since 2020, a gain of around £38,586 in cash terms.
Zoom out to the past decade for the fuller picture. Back in 2015, homes here averaged £122,851, so the typical sold price has climbed about 45.2% since then, roughly 3.8% a year. Stretch the view to fifteen years and that annual pace eases back to about 2.2%.
Frequently asked questions about Dunoon
What is the average price for a property for sale in Dunoon?
The average price for a property for sale in Dunoon is £153,286. This amount is 4% lower than the average price in Dunoon. There are 2,132 property listings for sale in Dunoon.
What streets have the most expensive properties for sale in Dunoon?
The streets with the most expensive properties for sale in Dunoon are Calderwood at an average of £435,000, Kilbride Road at an average of £385,000 and Bullwood Road at an average of £307,583.
What streets have the most affordable properties for sale in Dunoon?
The streets with the most affordable properties for sale in Dunoon are Hillfoot Street at an average of £29,250, Sanderson Drive at an average of £55,666 and Alfred Street at an average of £65,500.
Which train stations are available in or near Dunoon?
Some of the train stations available in or near Dunoon are Inverkip, IBM and Wemyss Bay.
Property Price Paid in Dunoon by Year
The average sold property price by year was:
| Year | Average Sold Price | Price Change |
Sold Properties
|
|---|---|---|---|
| 2025 | £178,418 | 20% |
49 Properties |
| 2024 | £142,768 | 2% |
37 Properties |
| 2023 | £139,479 | -13% |
61 Properties |
| 2022 | £156,975 | 12% |
177 Properties |
| 2021 | £138,267 | -1% |
243 Properties |
| 2020 | £139,832 | 6% |
142 Properties |
| 2019 | £130,986 | 9% |
181 Properties |
| 2018 | £118,825 | 1% |
145 Properties |
| 2017 | £117,140 | -10% |
150 Properties |
| 2016 | £128,358 | 4% |
130 Properties |
