
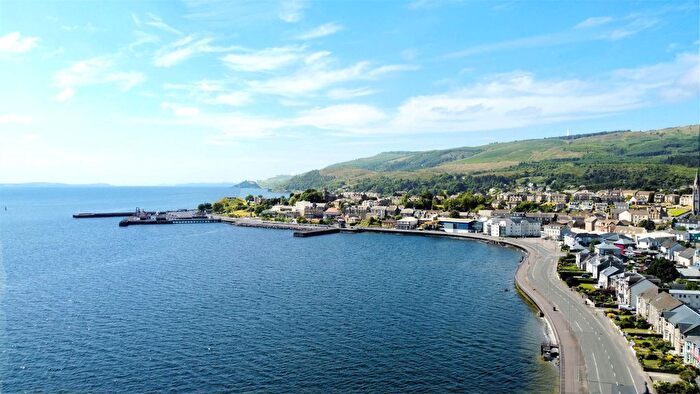
Houses for sale in Dunoon, Argyll and Bute
House Prices in Dunoon
Properties in Dunoon have an average house price of £159k and had 267 Property Transactions within the last 3 years.¹
Dunoon is an area in Argyll and Bute with 5,956 households², where the most expensive property was sold for £470k.
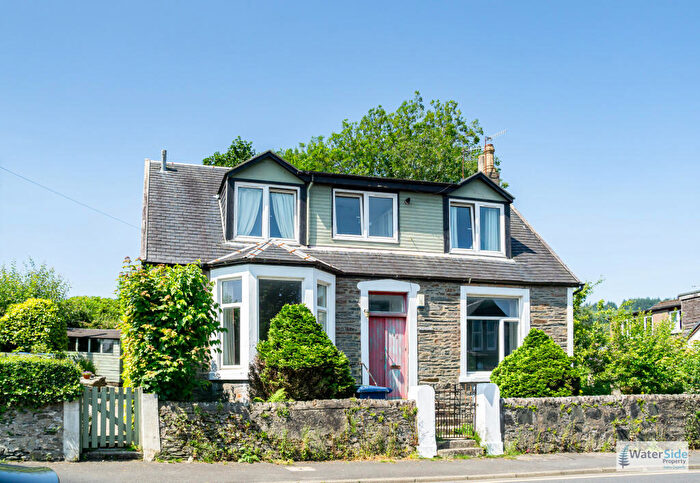
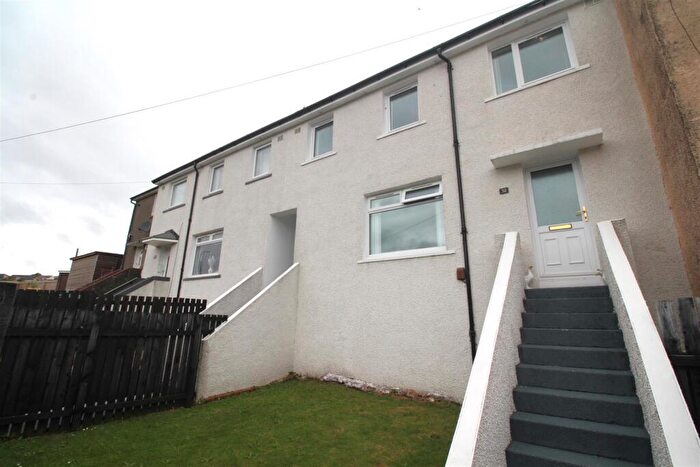
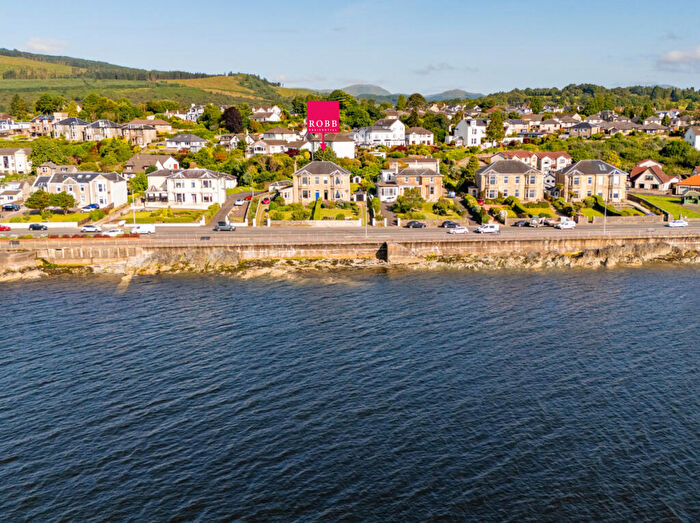
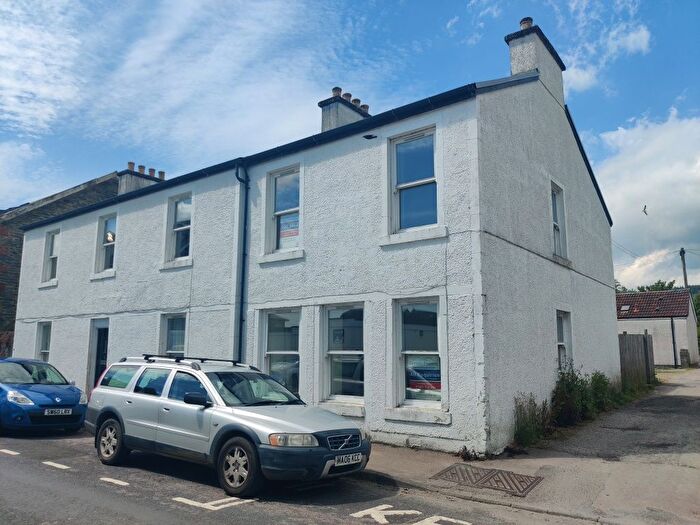
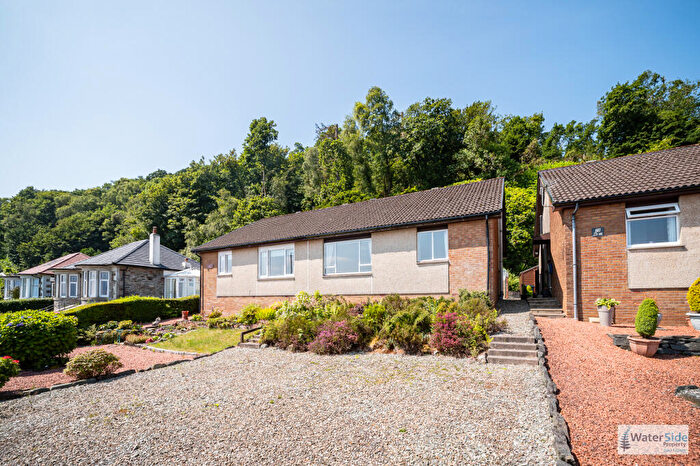
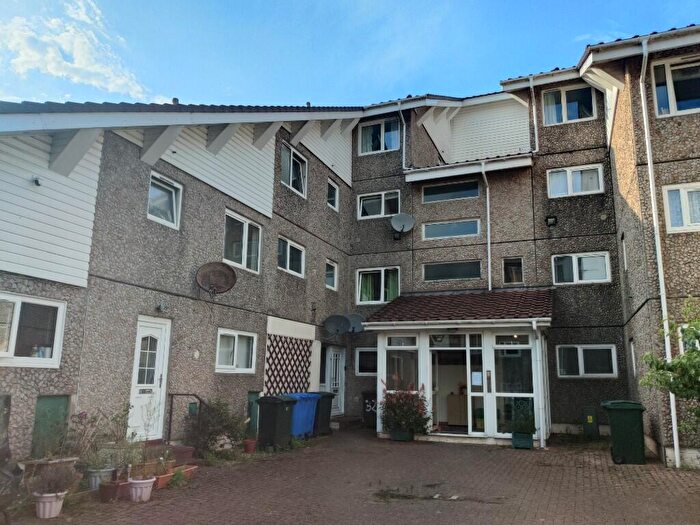
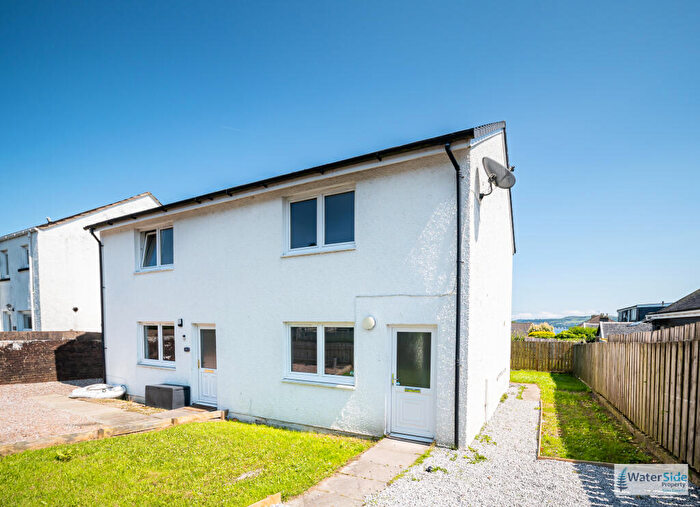
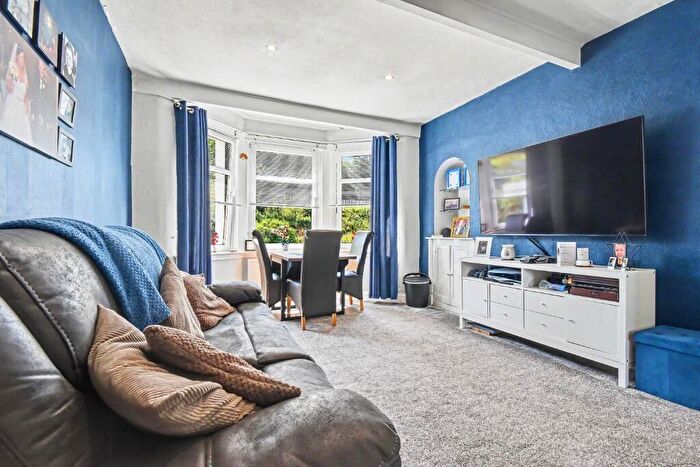
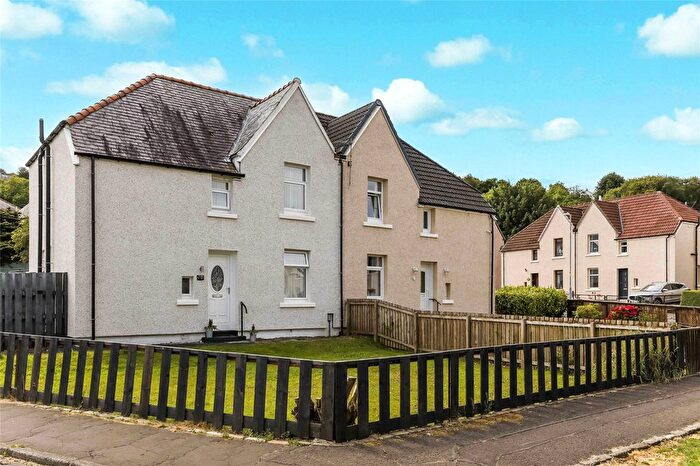
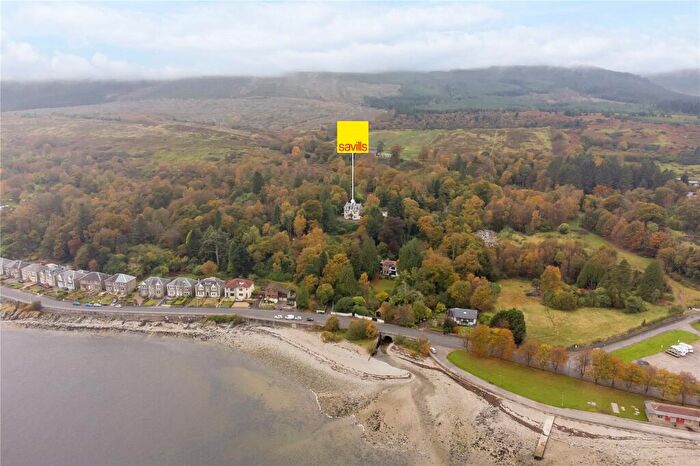
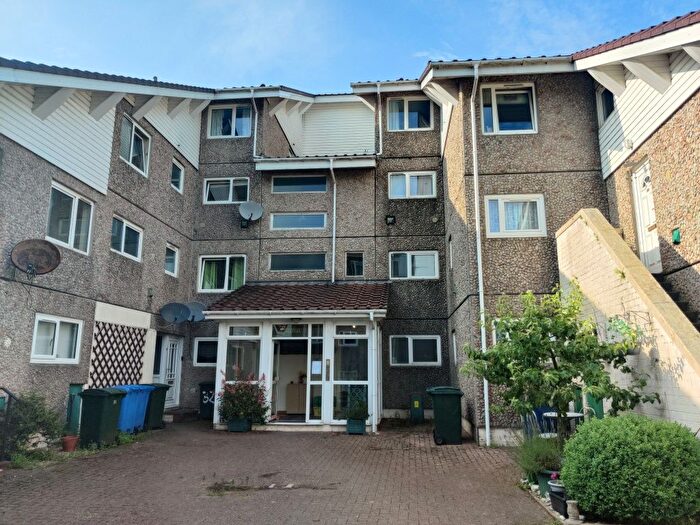
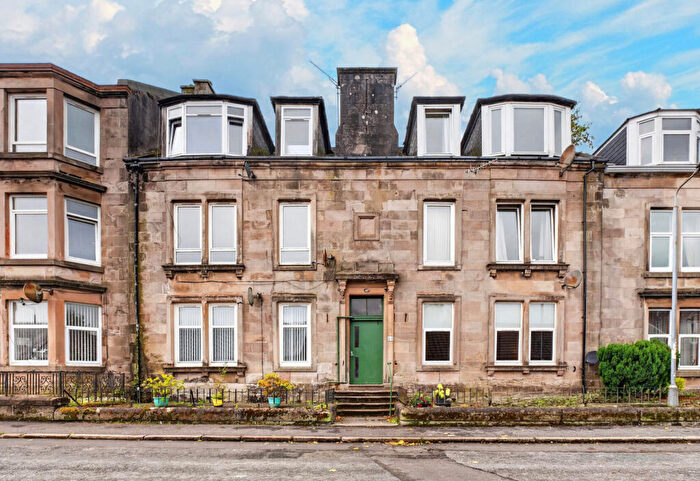
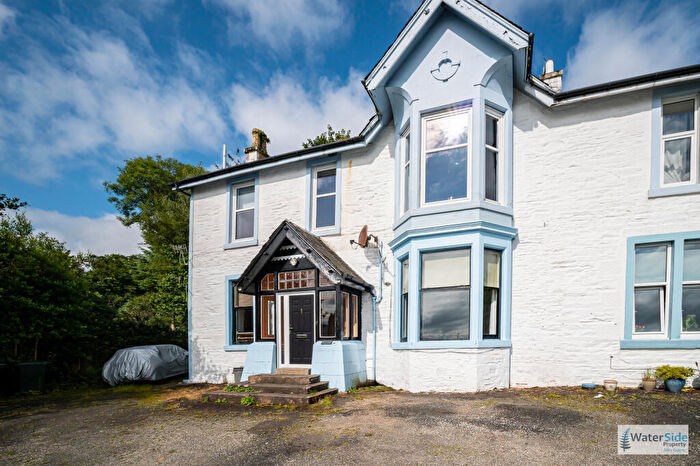
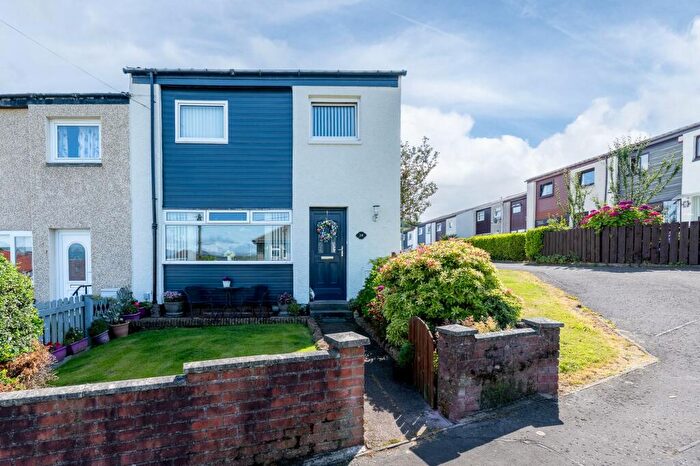
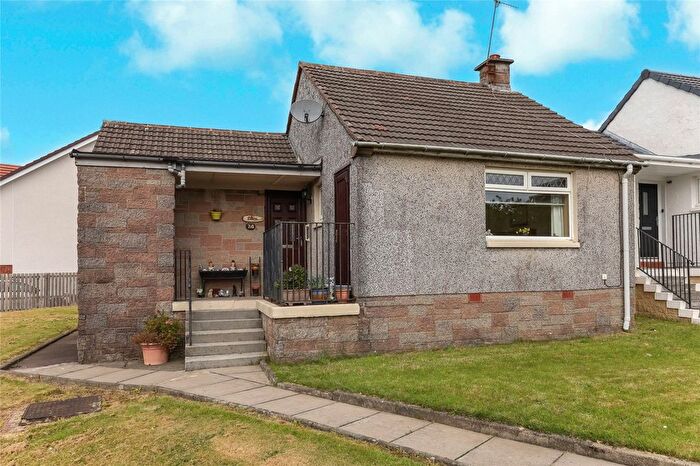
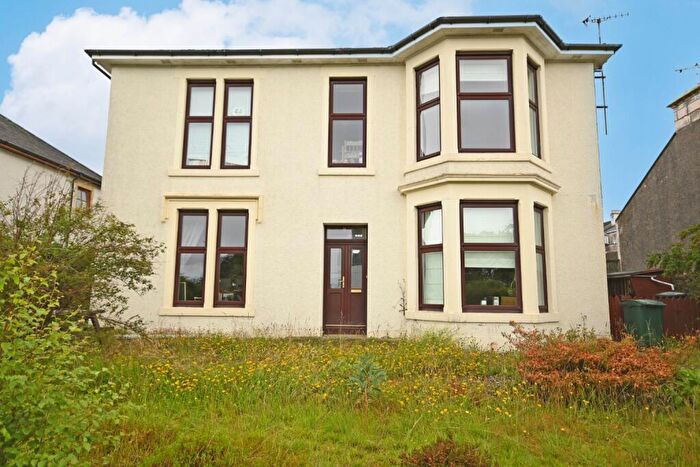
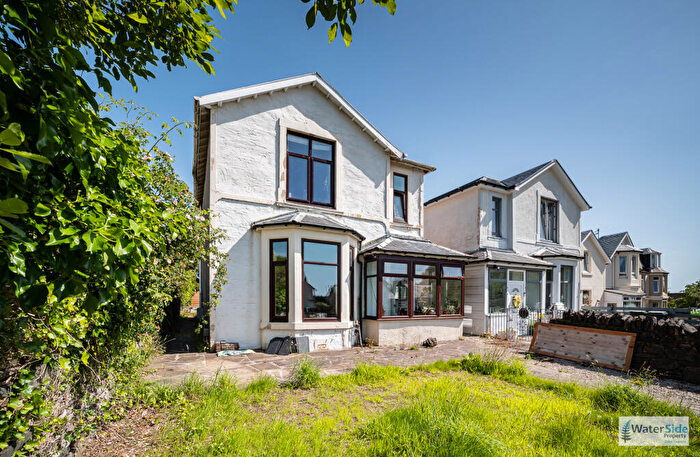
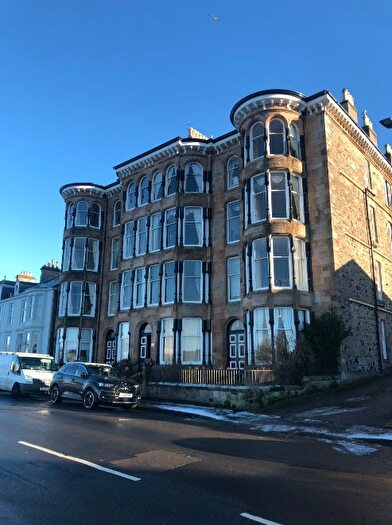
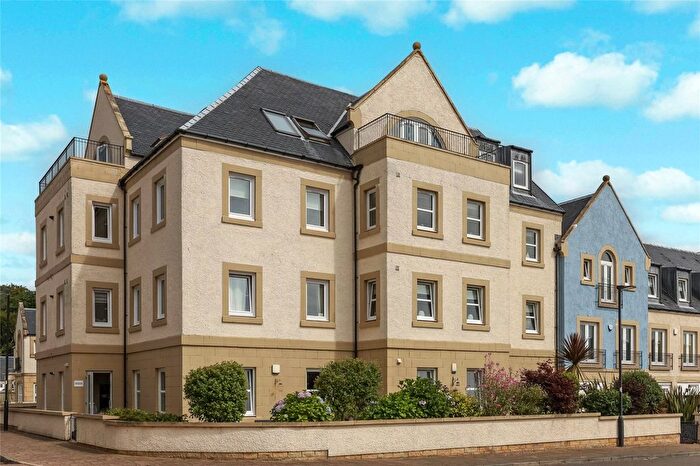
Properties for sale in Dunoon
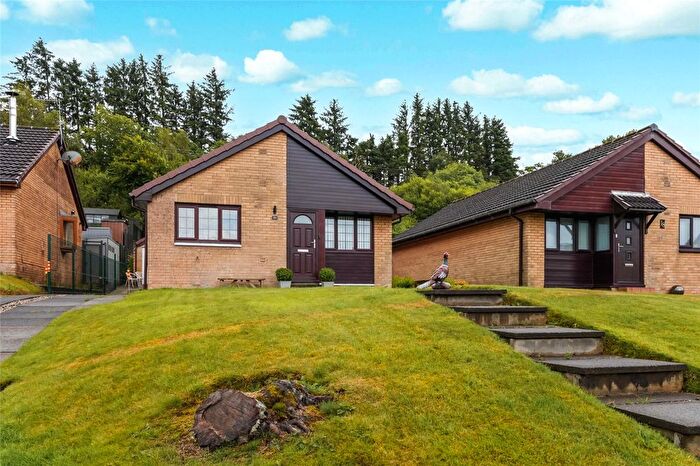
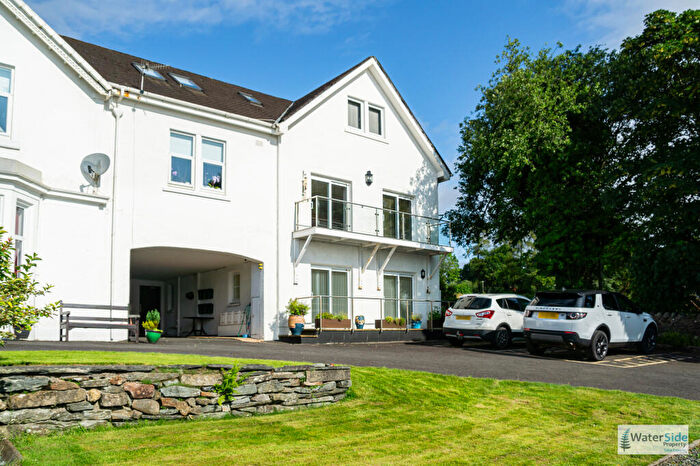
![]()
If you are looking to sell your house, let it out, or receive a property valuation, an expert can help you.
Click the button below to get started.
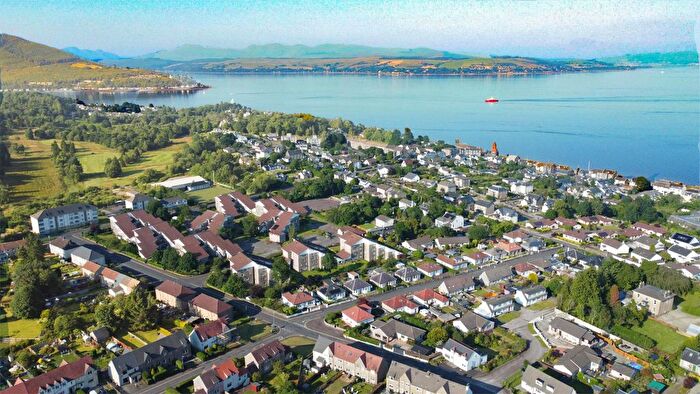
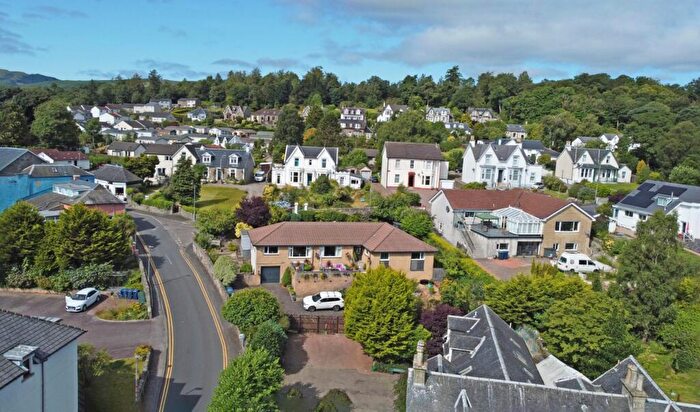
Neighbourhoods in Dunoon
Navigate through our locations to find the location of your next house in Dunoon, Argyll and Bute for sale or to rent.
Property price trends in Dunoon
According to the latest Registers of Scotland data, the average home in Dunoon sold for £174,614 in 2025. That figure comes from a substantial record of 6,610 sales logged over the past 24 years.
Prices have held fairly steady over the last three years. Compared with 2022, when the typical sale came in around £172,745, values are broadly unchanged.
Looking back five years, average prices are up about 14.7% since 2020, a gain of around £22,342 in cash terms.
Zoom out to the past decade for the fuller picture. Back in 2015, homes here averaged £124,702, so the typical sold price has climbed about 40% since then, roughly 3.4% a year. Stretch the view to fifteen years and that annual pace eases back to about 1.9%.
Frequently asked questions about Dunoon
What is the average price for a property for sale in Dunoon?
The average price for a property for sale in Dunoon is £159,466. This amount is 24% lower than the average price in Argyll and Bute. There are 7,190 property listings for sale in Dunoon.
What locations have the most expensive properties for sale in Dunoon?
The location with the most expensive properties for sale in Dunoon is Cowal at an average of £167,035.
What locations have the most affordable properties for sale in Dunoon?
The location with the most affordable properties for sale in Dunoon is Dunoon at an average of £153,286.
Which train stations are available in or near Dunoon?
Some of the train stations available in or near Dunoon are Inverkip, IBM and Gourock.
Property Price Paid in Dunoon by Year
The average sold property price by year was:
| Year | Average Sold Price | Price Change |
Sold Properties
|
|---|---|---|---|
| 2025 | £174,614 | 16% |
74 Properties |
| 2024 | £146,110 | -8% |
72 Properties |
| 2023 | £158,148 | -9% |
121 Properties |
| 2022 | £172,745 | 14% |
301 Properties |
| 2021 | £148,669 | -2% |
384 Properties |
| 2020 | £152,272 | 11% |
254 Properties |
| 2019 | £135,241 | 7% |
309 Properties |
| 2018 | £125,814 | -1% |
290 Properties |
| 2017 | £127,045 | -3% |
259 Properties |
| 2016 | £131,360 | 5% |
270 Properties |
Transport in Dunoon
Please see below transportation links in this area:
